Abstract
DNA is the carrier of genetic information, and as such, is at the center of most essential cellular processes. To regulate its physiological function, specific proteins and motor enzymes constantly change its conformational state with well controlled dynamics. Twenty-five years ago, Schafer, Gelles, Sheetz and Landick employed the Tethered Particle Motion (TPM) technique for the first time to study transcription by RNA polymerase at the single-molecule level. TPM has since then remained one of the simplest, most affordable and yet incisive single-molecule techniques available. It is an in vitro technique which allows investigation of DNA-protein interactions that change the effective length of a DNA tether. In this chapter, we will describe a recent strategy to multiplex TPM which substantially increases the throughput of TPM experiments, as well as a simulation to estimate the time-resolution of experiments, such as transcriptional elongation assays, in which lengthy time averaging of the signal is impossible due to continual change of the DNA tether length. These improvements allow efficient study of several DNA-protein systems, including transcriptionally active DNA-RNA polymerase I complexes and DNA-gyrase complexes.
1. Introduction
Single-molecule approaches reveal biologically important molecular heterogeneity in conformational dynamics, molecular interactions, or even intermediate steps of reactions which are obscured in ensemble (bulk) measurements. Single-molecule experiments are designed to reveal the conformation and/or location of individual molecules as well as the dynamics of transitions among different molecular states. Tethered Particle Microscopy (TPM), is a conceptually simple yet elegant technique which monitors changes in the amplitude of the Brownian motion of a DNA-tethered bead in solution (Nelson et al., 2006). It is an optical method that requires tracking the position of a polystyrene bead tethered to the glass surface of a microscope flow chamber by a single DNA molecule. One distinguishing characteristic and advantage of TPM over other single-molecule techniques is the absence of significant externally applied force which may perturb interactions between the DNA and other molecules of interest. Indeed, external loads may slow and eventually inhibit the activity of DNA-processing enzymes (Neuman, Abbondanzieri, Landick, Gelles, & Block, 2003).
Therefore, TPM is well suited to observe changes in the conformations of nucleic acids, such as protein-induced looping and condensation, or in the elasticity of DNA due to protein binding as well as ionic strength. It can also be used to monitor the activity of DNA processing enzymes, such as RNA polymerases.
Since TPM has many potential applications, a few laboratories have set about optimizing protocols for experiments (Fan, 2012; Finzi & Gelles, 1995; Laurens et al., 2012; Lindner et al., 2011; Manzo & Finzi, 2010; Norregaard et al., 2013; Pouget et al., 2004; Sandip Kumar, 2014; Schafer, Gelles, Sheetz, & Landick, 1991; Sitters et al., 2015; Vanzi, Broggio, Sacconi, & Pavone, 2006; Yin, Landick, & Gelles, 1994). Recently, Garini et al. proposed to use confocal microscopy to observe the excursion of the labeled bead in three-dimensions (Nir, Lindner, & Garini, 2012). Hidden Markov models using variational Bayesian methods have also been implemented to improve resolution and objectively assign conformational states (Johnson, van de Meent, Phillips, Wiggins, & Linden, 2014). Other investigators have concentrated on the enhancements to increase the throughput of the technique. For example, Plénat et al. reported a method which allowed the observation of precisely arranged arrays of hundreds of tethered beads simultaneously (Plénat, Tardin, Rousseau, & Salomé, 2012). With this improvement, they reported the activity of the T7 bacteriophage exonuclease enzyme which due to its low processivity had previously been examined only using bulk assays.
However, the strategy they developed to achieve high throughput is based on equipment, including software and nanofabricated chambers, that may not be readily available to most laboratories. This chapter reports a more modest but still enabling level of multiplexed, simultaneous bead tracking, which can be achieved in a simple and cost-effective manner. To demonstrate the utility and the limits of this high throughput method, experiments to monitor transcriptional elongation by RNA polymerase I or the wrapping of DNA by E. coli gyrase are described.
In transcription experiments, stalled complexes of RNA polymerase and DNA were immobilized on the microchamber surface. When all four ribonucleotides were added, transcriptional activity resumed and lengthened the DNA tether, which increased the amplitude of the Brownian motion of the tethered bead. In supercoiling experiments, the DNA wrapping activity of E. coli gyrase around its C-terminal domain (CTD), which occurs prior to cleavage and strand passage of the T-segment, was monitored through changes in the excursion of a DNA-tethered bead. Wrapping and unwrapping DNA generated a telegraphic-like time traces of DNA length changes. The following updates previous reports on the TPM technique (Dunlap, Zurla, Manzo, & Finzi, 2011) to include more recent developments like multiplexing.
2. Materials and Methods
In this section, we describe the details of the sample preparation including the design of the DNA construct, the construction of a functionalized microchamber, and the immobilization of the DNA molecules for observation in a differential interference contrast microscope.
2.1. Designing and amplifying the DNA Constructs
The DNA fragments used were produced using the polymerase chain reaction (PCR). Primers labeled with biotin or digoxigenin allowed attachment of the DNA to the microchamber surface and/or a microbead (Finzi & Dunlap, 2013).
Choose the DNA region to be amplified. Depending on the bead size, the tether length should be 0.5–3 kb to produce molecule-dominated motion (Segall, Nelson, & Phillips, 2006).
Select forward and reverse primers with similar melting temperatures. For gyrase wrapping experiments, use labeled primers to incorporate a biotin at one end and a digoxigenin at the other end. For RNA polymerase experiments, use a digoxigenin-labeled primer for attachment to the bead. The RNA polymerase mediates attachment to the coverglass.
Use plasmid pNOY745 (D. A. Schneider, 2012) with forward and reverse primers: 5′-ttaattccgcacagatgcgtaaggagaa-3′ and digoxigenin-labeled 5′-ccaaagactttgatttctcgta-3′ (Integrated DNA Technologies, Coralville, IA, USA), respectively. The DNA tethers for gyrase experiments (336 bp) were produced using pDL611 plasmid as a template with biotin- and digoxigenin-labeled primers and used in calibration experiments as described (Kumar et al., 2014).
Amplify the template using Taq DNA polymerase (NEB) with thermocycling as described below. Note that for experiments in which mutations of the DNA may be important, such as those containing a mutated promoter region, a high fidelity DNA polymerase such as Phusion polymerase (New England BioLabs Inc., Ipswich, MA) should be used, since it has a proofreading mechanism to increase the fidelity of replication during amplification.
-
Mix the following materials in a thermocycler tube:
32.5 μL H2O
10 μL 5X Phusion HF buffer
2.5 μL 10 μM forward primer
2.5 μL 10 μM reverse primer
1 μL (50 pg) template DNA
1 μL 10 μM dNTP
0.5 μL 10X Phusion DNA Polymerase
-
Keep the tube on ice until placed in the thermocycler with the following program:
95 °C for 3 min, initialization denaturation and activation of hot-start polymerases
94 °C for 1 min, successive denaturation
50 °C for 1 min, annealing
72 °C for 2 min, elongation
repeat steps 2 to 4 thirty-five times
72 °C for 2 min, final elongation
55 °C for 1 min, annealing
37 °C for 1 min, annealing
4 °C forever, hold
Purify the products with a PCR purification kit, (Qiagen, Germantown, MD) and analyze it by electrophoresis through a 1% agarose gel in TAE buffer in comparison with a DNA ladder (1 kb DNA Ladder, NEB) as shown in Figure 1.
Figure 1.
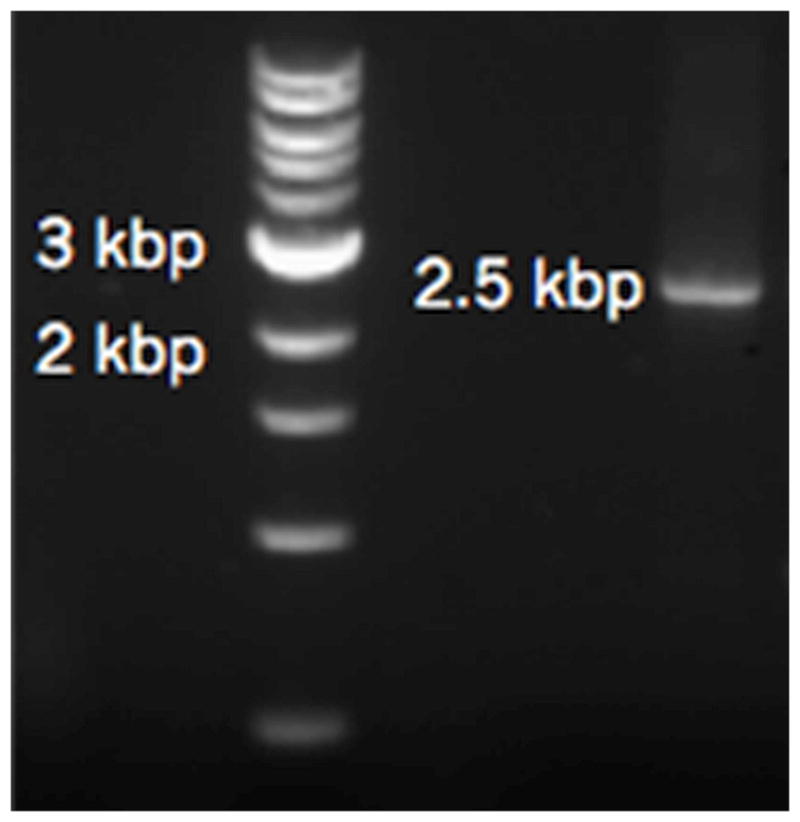
Representative image of the purified PCR products for the RNA Pol I TPM experiments. The DNA ladder appears in the leftmost lane.
2.2. Assembly of microchambers
Microchambers were freshly prepared before each experiment. The materials required are: 50 × 24 and 22 × 22 mm glass coverslips (Fisherbrand, catalog numbers 12545F and 12548B), double sided tape, vacuum grease, ethanol, and deionized water. The assembled microchambers will have a rectangular channel with a volume of approximately 25 μL.
Clean 50 × 24 and 22 × 22 mm coverslips by gentle agitation for thirty minutes in a solution of laboratory detergent, and rinse them under a gentle stream of tap water for five minutes followed by a few rinses in de-ionized water.
Finally rinse the coverslips with ethanol and store them submerged in ethanol in a closed container. To begin to assemble a microchamber, extract coverslips from the ethanol solution using clean forceps and gently wipe them with clean laboratory tissue. To prevent the deposition of dust, keep the coverslips covered with a petri dish during microchamber assembly.
Cut pieces of 12 mm-wide double sided tape 20 mm in length, and cut them in half lengthwise. Place the two strips parallel to the long sides of the 50 mm coverslip using forceps. The separation between the two strips should not be smaller than 0.5 cm.
Deposit a thin line of high vacuum grease just inside and along the length of the double-sided tape. Carefully align the 22 × 22 mm coverslip to span the grease and tape. Press gently over the tape to ensure adhesion as shown in Figure 2. Take care to align the two coverslips so that the assembled chamber will fit securely in the microscope stage.
Figure 2.
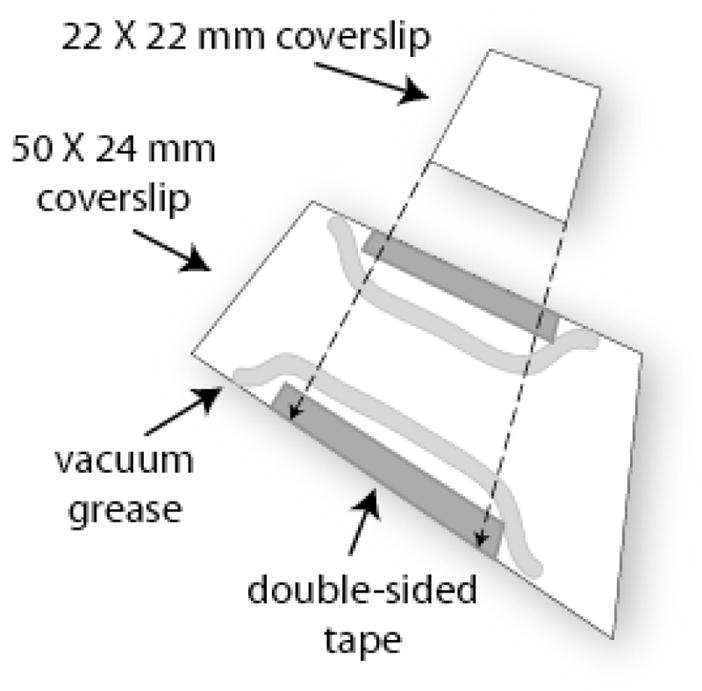
Assembly of a microchamber for TPM experiments. The channel was prepared using double sided tape and high vacuum grease as spacers between the two coverslips. The vacuum grease forms impermeable, inert barriers of the channel. The double-sided tape fixes the two coverslips together. The coverslips were washed with pure ethanol and dried with tissue prior to use.
2.3. Functionalization of microchamber surfaces
RNA Polymerase with a 3-HA tag at the C-terminal domain (D. A. Schneider, 2012) was immobilized on a microchamber surface coated with human influenza hemagglutinin (HA) antibody. To study the wrapping of DNA by gyrase, DNA was immobilized via a digoxigenin-antidigoxigenin linkage. This section describes coating surfaces with antibodies.
-
1)
Flush the microchamber channel with 400 μL of nano-pure water by introducing the fluid at one opening of the channel where it will be drawn in by capillary action. Once the liquid has filled the channel, touch a dry tissue to the other opening of the channel to wick away the excess fluid and in draw the rest of the solution at the inlet. An example of the microchamber filled with a colored solution for illustration is shown in Figure 3.
Figure 3.
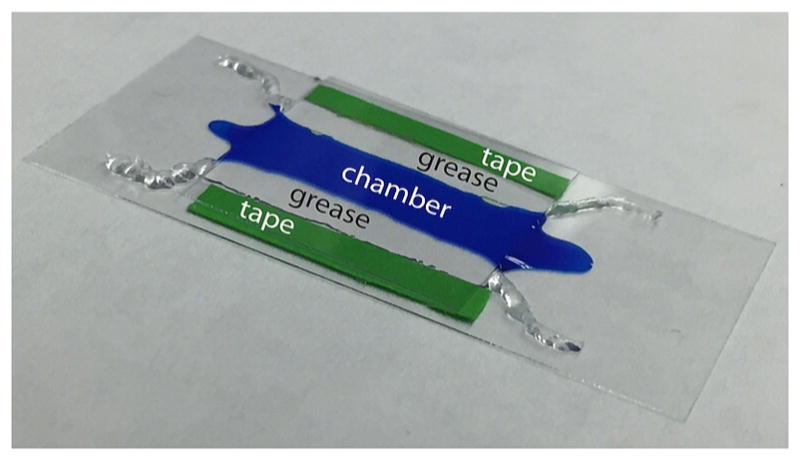
Schematic view of a microchamber. A cyan dye was used to visualize the channel formed by transparent grease boundaries between strips of tape (green) holding the coverslips together.
For RNA Pol I elongation experiments
-
2)
Gently rinse the microchamber with 50 μL of transcription buffer (20 mM Tris-acetate, pH 7.9, 2 mM DTT, 100 mM potassium glutamate, 8 mM magnesium acetate).
-
3)
To coat the surface introduce 50 μL of a 1:500 dilution of the anti-HA antibody (Monoclonal, Host: Mouse, Clone#: 12CA5, Abcam, Cambridge, MA) in transcription buffer, and incubate at least 2 hours at room temperature or overnight at 4°C.
-
4)
To passivate the surface gently rinse the chamber with 400 μL of transcription buffer supplemented with 0.5 mg/ml α-casein (Sigma Aldrich, catalog number C6780), and incubate the microchamber at least 30 minutes at room temperature before use.
For Gyrase wrapping experiments
-
2)
Introduce a solution of biotinylated-BSA (40 μg/mL) in phosphate-buffered saline into the microchamber and incubate it overnight at 4°C.
-
3)
Gently rinse the microchamber with 400 μL of lambda buffer (λB; 10 mM Tris-HCl (pH 7.4), 200 mM KCl, 5% dimethyl sulfoxide, 0.1 mM ethylenediaminetetraacetic acid, 0.2 mM dithiothreitol.
-
4)
Gently introduce 50 μL of 50-μg/mL streptavidin in lambda buffer and incubate for one hour at room temperature.
2.4. Assembly of tethered beads
For RNA Pol I elongation experiments
Reconstitution of the transcription complex from purified components requires: RNA Polymerase I, Rrn3p, TATA binding protein (TBP) and core factor (CF). These components were purified using published methods (David A. Schneider et al., 2007). Preparation of the single-molecule assays includes the following steps:
Mix 0.5 pmol of DNA template, 0.3 pmol of CF, 0.3 pmol of TBP in 43.1 μL of transcription buffer complemented with 0.5 mg/mL α-casein, and incubate three minutes at room temperature to allow binding of the proteins to the template DNA.
Add 25 μL (about 0.25 pmol) of pre-formed complex of Pol I and Rrn3p (D. A. Schneider, 2012) to the solution of DNA and core factor and incubate for ten minutes at room temperature to facilitate the formation of the pre-initiation complex.
Add 2 μL of transcription buffer containing 10 mM ATP, GTP, and UTP to the pre-initiation complex and incubate for three minutes at room temperature to form stalled elongation complexes.
Gently introduce approximately 20 μL of the stalled complexes into the chamber, and incubate for 15 minutes to facilitate the binding of the 3-HA epitope (Tyers, Tokiwa, & Futcher, 1993) on the A135 residue of the C-terminus of Pol I to the anti-HA-coated surface of the microchamber.
Meanwhile, dilute 1 μL of 480-nm (radius), anti-digoxigenin coated beads (Indicia Diagnostics, Oullins, France) with 49 μL of transcription buffer and vortex for 15 minutes to disperse aggregates.
Gently rinse the chamber with 400 μL transcription buffer to remove unbound complexes and wait five minutes.
Gently introduce 25 μL of the solution of beads to the chamber and incubate for 15 minutes to facilitate the binding of the digoxigenin-labeled DNA to the anti-digoxigenin-coated beads.
Gently rinse the chamber with 400 μL transcription buffer and place on the microscope for viewing.
Place the microchamber on the stage of a differential interference contrast (DIC) microscope and select a field of view with many symmetrically moving beads.
Record digital video for 5 minutes to acquire control data.
Pol I-DNA-bead complexes formed inside the microchamber are as shown in Figure 4. After introducing all four NTPs, elongation produces an increase in DNA tether length.
Figure 4.
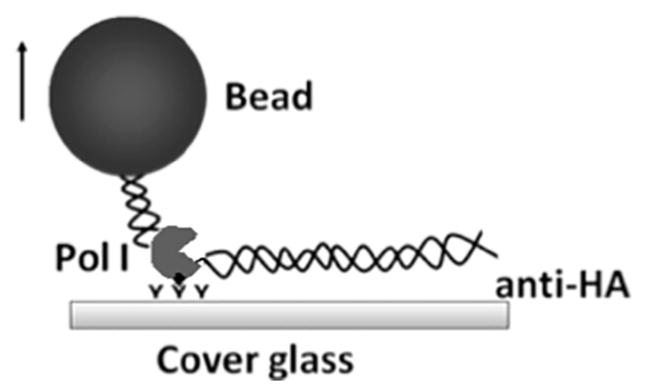
Diagram of the enzyme-DNA-bead assembly. The stalled Pol I-DNA complex is immobilized on the anti-HA-coated surface. The digoxigenin at one end of the DNA is bound to an anti-digoxigenin coated bead which is visible in a DIC microscope.
For Gyrase wrapping experiments
Dilute 2.5 μL of 480-nm diameter, anti-digoxigenin-coated beads with 47.5 μL λB and vortex for 15 minutes.
Add 25 μL of a 1 ng/mL solution of 336-bp DNA in λB to the bead solution and incubate for 1 hour.
Gently rinse the chamber with 400 μL λB.
Gently introduce 25 μL of the bead-DNA solution into the chamber and incubate for 2 hours at room temperature.
Gently rinse the chamber with 400 μL λB.
Place the microchamber on the stage of a DIC microscope and select a field of view with many symmetrically moving beads.
Record digital video for 5 minutes to acquire control data.
2.5. Optical Setup
Magnification and contrast optics
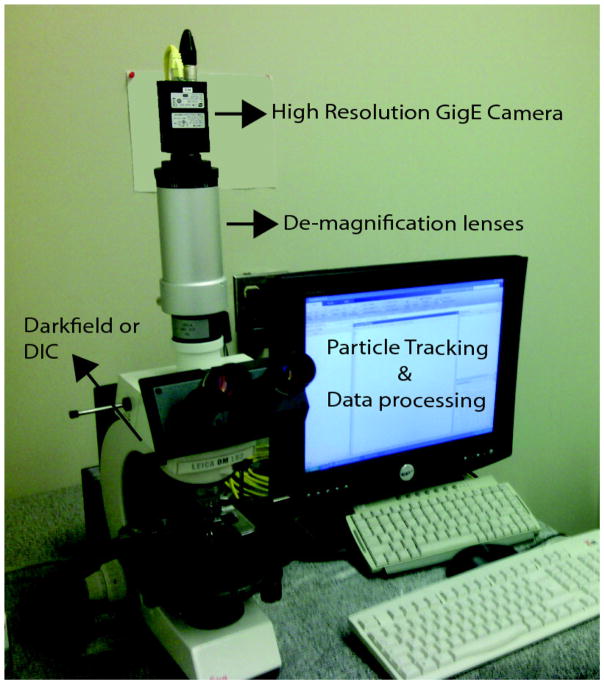
High-throughput TPM can be set up using either differential interference or dark-field to produce sufficient contrast to track the motion of the polystyrene microspheres. For DIC, a Leica DM LB2 upright microscope (Leica Microsystems, Wetzlar, Germany) with a Leica 506287 oil immersion objective (63X, NA 1.4 and a Leica Optivar lens (541 517 HC, 0.33X–1.6X) set at 0.63X demagnification level gives a reasonably large field of observation. The components of this system are diagramed in Figure 5.
Figure 5.
A DIC/dark field microscope equipped with 63X microscope objective was coupled to a 0.63X de-magnification lens (Optivar) to give an effective 40X magnification with an enlarged field of view. A high-resolution, GigE camera was used to stream video to the hard disk of a quad core CPU computer that was used for MatLab-based analysis of the motion of the Pol I-DNA-tethered beads.
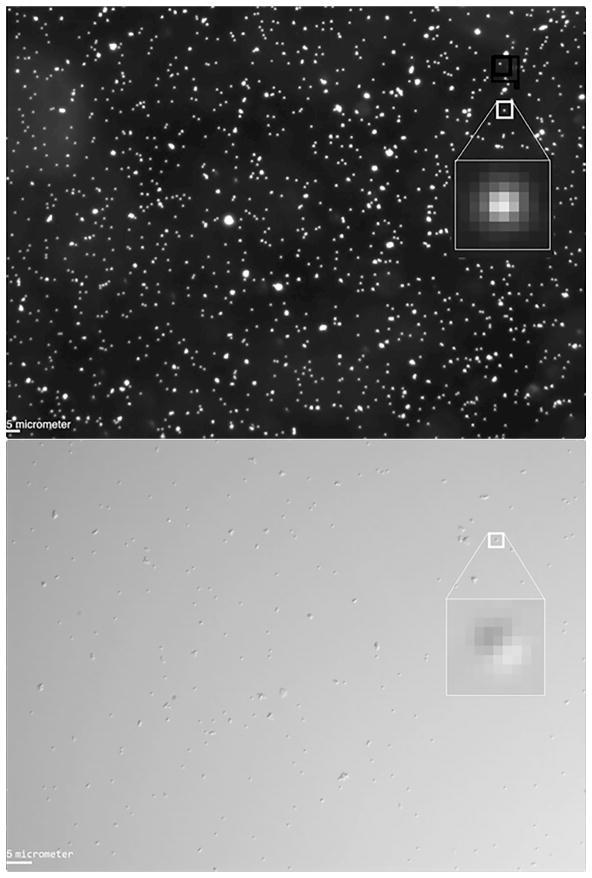
A total magnification of 40X is sufficient to produce images of beads that are 6–8 pixels across (Figure 6). For dark-field microscopy an objective with 20X magnification was used, and up to 100 randomly distributed tethered particles (many particles in the dark field image are immobile) could be observed per field of view.
Figure 6.
Images of representative fields of view in dark field microscopy (upper) and DIC microscopy (lower). The image of a given bead in each image was magnified (inset) to show its pixel composition. The scale bar represents 5 micrometers (lower left corner). Due to the lower magnification (20X vs. 40X), the total number of beads was higher in dark field than in DIC images.
Image acquisition hardware
A CM-140GE video camera (JAI, Copenhagen, Denmark) with gigabit Ethernet (GigE) connection was used to stream 1390 × 1040 pixel video to the computer at 30 frames per second. The frame rate with 1-ms exposure value was sufficient to observe the beads without blurring due to the fast bead motion (Han et al., 2009; Wong & Halvorsen, 2006). In our tests, video was streamed at 125 MB/s through a Cat 6e network cable between the camera and an Intel Pro 1000 series network adaptor interfaced to a NI-IMAQ driver to manage the data bus. This minimized the load on the CPU for data transfer from the camera. The computer had a 3 GHz AMD quad core CPU, 4 GB of DDR3 RAM memory, a 500 GB hard disk for operating system and software, and a 2 TB, 7200 rpm Western Digital Black series hard disk for video recording.
Image acquisition software
Labview with NI Vision Acquisition Software (National Instruments, Austin, TX) with an NI-IMAQdx High Performance driver was programmed to capture, display and save the stream as uncompressed AVI video file. The raw data format was an uncompressed movie file. A typical file size is nearly 40 GB for around 15 minutes of recording.
2.6. Data Analysis
A sequence of Cartesian coordinates was established for each bead in a video. To begin, the locations of the tethered beads were determined by eye during playback of the video file with the open source video player (VLC, VideoLAN, Paris France). Then the VideoReader class in MatLab (Version R2013, MathWorks, Natick, MA) was used to access an initial frame in the video file, and using the imcrop function of the image acquisition toolbox, a region of interest in which to locate the position of each bead through the remaining video sequence was manually registered in a custom Matlab routine. There are several methods for locating particles in images, each with some advantages and some drawbacks (Chenouard et al., 2014). A recent algorithm based on radial symmetry is robust and quick and was implemented to track the tethered beads (Parthasarathy, 2012).
Drift Correction and Bead Selection
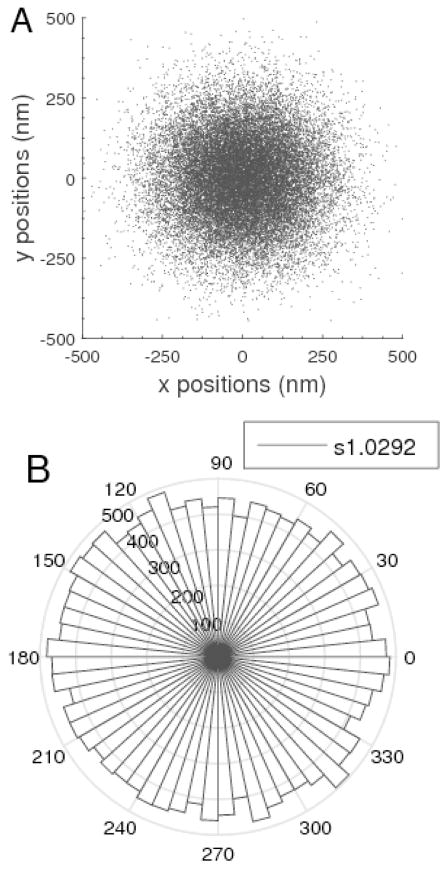
The time series of xy coordinates were analyzed using methods similar to those described previously (Kumar, et al., 2014) to select beads and determine the magnitude of the confined Brownian motion exhibited. First, the mechanical drift was eliminated by subtracting the apparent motion of stuck beads. Then, a radial distribution of the positions was plotted to verify symmetrical excursion in the XY plane as shown in Figure 7A. A bead tethered by more than one DNA molecule, most often diffuses through a range of xy positions scattered in an ellipsoidal rather than a circular pattern. Therefore, the shape of the excursion pattern of a tethered bead, such as that shown in Figure 7B, served to identify beads tethered by single DNA molecules. Then, the covariance matrices of the coordinates of the selected beads were calculated, and only beads with a diagonal ratio smaller than or equal to 1.07 were considered for further analysis.
Figure 7.
A) A circular excursion pattern exhibited by a bead tethered by a single DNA molecule. The drift-corrected positions of the tracked bead were plotted to verify the circular shape of the excursion. In the case of multiple tethering, the shape would be elliptical. B) A histogram of the angular distribution of bead positions. Higher values are represented by longer radial wedges. The circular shape in (A) does not definitively demonstrate a uniform distribution of excursions, which instead is evident in a plot of the angular distribution of excursions and can be quantitatively judged with the diagonal ratio of the covariance matrix, 1.0292 in this case.
Calculation of Excursion Values
The two-dimensional projection of the instantaneous positions of the bead with respect to the anchor point, excursions, were averaged over short time intervals as shown in Equation 1,
| Eq. 1 |
In which x and y are the coordinates of the bead in one video frame of the sequence. 〈x〉t and 〈y〉t are moving averages of x and y across the time interval, t, including that frame. This time interval can be determined experimentally and must be of sufficient length to follow the bead as it diffuses throughout the available hemisphere (Han, et al., 2009). It also depends on the diffusion medium, as shown previously (Kumar, et al., 2014). Four seconds is adequate in low viscosity buffers, and such moving averages reveal the coordinates of the attachment point of the tether to the glass.
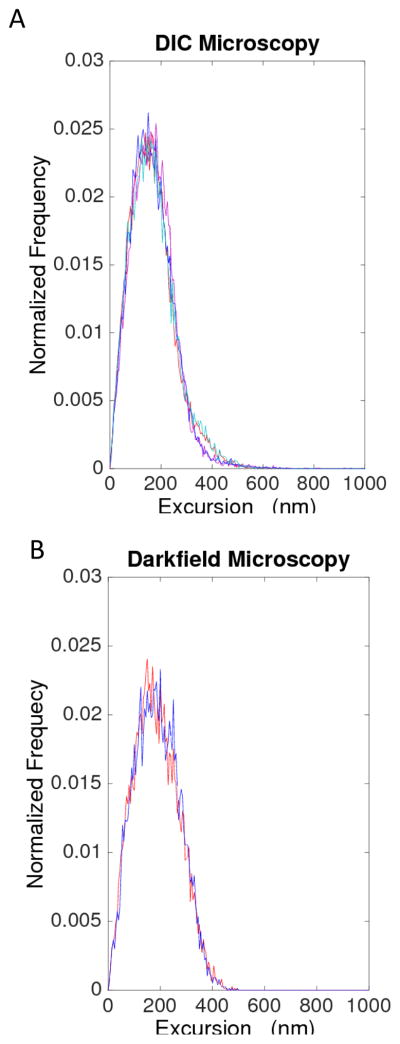
The average excursion values for DNA tethers attached to stalled complexes (556 bp) were statistically similar in DIC and dark field microscopy, as shown by their average values and standard deviations (155 ± 12 nm) and (160 ± 9 nm), respectively (Figure 8).
Figure 8.
Comparison of DIC (left) and dark field (right) microscopy measurements. The distribution of excursion values for a series of 556-bp DNA tethers was similar in both cases: 155 ± 12 nm (DIC) and 160 ± 9 nm (dark field). The distributions of excursion values for individual tethers are plotted in different colors (four tethers viewed using DIC microscopy, and two different tethers viewed using darkfield microscopy).
For RNA Pol I elongation experiments
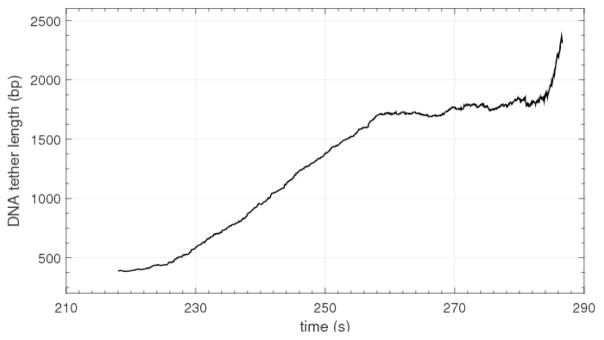
Any changes in tether length versus time due to DNA translocation by RNA polymerase should reveal elongation rates. To smooth the variation in this signal, the excursion during elongation was estimated using a moving average of 20 s as shown in Figure 9. Furthermore, in order to translate excursion values (nm squared) to tether lengths (bp), an experimental calibration curve was used (Kumar, et al., 2014). A calibration curve can be constructed using excursion or the square of excursion values measured for known contour lengths of DNA tethers. A curve based on the square of the excursion values has the advantage of being linear.
Figure 9.
A representative measurement of elongation by RNA polymerase I obtained with high throughput TPM. With the polymerase immobilized on the glass and the bead attached to the upstream end of the DNA, transcription by the polymerase increased the tether length fairly constantly for about 20 seconds before pausing briefly and then transcribing quite rapidly again near the end of the recording.
Although the example shown in Figure 9 concurs with expectation, there are noteworthy limits to the analyses of TPM data recorded for dynamically varying tether lengths. For example, pausing by RNA polymerases is a well subscribed feature of transcription (Artsimovitch & Landick, 2000; Forde, Izhaky, Woodcock, Wuite, & Bustamante, 2002; Neuman, et al., 2003). However, diffusion of the sub-micron sized, tethered bead requires 1–4 seconds to sample adequately the space of the available hemisphere and constitutes a large noise component that obscures small or transient underlying tether length changes.
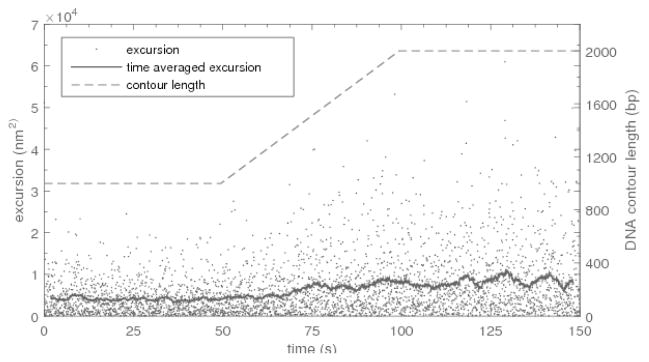
One approach to determining analytical limits is to establish the accuracy with which transcriptional starts and stops can be detected. Simulations of tethered particle motion are useful for this endeavor and fairly simple to implement. At each instant of diffusive motion, the tethered particle responds to randomly oriented translational force transmitted from the thermal bath and a restoring force toward the anchor point due to elasticity of the worm-like chain. Using the Stokes-Einstein relation, D = kbT/(6πηR), and an expression for the tension in a worm-like chain (Bustamante, Marko, Siggia, & Smith, 1994), these forces and associated displacements are easily calculated and sequences of positions visited by a bead undergoing tethered particle motion can be created for tethers of arbitrary lengths including those that increase over time. Such simulations were coded in MatLab and comparisons of the variance of x and y positions from these simulations with actual experimental data were used for validation. After that, simulations were used to evaluate the accuracy with which the beginning and the end of an interval of linearly increasing tether length might be detected.
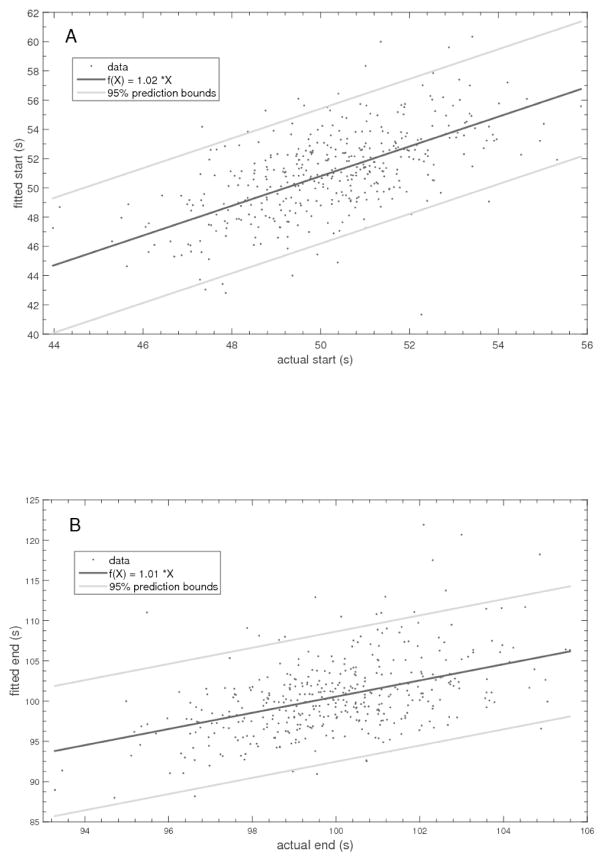
Figure 10 shows a representative “transcriptional” event (ramp) and the corresponding TPM signal that might result. There is a large variance in the data that grows as the tether lengthens. Within a MatLab fitting routine, minimization of the residuals between the data and a doubly jointed function built from an initial plateau, a linear increase, and a final plateau was used to estimate the coordinates of the joints. Just these two points are sufficient to specify the best estimate for the underlying “transcriptional” event. Figure 11 shows the correspondence between start and end times that were normally distributed around 50 and 100 seconds respectively with standard deviations of 4 s. Clearly there is a correlation, and two conclusions can be drawn. First is that the beginning and end points of a transcriptional interval cannot be pinpointed with great accuracy. The 95% confidence interval for estimates of the start of “transcription” is 10 s while that of the end spread across 18 s. This indicates that tether length changes corresponding to 100–200 bp, equal to one half of these intervals multiplied by a typical in vitro speed of 20 bp/s, might go undetected depending on the tether length. Secondly, the accuracy of these estimates degrades as the tether length increases.
Figure 10.
An example of tethered particle motion data simulated at 25 Hz for a 160-nm radius bead attached to a DNA tether with a persistence length of 51 nm. Gray points are the square of the instantaneous magnitude of two-dimensional excursions of the bead from the anchor point, ρ. The solid line is a 100 point (4 s) moving average of these excursions. The length of the tether versus time is represented by the dashed line. For the first 50 seconds, the tether length remains constant at 1000 base pairs. After fifty seconds the tether begins to lengthen at 20 bp/s and stops lengthening at 100 seconds when it is 2000 base pairs long.
Figure 11.
Plots of the correspondence between 400 input and fitted values for the beginning (left) and end (right) of intervals of linearly increasing tether lengths as shown in Figure 10.
It is important to consider these limitations when interpreting TPM data. Given the high intrinsic variance, information about the tether length requires averaging the excursion, ρ, over a relatively long time interval, which undermines precise pinpointing when those fluctuations change in magnitude. This essential time-averaging is why it is challenging to identify accurately the beginning and end of the period of linear growth of the tether length shown in Fig. 10. In a nutshell, for enzymes that produce progressive changes in the tether length, relatively larger changes over relatively longer time periods compared to the necessary averaging time can be reliably measured, while relatively small changes occurring relatively quickly may be difficult to detect with certainty.
For Gyrase wrapping experiments
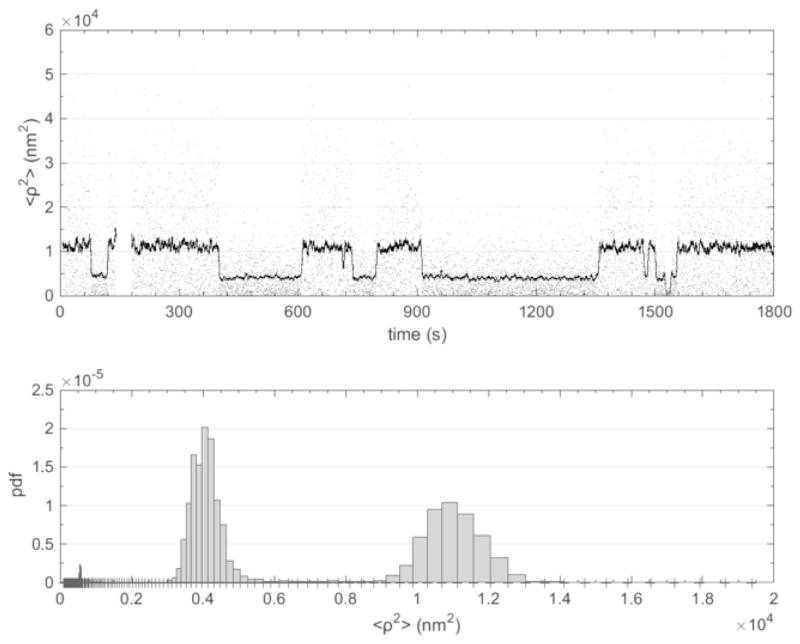
The time resolution may be much better for dynamic experiments with enzymes that produce larger, abrupt tether length changes, especially in relatively short tethers. The DNA construct designed to study the wrapping of DNA around gyrase was 336 bp, and wrapping was expected to reduce the tether length by 40 to 100 bp of DNA. Although gyrase-catalyzed strand passage, which produces coiling or uncoiling, does require ATP, wrapping by gyrase does not, and therefore shortening of the tether due to wrapping was observed after addition of the enzyme alone to the microchamber. Since wrapping is reversible, the DNA tether length exhibited telegraphic-like signals (Figure 12).
Figure 12.
A representative observation of gyrase-induced DNA wrapping and unwrapping (top) and the probability distribution of the observed excursion values (bottom). The instantaneous excursion values (gray) were also averaged using a moving window of four seconds and plotted (black). The original data was decimated to facilitate graphic reproduction. The two peaks in the distribution shown in the lower panel correspond to the two states of the DNA tether, wrapped with a shortened tether length and unwrapped so that the tether fully extends.
Summary
The methods presented above can be used to assemble large, randomly distributed arrays of microspheres tethered by single molecules for simultaneous observation, multiplexing. While more sophisticated means to assemble and observe catalytic enzyme activity on single DNA molecules have been reported in the literature and may achieve higher densities, the methods presented above may suffice and do not require microfabrication technology. Certainly, care must be taken to avoid over-interpreting the results, since diffusion is an inherently noisy process and beads with 200–500 nm radius may diffuse rather slowly compared to the reaction of interest. Nonetheless, multiplexing is critical for achieving enough throughput to investigate the activity of proteins that are difficult to repair or reconstitute or that exhibit low activity in vitro.
Acknowledgments
We thank Qing Shao for the illustration of the microchamber and Dan Kovari for useful discussion. This work was supported by grants the National Institutes of Health GM084070 to L.F. and D.D.D. and GM084946 to D.A.S.
References
- Artsimovitch I, Landick R. Pausing by bacterial RNA polymerase is mediated by mechanistically distinct classes of signals. [Research Support, U.S. Gov’t, P.H.S.] Proc Natl Acad Sci U S A. 2000;97(13):7090–7095. doi: 10.1073/pnas.97.13.7090. [DOI] [PMC free article] [PubMed] [Google Scholar]
- Bustamante C, Marko JF, Siggia ED, Smith S. Entropic Elasticity of Lambda-Phage DNA. Science. 1994;265(5178):1599–1600. doi: 10.1126/science.8079175. [DOI] [PubMed] [Google Scholar]
- Chenouard N, Smal I, De Chaumont F, Maška M, Sbalzarini IF, Gong Y, et al. Objective comparison of particle tracking methods. Nature methods. 2014;11(3):281. doi: 10.1038/nmeth.2808. [DOI] [PMC free article] [PubMed] [Google Scholar]
- Dunlap D, Zurla C, Manzo C, Finzi L. Probing DNA topology using tethered particle motion. Methods Mol Biol. 2011;783:295–313. doi: 10.1007/978-1-61779-282-3_16. [DOI] [PMC free article] [PubMed] [Google Scholar]
- Fan HF. Real-time single-molecule tethered particle motion experiments reveal the kinetics and mechanisms of Cre-mediated site-specific recombination. Nucleic Acids Research. 2012;40(13):6208–6222. doi: 10.1093/nar/gks274. [DOI] [PMC free article] [PubMed] [Google Scholar]
- Finzi L, Dunlap D. Tethered Particle Microscopy. In: Roberts GK, editor. Encyclopedia of Biophysics. Springer; Berlin Heidelberg: 2013. pp. 2579–2582. [Google Scholar]
- Finzi L, Gelles J. Measurement of lactose repressor-mediated loop formation and breakdown in single DNA molecules. Science. 1995;267(5196):378–380. doi: 10.1126/science.7824935. [DOI] [PubMed] [Google Scholar]
- Forde NR, Izhaky D, Woodcock GR, Wuite GJ, Bustamante C. Using mechanical force to probe the mechanism of pausing and arrest during continuous elongation by Escherichia coli RNA polymerase. Proc Natl Acad Sci U S A. 2002;99(18):11682–11687. doi: 10.1073/pnas.142417799. [DOI] [PMC free article] [PubMed] [Google Scholar]
- Han L, Lui BH, Blumberg S, Beausang JF, Nelson PC, Phillips R. Calibration of Tethered Particle Motion Experiements. In: Benham CJ, Harvey S, Olson WK, Sumners DWL, Swigon D, editors. Mathematics of DNA Structure, Function and Interactions. Vol. 150. New York: Springer; 2009. pp. 123–138. [Google Scholar]
- Johnson S, van de Meent JW, Phillips R, Wiggins CH, Linden M. Multiple Lacl-mediated loops revealed by Bayesian statistics and tethered particle motion. Nucleic Acids Res. 2014;42(16):10265–10277. doi: 10.1093/nar/gku563. [DOI] [PMC free article] [PubMed] [Google Scholar]
- Kumar S, Manzo C, Zurla C, Ucuncuoglu S, Finzi L, Dunlap D. Enhanced Tethered-Particle Motion Analysis Reveals Viscous Effects. Biophysical Journal. 2014;106(2):399–409. doi: 10.1016/j.bpj.2013.11.4501. [DOI] [PMC free article] [PubMed] [Google Scholar]
- Laurens N, Rusling DA, Pernstich C, Brouwer I, Halford SE, Wuite GJL. DNA looping by Fokl: the impact of twisting and bending rigidity on protein-induced looping dynamics. Nucleic Acids Research. 2012;40(11):4988–4997. doi: 10.1093/nar/gks184. [DOI] [PMC free article] [PubMed] [Google Scholar]
- Lindner M, Nir G, Medalion S, Dietrich HR, Rabin Y, Garini Y. Force-free measurements of the conformations of DNA molecules tethered to a wall. Physical Review E. 2011;83(1):011916. doi: 10.1103/PhysRevE.83.011916. [DOI] [PubMed] [Google Scholar]
- Manzo C, Finzi L. Chapter Nine-Quantitative Analysis of DNA-Looping Kinetics from Tethered Particle Motion Experiments. Methods in enzymology. 2010;475:199–220. doi: 10.1016/S0076-6879(10)75009-6. [DOI] [PMC free article] [PubMed] [Google Scholar]
- Nelson PC, Zurla C, Brogioli D, Beausang JF, Finzi L, Dunlap D. Tethered Particle Motion as a Diagnostic of DNA Tether Length. The Journal of Physical Chemistry B. 2006;110(34):17260–17267. doi: 10.1021/jp0630673. [DOI] [PubMed] [Google Scholar]
- Neuman KC, Abbondanzieri EA, Landick R, Gelles J, Block SM. Ubiquitous transcriptional pausing is independent of RNA polymerase backtracking. Cell. 2003;115(4):437–447. doi: 10.1016/s0092-8674(03)00845-6. [DOI] [PubMed] [Google Scholar]
- Nir G, Lindner M, Garini Y. Protein-DNA Interactions Studies with Single Tethered Molecule Techniques. In: Cai DJ, editor. Protein Interactions. InTech; 2012. [Google Scholar]
- Norregaard K, Andersson M, Sneppen K, Nielsen PE, Brown S, Oddershede LB. DNA supercoiling enhances cooperativity and efficiency of an epigenetic switch. Proceedings of the National Academy of Sciences. 2013 doi: 10.1073/pnas.1215907110. [DOI] [PMC free article] [PubMed] [Google Scholar]
- Parthasarathy R. Rapid, accurate particle tracking by calculation of radial symmetry centers. Nature Methods. 2012;9(7):724–726. doi: 10.1038/nmeth.2071. [DOI] [PubMed] [Google Scholar]
- Plénat T, Tardin C, Rousseau P, Salomé L. High-throughput single-molecule analysis of DNA–protein interactions by tethered particle motion. Nucleic acids research. 2012:gks250. doi: 10.1093/nar/gks250. [DOI] [PMC free article] [PubMed] [Google Scholar]
- Pouget N, Dennis C, Turlan C, Grigoriev M, Chandler M, Salome L. Single-particle tracking for DNA tether length monitoring. Nucleic Acids Res. 2004;32(9):e73. doi: 10.1093/nar/gnh073. [DOI] [PMC free article] [PubMed] [Google Scholar]
- Sandip Kumar CM, Chiara Zurla Suleyman Ucuncuoglu, Laura Finzi, David Dunlap. Enhanced Tethered-Particle Motion Analysis Reveals Viscous Effects. Biophysical Journal. 2014;106(January 2014):1–11. doi: 10.1016/j.bpj.2013.11.4501. [DOI] [PMC free article] [PubMed] [Google Scholar]
- Schafer DA, Gelles J, Sheetz MP, Landick R. Transcription by single molecules of RNA polymerase observed by light microscopy. Nature. 1991;352(6334):444–448. doi: 10.1038/352444a0. [DOI] [PubMed] [Google Scholar]
- Schneider DA. Quantitative analysis of transcription elongation by RNA polymerase I in vitro. [Research Support, N.I.H., Extramural] Methods Mot Biol. 2012;809:579–591. doi: 10.1007/978-1-61779-376-9_37. [DOI] [PMC free article] [PubMed] [Google Scholar]
- Schneider DA, Michel A, Sikes ML, Vu L, Dodd JA, Salgia S, et al. Transcription Elongation by RNA Polymerase I Is Linked to Efficient rRNA Processing and Ribosome Assembly. Molecular Cell. 2007;26(2):217–229. doi: 10.1016/j.molcel.2007.04.007. [DOI] [PMC free article] [PubMed] [Google Scholar]
- Segall DE, Nelson PC, Phillips R. Volume-exclusion effects in tethered-particle experiments: bead size matters. Physical review letters. 2006;96(8):088306. doi: 10.1103/PhysRevLett.96.088306. [DOI] [PMC free article] [PubMed] [Google Scholar]
- Sitters G, Kamsma D, Thalhammer G, Ritsch-Marte M, Peterman EJG, Wuite GJL. Acoustic force spectroscopy. [Brief Communication] Nat Meth. 2015;12(1):47–50. doi: 10.1038/nmeth.3183. [DOI] [PubMed] [Google Scholar]
- Tyers M, Tokiwa G, Futcher B. Comparison of the Saccharomyces cerevisiae G1 cyclins: Cln3 may be an upstream activator of Cln1, Cln2 and other cyclins. Embo j. 1993;12(5):1955–1968. doi: 10.1002/j.1460-2075.1993.tb05845.x. [DOI] [PMC free article] [PubMed] [Google Scholar]
- Vanzi F, Broggio C, Sacconi L, Pavone FS. Lac repressor hinge flexibility and DNA looping: single molecule kinetics by tethered particle motion. Nucleic Acids Research. 2006;34(12):3409–3420. doi: 10.1093/nar/gkl393. [DOI] [PMC free article] [PubMed] [Google Scholar]
- Wong WP, Halvorsen K. The effect of integration time on fluctuation measurements: calibrating an optical trap in the presence of motion blur. Optics Express. 2006;14(25):12517–12531. doi: 10.1364/oe.14.012517. [DOI] [PubMed] [Google Scholar]
- Yin H, Landick R, Gelles J. Tethered particle motion method for studying transcript elongation by a single RNA polymerase molecule. Biophysical journal. 1994;67(6):2468–2478. doi: 10.1016/S0006-3495(94)80735-0. [DOI] [PMC free article] [PubMed] [Google Scholar]


