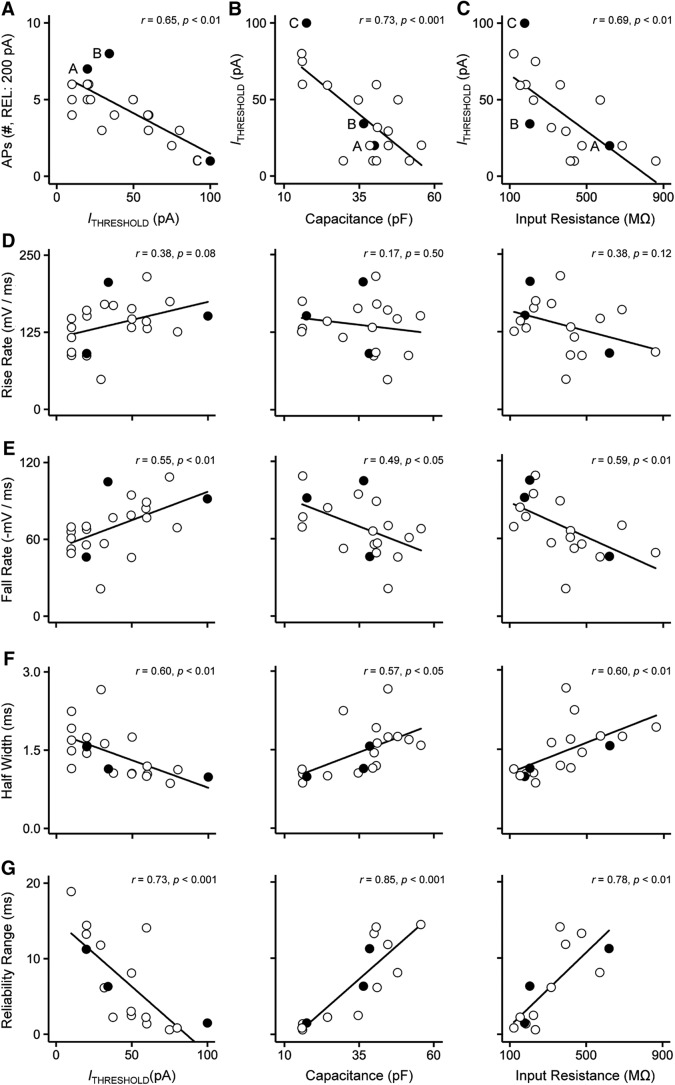
Figure 11.
Heterogeneity of AP properties of NMc1 and NMc2 neurons. A, Number of APs generated in response to 200-pA current injections plotted as a function of threshold current for individual NMc1/NMc2 neurons. Three filled and labeled circles represent the neurons shown in Fig. 10A, B, and C, respectively. Correlation coefficient r and p values are shown. B, C, Threshold current plotted as a function of membrane capacitance (B) and input resistance (C) for individual NMc1/NMc2 neurons. D–G, Population data of AP rise rate (D), fall rate (E), half width (F), and reliability range (G) are plotted for individual NMc1/NMc2 neurons, as a function of threshold current (left), membrane capacitance (middle), and input resistance (right). Correlation coefficient r and p values are shown. Three filled circles represent the neurons shown in Fig. 10A, B, and C, respectively. Note that in G, five outliers with extremely large range (>30 ms) were removed.

