Significance
High-throughput sequencing has transformed modern biology, but its repertoire is currently confined to reading DNA molecules. Here, we report hardware and software adaptations that allow the very methods that enabled the genomic sequencing revolution to be applied to fluorescence-based biochemical assays, on a massive scale. We demonstrate the unique value of this approach by finding previously unknown features of an ancient developmental regulator, Vts1 (Smaug in metazoans), despite its extensive study with previously available techniques. Our work couples transcriptome-wide measurements of binding affinity, sequence, and structural determinants of binding, and phenotypic outcomes to provide a comprehensive portrait of Vts1 function. Our technology is easily extensible to other RNA-binding proteins involved in disease and development, and facilitates diverse applications in systems biochemistry.
Keywords: RNA, next-generation sequencing, systems biochemistry, RNA binding proteins, Vts1
Abstract
RNA-binding proteins (RBPs) control the fate of nearly every transcript in a cell. However, no existing approach for studying these posttranscriptional gene regulators combines transcriptome-wide throughput and biophysical precision. Here, we describe an assay that accomplishes this. Using commonly available hardware, we built a customizable, open-source platform that leverages the inherent throughput of Illumina technology for direct biophysical measurements. We used the platform to quantitatively measure the binding affinity of the prototypical RBP Vts1 for every transcript in the Saccharomyces cerevisiae genome. The scale and precision of these measurements revealed many previously unknown features of this well-studied RBP. Our transcribed genome array (TGA) assayed both rare and abundant transcripts with equivalent proficiency, revealing hundreds of low-abundance targets missed by previous approaches. These targets regulated diverse biological processes including nutrient sensing and the DNA damage response, and implicated Vts1 in de novo gene “birth.” TGA provided single-nucleotide resolution for each binding site and delineated a highly specific sequence and structure motif for Vts1 binding. Changes in transcript levels in vts1Δ cells established the regulatory function of these binding sites. The impact of Vts1 on transcript abundance was largely independent of where it bound within an mRNA, challenging prevailing assumptions about how this RBP drives RNA degradation. TGA thus enables a quantitative description of the relationship between variant RNA structures, affinity, and in vivo phenotype on a transcriptome-wide scale. We anticipate that TGA will provide similarly comprehensive and quantitative insights into the function of virtually any RBP.
RNA-binding proteins (RBPs) constitute 5–10% of the eukaryotic proteome (1–3) and collectively govern the localization, translation, and decay of virtually every transcript (4–6). Despite the ubiquity of RBPs and their central importance in gene regulation, decoding the links between RNA primary sequence and its cadre of regulators remains a major unresolved challenge (7). Current approaches for characterizing RBP function generally involve trade-offs between throughput, comprehensiveness, and quantitative precision. Biophysical measurements can be made with targeted biochemical approaches such as electrophoretic mobility shift assays (EMSAs) or fluorescence polarization (FP) (8, 9), but these methods can only interrogate known RNA–protein interactions and are inherently low-throughput. Selection-based approaches [e.g., in vitro selection, high-throughput sequencing of RNA, and sequence-specificity landscapes (SEQRS)/RNA bind-n-seq (RBNS)] achieve higher throughput, but these techniques remove binding sites from their natural sequence context and identify “winners” based on more than simple affinity (10). Transcriptome-wide methods, which often use cross-linking and immunoprecipitation [e.g., photoactivatable ribonucleoside-enhanced cross-linking and immunoprecipitation (PAR-CLIP), high-throughput sequencing of RNA isolated by cross-linking and immunoprecipitation (HiTS-CLIP), RNA immunoprecipitation (RIP-chip/seq), individual-nucleotide resolution cross-linking and immunoprecipitation (iCLIP), RNA tagging, targets of RNA-binding proteins identified by editing (TRIBE)] (11–16), have yielded many insights. However, they do not generally provide quantitative information about relative affinity and often suffer from additional drawbacks. First, they generally require high-quality, specific antibodies and are thus not scalable to many proteins of interest. Second, binding targets must be appreciably expressed in an individual cell type and condition to be observed. Third, with notable exceptions (e.g., iCLIP), the sequence resolution of these techniques typically precludes nucleotide-level resolution of binding motifs. Finally, differences in cross-linking efficiency and transcript abundance, both of which can vary over many orders of magnitude, are significant sources of bias in transcriptome-wide approaches (17–19).
We overcame these biases with an approach that, for rare and abundant substrates alike, combines the genome-wide scale of cross-linking methods with the quantitative precision of targeted biochemical experiments. We applied our method to characterize the interactions of the conserved RNA binding domain of a sequence- and structure-specific RBP (Vts1 in Saccharomyces cerevisiae; Smaug in metazoans). We chose to study Vts1 because of its biological significance as a key regulator of RNA stability in development (20) and because decades of prior study provided a gold standard against which to benchmark our results (21–27).
Results
An Open-Source Platform for Systems Biochemistry.
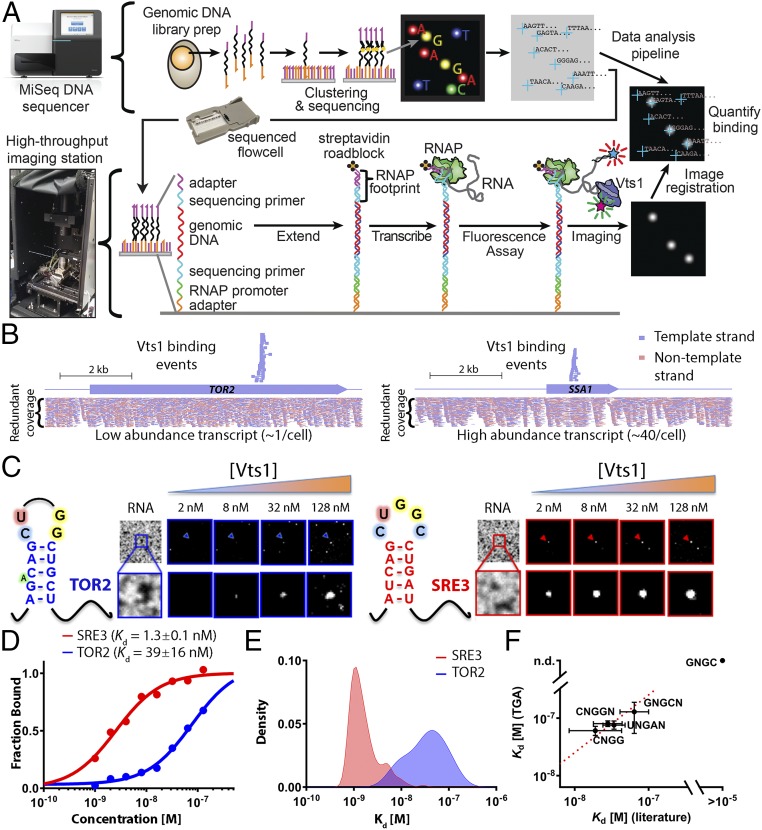
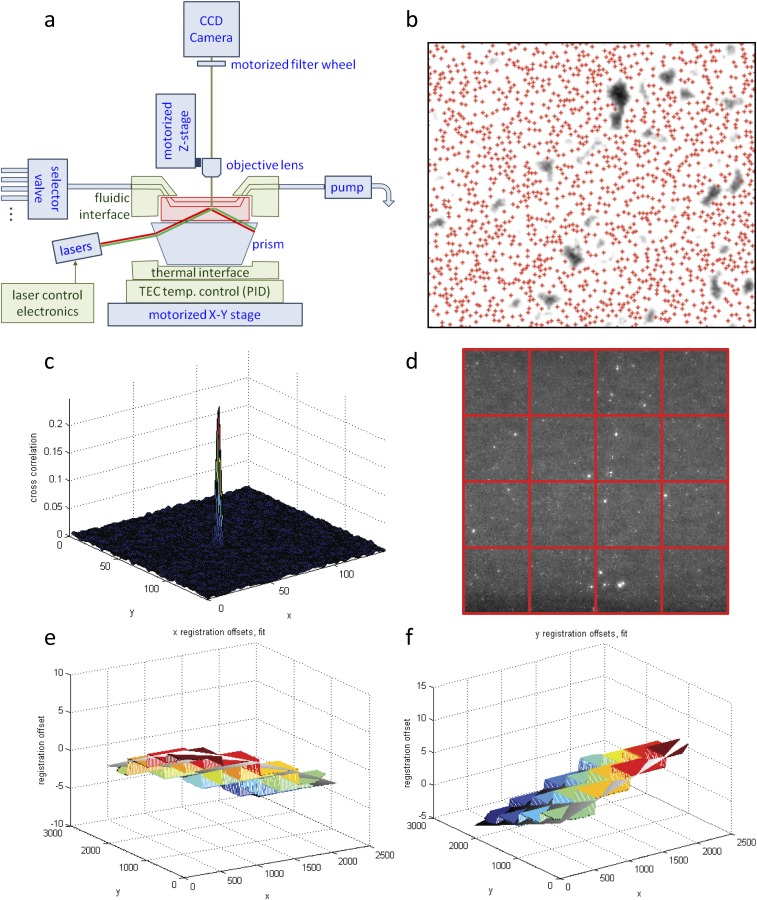
Our approach directly harnessed the throughput of Illumina sequencing, using the MiSeq sequencing flow cell itself as a platform for high-throughput biochemistry. Although the flow cell provides an ideal substrate for massively parallel experiments, current Illumina instruments are not amenable to customization (28, 29). Previous methods such as RNA on a massively parallel array (RNA-MaP) and high-throughput sequencing–RNA affinity profiling (HiTS-RAP) overcame this issue by operating on the now antiquated Genome Analyzer II. Here, we built our own hardware platform that enables custom biochemical experiments to be performed on modern sequencing chips. We developed a high-throughput imaging station, combining hardware components from an Illumina Genome Analyzer II with optimized optics, fluidics, and temperature control systems (Fig. 1A). We integrated these hardware components into a fully programmable interface (Fig. S1A), creating a modular design that provides a blueprint for future applications to interrogate other classes of biophysical interactions. To enable transfer of the technology to other laboratories, we integrated our imaging platform with sequencing flow cells produced by a benchtop sequencer (MiSeq), using cross-correlation methods to identify the physical location of each sequenced cluster with submicron accuracy (Fig. S1 B–F). This exquisite spatial resolution allowed us to link images generated on our imaging station to specific nucleotide sequences obtained on a commercial sequencer, decoupling the instrument used for sequencing from that used to carry out custom biochemistry applications. Our imaging station thus provides an open platform for systems biochemistry that we expect will encourage further methodological development.
Fig. 1.
A quantitative method for rapid, unbiased measurements of RBP affinity and kinetics across 107 substrates. (A) Workflow for TGA. On the MiSeq, a dense array of clonal clusters is produced as part of the standard sequencing by synthesis workflow (Top). Then, after moving the flow cell to a custom imaging station, clusters serve as a template for in situ generation of RNA (Bottom), enabling quantitative measurement and analysis of 107 binding experiments in less than 36 h. (B) Genome browser track showing unique overlapping and strand-specific Vts1 binding sequences covering each Vts1 binding site (Top) and all candidate RNA sequences generated by the TGA (Bottom) for a low- and high-abundance transcript. (C) Raw images of fluorescently labeled Vts1 bound to a weak affinity (TOR2, in blue) vs. a strong affinity (SRE3, in red) substrate. The first image in each series shows the RNA clusters, and subsequent images show Vts1 binding at increasing concentrations. (D) Quantification of single-cluster image series from C. All reported values are median apparent Kd estimates averaged across multiple independent binding curves (nSRE3 = 156; nTOR2 = 14; SI Materials and Methods for further discussion). (E) Distribution of affinity measurements across independent clusters for a strong (SRE3)- and weak-affinity (TOR2) target (kernel density estimate). (F) Comparison of bulk solution affinity measurements and TGA-derived measurements [linear fit, slope = 1, 95% confidence interval (CI)].
Fig. S1.
(A) Modular design blueprint colored by parts. The imaging station accepts a sequenced MiSeq flow cell (red) and is constructed from parts borrowed from the GAIIx (blue) and custom-engineered retrofit components, electronics, and software (green). (B) Cross-correlation is performed between a binary pseudoimage of sequencer coordinates [red plus signs (+)] and the custom image station image of RNA clusters (white). Even with a dense surface of clusters, low-density areas (black) can guide alignment. (C) Cross-correlation peak defines x and y coordinate offsets to subpixel resolution. (D) Original image is divided into subtiles, and each subtile is individually cross-correlated to sequencer coordinates. (E and F) The x and y offsets from each subtile are fit to a 2D quadratic surface.
We next densely populated a MiSeq flow cell with an S. cerevisiae genomic DNA library. During library construction, we incorporated an Escherichia coli RNA polymerase (RNAP) promoter and RNAP stall sequence. We then transcribed each DNA molecule into a tethered RNA transcript (Fig. 1A, Figs. S2 and S3A (29, 30), and Materials and Methods). This transcribed genome array (TGA) displays the entire potential RNA sequence space of S. cerevisiae in a highly redundant and unbiased manner; each nucleotide is represented at a mean coverage of >30× in overlapping transcripts of ∼100–300 nt (Fig. 1B and Fig. S3B). Moreover, the enzymatically transcribed fragments can adopt physiologically relevant folds that are dependent on local sequence context (see below).
Fig. S2.
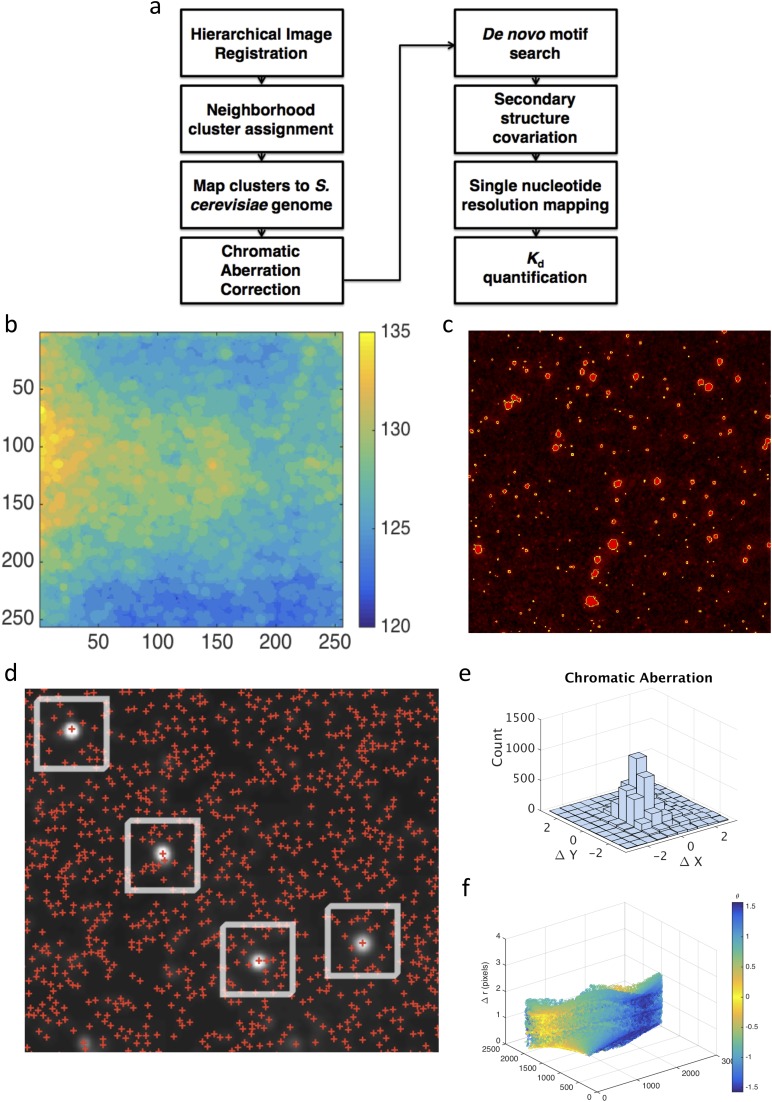
(A) High-level software flowchart for analyses performed. (B) Illumination correction via a standard MATLAB image-processing algorithm (morphological opening with disk radius of 25 pixels). (C) Image segmentation is performed via a manually adjusted threshold value and filtered for object size. (D) Neighborhood mapping method defines candidate sequencing clusters [red plus signs (+)] within a 10-pixel radius of a Vts1-binding event (white disks). Each cluster is then mapped to the S. cerevisiae genome. On-target binding substrates are identified based on reproducible, strand-specific peaks with >12 independent binding clusters. (E and F) Chromatic aberration between red (RNA) and green (protein) channel images is then plotted in Cartesian and polar coordinates.
Fig. S3.
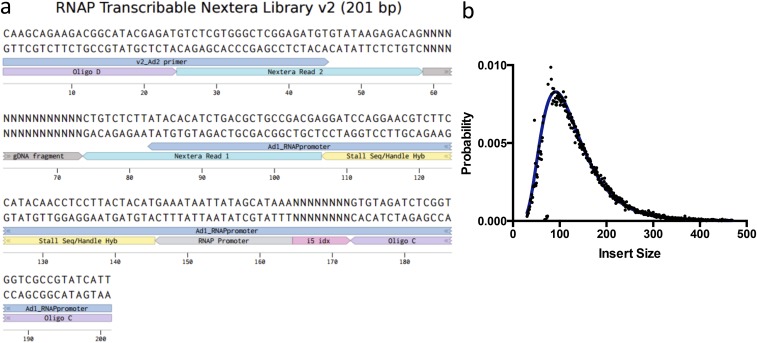
(A) Custom library design to allow for in vitro transcription of the S. cerevisiae genome (https://benchling.com/s/GDDULj). (B) Distribution of genomic DNA insert sizes (Picard tools).
A Multitude of Additional Binding Targets.
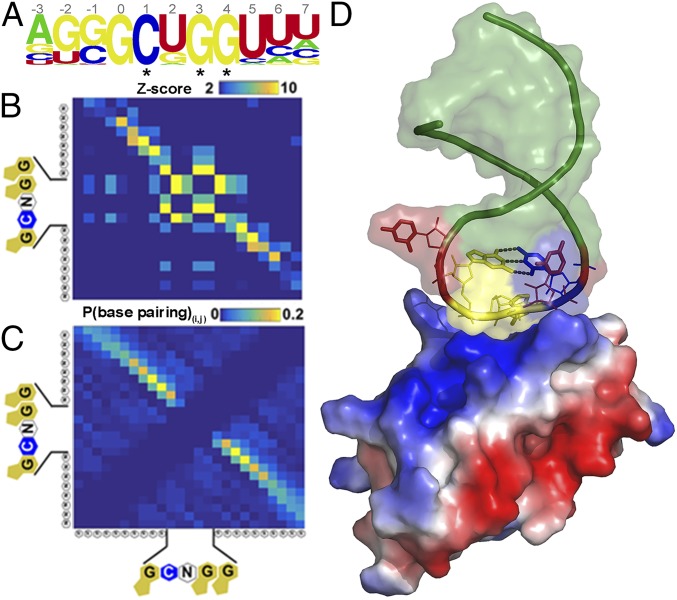
We used this platform and a workflow that spanned just 36 h to make >107 measurements of binding for Vts1 across a ∼100-fold concentration gradient (Fig. 1 C–E). Using these measurements, we identified 325 RNAs that reproducibly bound Vts1 at physiological protein concentrations (∼130 nM) (31) across the many redundant clusters on the TGA. These apparent affinities were comparable to known Vts1 target elements that we doped into our library (0.1%) as a positive control for RNA folding and protein binding. They also were concordant with published bulk solution measurements (21, 22, 27) (Fig. 1F; Materials and Methods for further discussion). Using the RNAcontext algorithm (32), we constructed a de novo binding motif from the 325 Vts1 targets. This analysis revealed two conserved features: (i) a robust 11-nt motif and (ii) a strong enrichment for stem loop structure (Fig. 2A and Fig. S4 A and B). Our data thus reiterate yet significantly expand the consensus CNGGN0–3 hairpin loop defined by decades of targeted biochemical studies in a wide range of organisms (20–22) (Fig. 2A).
Fig. 2.
Genome-wide, single-nucleotide resolution of Vts1 binding targets defines a consensus structural motif. (A, Top) De novo motif search based on 325 genomic target regions of ∼80 nt each. The nucleotide positions are marked on Top, and the asterisk (*) indicate nucleotides known from prior literature consensus. (B) Covariation matrix where each element (i, j) indicates an enrichment score for base-pairing interactions between residues i and j (Materials and Methods). The diagonal density in the matrix defines the residues in the hairpin stem. (C) Base-pairing probabilities for all 325 Vts1 targets via NUPACK folding algorithm. (D) NMR structure of Vts1 bound to consensus RNA sequence (PDB ID code 2ESE) supports sequence and structure predictions from TGA.
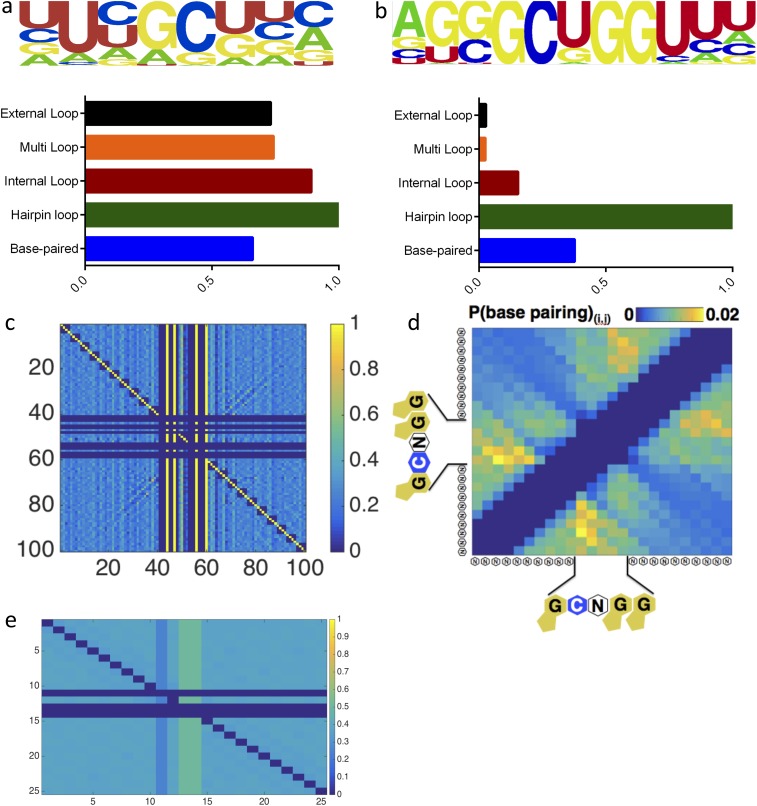
Fig. S4.
(A and B) RNAMotif output for random CNGGN containing sequences from S. cerevisiae genome (A) and for Vts1 targets as identified by TGA (B). (C) Full covariation matrix without base-pairing probability decomposition. Each 4 × 4 subtile shows the pairwise probability of the 16 possible nucleotide combinations at position (i, j). (D) Computational estimate of base-pairing probability for non-Vts1 targets that fit the GCNGGN consensus motif. (E) Control covariance matrix for all CNGGN in genome.
We next explored the specific structural features that drive Vts1’s interactions with its target sequences. If Vts1 indeed binds a stem loop structure, as has been hypothesized from studies of individual substrates (33), nucleotides within the stem should covary in a manner that preserves base pairing. We therefore constructed a normalized covariation matrix spanning the core 0GCNGG4 motif and adjacent bases (Fig. 2B and Fig. S4 C–E). This analysis confirmed our stem loop prediction and, without any prior assumptions about RNA structure, allowed identification of the Vts1 binding motif at single-nucleotide resolution for each of its targets in the transcriptome (Materials and Methods for further discussion). As a negative control, we transcribed and folded the entire yeast genome in silico (Fig. S5). The consensus stem loop structure was highly enriched in our binding targets compared with the rest of the transcriptome (Fig. 2C).
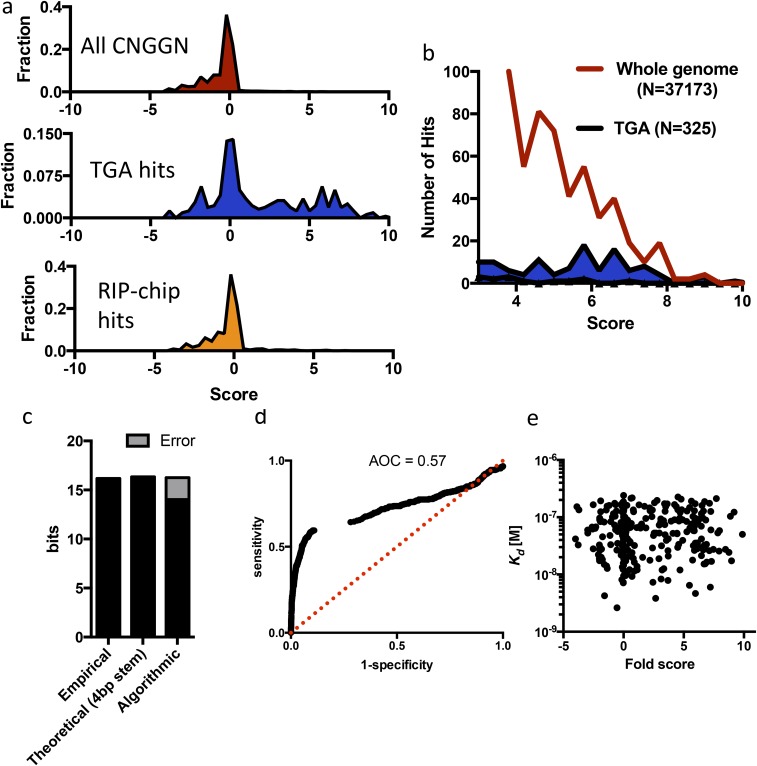
Fig. S5.
(A) NUPACK computational folding output for all CNGGN targets in the genome, targets defined by TGA, and targets defined by RIP-chip (higher score ∝ higher likelihood of CNGGN hairpin). (B) Absolute number of computationally predicted CNGGN hairpins across the entire genome compared with those experimentally identified by TGA. (C) Empirical specificity of Vts1 binding [log2(24 Mb of sequence space/325 targets)] compared with the theoretical informational content of a CNGGN stem loop with 4 bp and the information content captured by the NUPACK folding algorithm. (D) Sensitivity/specificity plot for NUPACK-defined targets compared with TGA-defined targets. (E) Computational fold score does not correlate to Kd measurements.
Structural Requirements for Vts1 Binding.
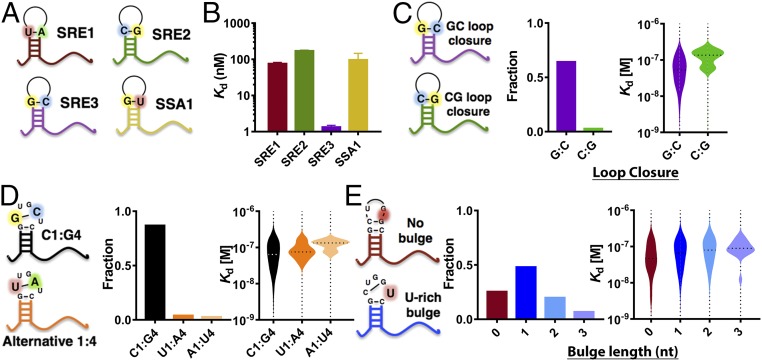
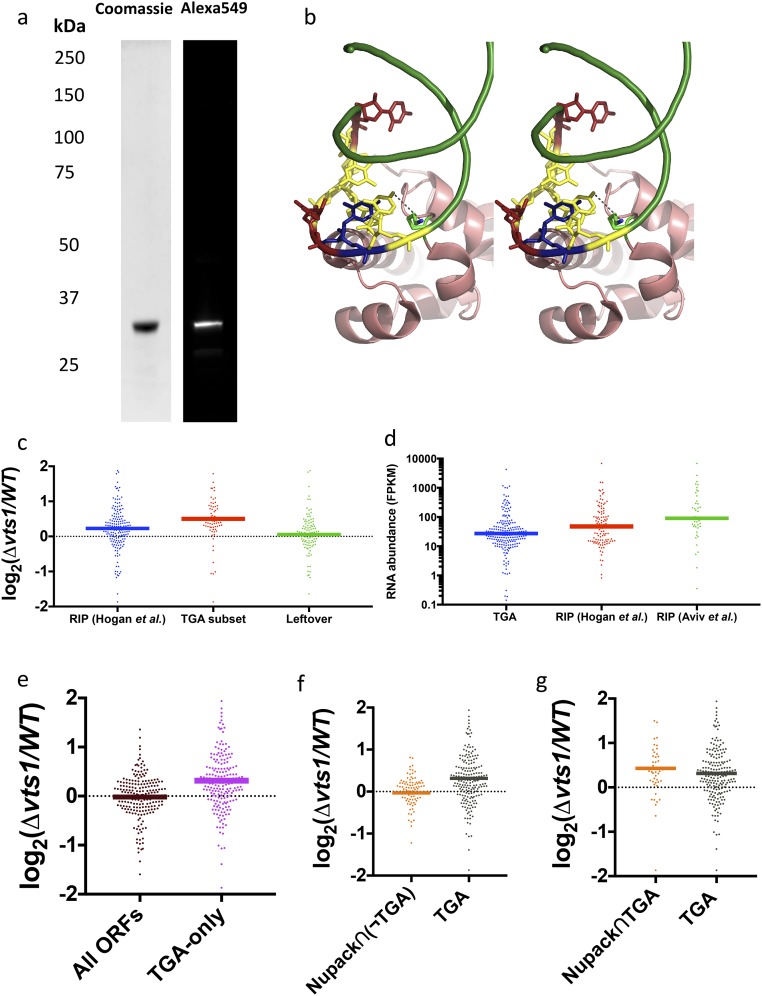
Our known Vts1 target controls included three variants of the Smaug recognition element (SRE), a widely used model Vts1 target. We compared these targets to investigate the sequence and structural features that modulate binding. These variants shared identical loop residues but differed in stem composition (SRE1–3 in Fig. 3 A and B). Although no stem composition preferences have previously been reported and no direct stem–Vts1 contacts are observable in the available structures (21, 27), TGA allowed us to observe approximately 10-fold stronger binding under these conditions to one of these variants (SRE3) (Fig. S6). We hypothesized that the enhanced apparent affinity of SRE3 arose from a G:C base pair at the base of the loop with guanosine on the 5′ side (position G0), a feature not shared by the other two SREs (SRE3 is not predicted to be more stable than SRE1 or SRE2). Among the 325 endogenous binding targets defined by TGA, ∼60% also had a G:C loop closure [Fig. 3C; P < 10−70 by binomial cumulative distribution function (CDF)]. Collectively, these targets bound Vts1 more strongly than those without G:C closures (Fig. 3C; P = 5 × 10⁻⁶) (20). In contrast, the inverse C:G base pair was represented in only ∼3% of targets (P < 10−14 by binomial CDF). These bound Vts1 more weakly than average, although many such stem loops in the transcribed genome likely did not bind Vts1 at all. Based on the NMR structure of Vts1 [Protein Data Bank (PDB) ID code 2ESE], this preference may arise from interactions of G0 with a highly conserved lysine residue within Vts1 (Lys467, Fig. S7B). Indeed, Lys467 mutant proteins exhibit reduced substrate binding (21, 22). Among all Vts1 targets, our data revealed that among endogenous targets C:G base pairing between loop positions 1 and 4 is preferred (∼87% of targets) and correlates with the strongest apparent affinities (Fig. 3D). Following position 4, a variable (0–3 nt) uridine-rich bulge had minor discernable effects on apparent affinity; a 1-nt bulge was most common in Vts1 targets (Fig. 3E, Movie S1, and Materials and Methods).
Fig. 3.
Structural determinants of affinity and kinetics. (A) Cartoon representations of the canonical Smaug recognition elements (SREs) and SSA1 target region. (B) Median apparent Kd (Materials and Methods) of the canonical SREs reveal that the two elements derived from the nanos 3′-UTR are weaker binders than the synthetic stem loop SRE3 and comparable to genomic target SSA1 (nSRE1 = 748; nSRE2 = 99; nSRE3 = 156; nSSA1 = 10, 95% CI). (C–E) Relationship between binding affinity and various hairpin structures classified by loop closure bases (C), base identity in positions 1 and 4 of the loop (D), and U-rich bulge presence and length (E) across all genomic targets identified by TGA.
Fig. S6.
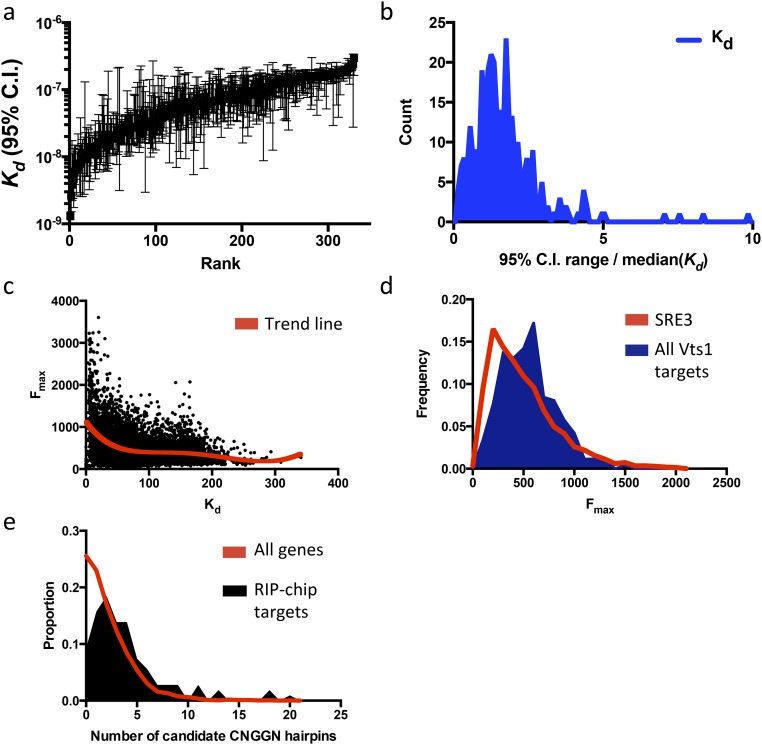
(A) Bootstrapped 95% confidence intervals (Kd) for all Vts1 targets, sorted by Kd rank. (B) Histogram of 95% confidence interval range, scaled by median apparent Kd. (C) Weak correlation of Fmax (arbitrary units) vs. Kd (in nanomolar concentration) in equilibrium binding curve fit. (D) Histogram of Fmax values for SRE3 (one of the strongest Vts1 targets) vs. all other Vts1 targets. (E) Number of candidate CNGGN hairpins in RIP-chip–only target genes vs. all genes.
Fig. S7.
(A) Protein purification gel and SNAP-tag labeling quantification. (B) Stereoview of predicted interaction between nucleotide at position “0” and conserved lysine residue (Lys467). (C) Log2 ratio of gene expression between Δvts1 cells and WT cells. Out of all RIP-chip–defined targets, TGA picks out a subset that is much more highly expressed in Δvts1 cells than in WT cells. The remaining leftover targets show no enrichment compared with control targets. (D) RIP-chip targets are more abundant than TGA targets as measured by fragments per kilobase of transcript per million mapped reads (FPKM) in WT cells. (E) Targets unique to TGA are more highly expressed in Δvts1 cells compared with a control set of transcripts. (F) Predicted in silico targets with fold score of >5 exhibit modest overlap with TGA targets (48/296). Among nonoverlapping targets, the 92 genic targets [Nupack∩(¬TGA)] are functionally assessed by transcript levels in Δvts1 cells vs. WT cells. (G) Forty-eight shared targets between TGA and Nupack (Nupack∩TGA) assessed via transcript expression.
Functional Consequences of Vts1 Binding.
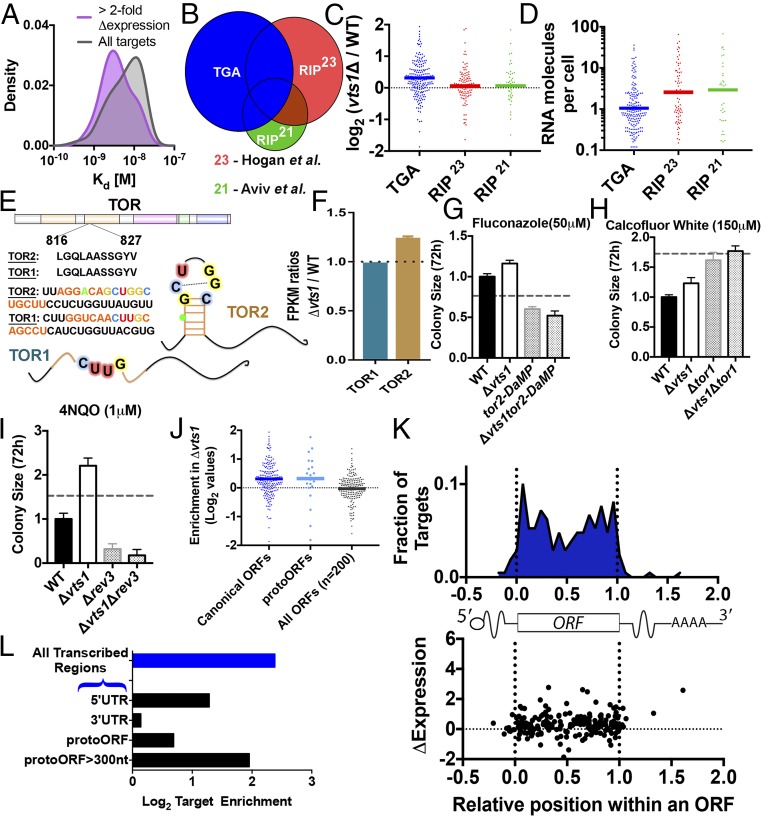
Next, we sought to determine whether the Vts1–RNA interactions identified by TGA had functional consequences in vivo, relying on Vts1’s role in targeting its substrates for decay (20, 24). To do so, we performed high-coverage, stranded RNA-sequencing data on both S. cerevisiae wild-type and Vts1 knockout cells (vts1Δ). Because TGA defines binding targets in a purely in vitro context, in the absence of transfactors, posttranscriptional base modifications, and without regard to transcript localization or abundance, one might expect many of our TGA-defined targets to behave differently in the complex environment of a cell. However, we found a robust phenotypic signature for TGA-defined Vts1 targets. As a class, they were more highly expressed in vts1Δ cells than in wild-type cells (Fig. 4C, P = 1.1 × 10⁻⁶ by permutation test). Target transcripts showing more than twofold increase in expression in vts1Δ cells were significantly stronger binders (P = 0.019 by bootstrap test), highlighting the unique quantitative capability of TGA to systemically link biological phenotypes with fundamental biophysical parameters (Fig. 4A). Conversely, some up-regulated transcripts were not identified as Vts1 targets by TGA. These could in principle be false negatives. However, none of these up-regulated transcripts were predicted by in silico folding to contain a Vts1 binding motif, making it likely that many were perturbed by indirect effects from true Vts1 substrates. As a whole, computationally predicted Vts1 binding sites showed modest overlap with TGA targets (48/296), but sequences that showed no binding in our in vitro TGA assay exhibited no up-regulation in vts1Δ cells (P < 0.0001, Welch’s t test; Fig. S7 F and G).
Fig. 4.
TGA reveals evidence of positive selection and enrichment in protogenes. (A) Targets with more than twofold increase in expression upon vts1 deletion (purple; smoothed density estimation, n = 20) have generally lower apparent Kd compared with all Vts1 targets identified by TGA (gray). (B and C) TGA targets (blue, nonintergenic, n = 205) are enriched vts1Δ cells compared with wild-type cells. RIP-chip targets not detected in TGA [red, n = 108, Hogan et al. (23); green, n = 43, Aviv et al. (21)] do not show enhanced expression in vts1Δ cells. The y axis in C is in log2 scale. (D) RNA abundance for TGA targets vs. RIP-chip targets. (E) Vts1 binding site is present in tor2 but not in its homolog tor1. (F) tor2 is more highly expressed in vts1Δ vs. wild type. tor1 is not (two biological replicates each; SEM). (G and H) tor2 exhibits strong negative epistasis with vts1. tor1 does not (4–16 technical replicates; SEM; dotted line represents no epistasis expectation; Materials and Methods). (I) rev3 shows negative epistasis with vts1 under DNA damage conditions. (J) RNA-seq expression for protoORF targets. (K) Metagene showing the distribution of Vts1 binding targets by position in ORF. Position in ORF is not correlated to up-regulation in vts1Δ cells. (L) Enrichment analysis based on equimolar representation of all genomic sequences. Vts1 targets are enriched in 5′-UTRs and but not in 3′-UTRs. Vts1 targets are also highly enriched on the template strand compared with the nontemplate strand (P < 10−16, binomial CDF).
We also compared the Vts1 substrates identified by TGA to those determined in two independent RNA immunoprecipitation (RIP-chip) studies (21, 23) (Fig. 4B and Fig. S6E). The two RIP-chip experiments had poor overlap with each other (19.6% or 42 shared substrates among 214 total). RIP-chip targets missed by TGA were often very abundant, poor matches for the identified binding motif (Fig. S5A), and showed no change in expression between wild-type and vts1Δ cells (Fig. 4 C and D). Because these targets exhibited no functional repression by Vts1 in vivo, they could represent false positives inherent to immunoprecipitation methods. Targets common to both TGA and RIP-chip exhibited a stronger degree of up-regulation than either method alone, highlighting a potential synergy between complementary methods for studying RBP function (Fig. S7C).
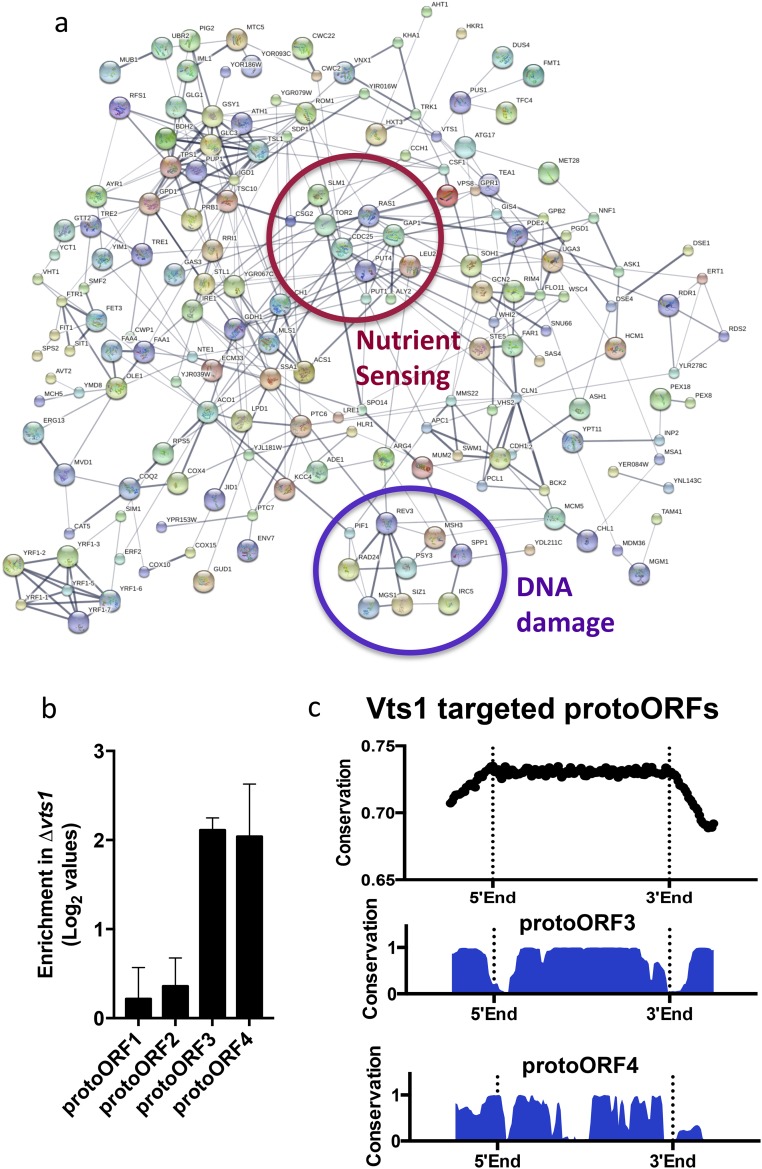
TGA analysis also identified 145 binding targets that prior studies did not (325 vs. 180) (21, 23, 27). These targets included many key regulators of metabolism, cell cycle, and DNA repair (e.g., Tor2, Apc1, Polς) and they clustered into distinct functional subnetworks, for example, controlling nutrient sensing and the DNA damage response (Fig. S8A). Because we identified these binding events in the absence of additional RBPs and other factors inherent to the cellular environment, we examined their functional relevance. Most of these transcripts bound Vts1 strongly and harbored robust consensus motifs. Virtually all were expressed at low levels in standard growth conditions, highlighting a distinct advantage of TGA’s equimolar presentation of the entire potential RNA landscape (Fig. 4D and Fig. S7D). Critically, these targets were expressed at higher levels in vts1Δ cells (Fig. S7E), providing strong evidence that they were bona fide targets in vivo.
Fig. S8.
(A) STRINGdb representation of the protein interaction network of all TGA targets. The TGA network contains significantly more interactions than expected (almost three times). Clusters of genes involved in DNA damage response and nutrient sensing are highlighted in blue and red. (B) qRT-PCR for randomly selected protoORFs in Δvts1 cells vs. WT cells. (C) Conservation of Vts1-targeted protoORFs as defined by the UCSC genome browser across seven fungal species.
We picked two TGA-specific targets to investigate in greater depth in vivo. TGA identified the RNA encoding the nutrient sensing protein Tor2, but not its paralog Tor1, as a Vts1 target. The Vts1 binding site in TOR2 fell within a region that encodes an identical amino acid sequence in both paralogs. However, several synonymous mutations abolished the Vts1 binding site in TOR1 (Fig. 4E). Consequently, in vts1Δ cells, there was an increase in TOR2 expression, whereas TOR1 expression was unchanged (Fig. 4F). Because the TOR2 gene is essential, we used a tor2 decreased abundance by mRNA perturbation (DAmP) partial loss-of-function allele to reduce its expression while maintaining cell viability (34). Cells harboring the tor2-DaMP allele were sensitive to the antifungal drug fluconazole, whereas those harboring a vts1 deletion (vts1Δ) were resistant. If tor2-DaMP and vts1Δ acted via independent mechanisms, the combined double-mutant vts1Δ tor2-DaMP cells should display an intermediate phenotype. However, we observed a strong epistatic relationship between the two genes: vts1Δ tor2-DaMP cells grew very similarly to tor2-DaMP single mutant cells (Fig. 4G). In contrast, mutants in vts1 and tor1 exhibited no epistasis (Fig. 4H). We next extended our analysis to Rev3, the catalytic subunit of DNA Polς, a translesion polymerase responsible for most mutagenesis in eukaryotic cells and an emerging therapeutic target for chemoresistant malignancies (35). As others have reported, the rev3Δ cells were sensitive to DNA-damaging agents (Fig. 4I). vts1Δ cells, in contrast, were more resistant than wild-type cells. The double-mutant vts1Δ rev3Δ cells phenocopied the rev3Δ single mutant, demonstrating negative epistasis between the two genes. These robust genetic interactions demonstrate the power of TGA to reveal previously unknown regulatory relationships for even an exceptionally well-studied RBP.
Vts1 and the Birth of New Genes.
Nearly one-third of the Vts1 targets we discovered fell in intergenic sequences. We wondered whether any of these sites might represent functional RBP targets. The S. cerevisiae genome encodes over 100,000 transcribed nongenic sequences (protoORFs). Only a small fraction of these sequences are detectably translated, but many are transcribed at low or moderate levels; these “protoORFs” have been hypothesized to provide a fertile evolutionary testing ground for the birth of new genes (36). Although previous RIP-chip experiments were incapable of detecting protoORF targets for various technical reasons, we asked whether TGA could. Indeed, the vast majority of intergenic TGA targets were contained in previously defined protoORFs (73%, P < 10−19, Poisson CDF). We observed no binding to other classes of noncoding RNAs, such as tRNAs, small nucleolar RNAs, or rRNA. The few remaining targets fell in sequences that rarely or potentially never exist as RNA within a cell. These sequences may illustrate the possibility for the Vts1 regulatory motif to arise purely through drift, in the absence of any selection on a functional transcript. Vts1 binding sites were even more strongly enriched among longer (>300 nt) protoORFs (P = 0.023, Poisson CDF), which some have argued are more “evolutionarily developed” and are more likely to be translated (36) (Fig. 4L).
To determine whether Vts1 regulates protoORF targets in living cells, we again examined our high-coverage, stranded RNA-sequencing data from vts1Δ and wild-type cells. Strikingly, Vts1-targeted protoORFs were as strongly regulated by Vts1 as canonical ORFs, which is remarkable given their recent evolutionary origins (Fig. 4J; P = 0.036, bootstrap distribution). We obtained similar results for a set of randomly selected protoORFs not detected in our RNA-seq experiment via quantitative RT-PCR (qRT-PCR) (Fig. S8B). We propose that acquisition of a Vts1 binding site allows a nascent gene to easily acquire a regulated expression profile downstream of the complex developmental pathways that regulate Vts1/Smaug itself.
Acquisition and loss of Vts1 binding sites was not confined to nascent genes alone—among paralogs in the yeast genome, we found 40 pairs of paralogs where only one of the two paralogs contains a Vts1 binding site. In all cases, the nonbinding paralog mutated critical elements of the core Vts1 binding motif. We also discovered three pairs of paralogs that contained Vts1 binding sites in entirely different regions of the transcript. Thus, gain and loss of Vts1 binding sites over evolutionary time can provide a route for diversifying gene duplications and rewiring regulatory networks.
Finally, because TGA provides nucleotide-level resolution, we investigated how the location of a Vts1 binding site within a message influences transcript levels. In light of a large body of literature implicating Vts1 binding in transcript deadenylation via recruitment of the CCR4-NOT1 complex to 3′-UTRs (24, 37), it is striking that only seven 3′-UTR binding sites occur across the entire transcribed genome array. Indeed, Vts1 binding sites were strongly enriched in 5′-UTRs but not in 3′-UTRs (P = 0.0067, P = 0.31, Poisson CDF; Fig. 4L). The enrichment in 5′-UTRs could point to the importance of Vts1 in the regulation of translation initiation (25). However, our genome-wide, nucleotide-resolved dataset established that the impact of Vts1 on transcript abundance is largely independent of where it binds within an mRNA (Fig. 4K). We conclude that Vts1 binding outside of the 3′-UTR may be the predominant mode by which this RBP regulates gene expression.
Discussion
TGA combines the best features of many separate methods for studying RNA–RBP interactions and complements many of their individual weaknesses (Table 1) (10). Like RIP- and CLIP-seq, it identifies a transcriptome-wide compendium of functional binding targets. Like EMSA and FP, TGA can provide estimates of binding parameters for each target. Like selection-based methods (SEQRS/RBNS), de novo primary sequence and structural motifs are recovered in a single experiment (38, 39). Last, unlike other methods, TGA enables a quantitative description of the relationship between variant RNA structures, affinity, and in vivo phenotype irrespective of transcript abundance. Although TGA is at its core an in vitro measurement between a recombinant protein and a highly redundant array of RNA fragments, our data demonstrate that experimental evaluation of sequence- and structure-specific binding synergistically complements in vivo measurements of RBP occupancy.
Table 1.
Summary characteristics for various methods of studying RNA–protein interactions [adapted from Campbell and Wickens (10)]
| Method | De novo motif ID (length) | Measurement of equilibrium Kd | Transcriptome-wide analysis | Unbiased equimolar transcriptome | In vivo context |
| TGA | Yes (11) | Direct | Yes | Yes | No |
| HiTS-RAP | Direct | Direct | No | No | No |
| CLIP-seq | No | No | Yes | No | Yes |
| RIP-chip/seq | Yes | Indirect | Yes | No | Yes |
| SEQRS | Yes (3) | Correlated | No | No | No |
| RNA tagging | Yes | Indirect | Yes | No | Yes |
| EMSA | No | Direct | No | No | No |
Our technology establishes a flexible platform for high-throughput biochemistry that can be easily extended to any nucleic acid template (e.g., the human exome), used to study diverse types of biochemical interaction (e.g., RNA-guided nucleases), and adapted to even higher- throughput systems (e.g., HiSeq). Our application of TGA to Vts1 (i) doubled the number of known Vts1 targets, identifying key regulators of cell cycle and the DNA damage response; (ii) provided a marked improvement in the specificity of the protein’s binding motif; (iii) generated structural insight into its ability to discriminate among targets; and (iv) suggested that Vts1 may have a role in regulating the transcripts of evolutionarily nascent genes. The breadth of findings stemming from analysis of an already exceptionally well-studied RBP suggests that TGA technology will be similarly enabling for other RBPs and establishes a paradigm for quantitative, ultrahigh-throughput biochemistry.
Materials and Methods
Detailed information is provided in SI Materials and Methods. After sequencing, additional chemistry was performed on the MiSeq flow cell to generate RNA in a manner similar to RNA-MaP methodology (29). A custom microfluidic station was built from repurposed components harvested from an Illumina Genome Analyzer II (GAII) (Table S1 for parts list). Vts1 recombinant protein was purified from E. coli. Biological validation of TGA hits was performed in S. cerevisiae. Additional tables, example images, and code can be found at https://www.dropbox.com/s/juo3bnow2wdd8zq/Supplemental%20Data.zip?dl=0.
Table S1.
List of components used to construct the custom image station
| Component | Model no. (if applicable) | Source |
| Objective lens | Nikon 0500-0087 | GaIIx |
| 660-nm laser | CVI Melles Griot 85-RCA-400 660 nm/Universal Laser Controller | GaIIx |
| 532-nm laser | Laser Quantum Gem FC 532 nm/SMD6000 Controller | GaIIx |
| Fiber optic tables | GaIIx | |
| MiSeq flowcell mount/thermal interface | Custom | GaIIx/custom-retrofitted parts |
| Thermoelectric module | VT-127-1.0-1.3-71P | TE Technology |
| Thermistor | MP-2444 | TE Technology |
| DAQ | USB-6009 | National Instruments |
| Fiber optic switch | Luminos Industries CORALIGN #CO12 | GaIIx |
| Motorized Z stage | ASI 1000201 | GaIIx |
| Motorized X–Y stage | ASI 1000197 | GaIIx |
| Motorized filter wheel | ASI FW-1000-BR | GaIIx |
| RS232 stage and filter wheel controller | ASI LX-4000 | GaIIx/custom-retrofitted parts |
| CCD camera | Photometrics CoolSNAP K4 | TE Technology |
| Camera/laser timing control board | Custom | Custom PCB |
| Fiber optic phase scrambler | General Photonics MMS-101B-6X-ILM | GaIIx |
| Cooling pump | SolidState Cooling 10-150-G1-P1 | GaIIx |
| Syringe pump | Kloehn VersaPump 6 8-Channel Pump 20480 | GaIIx |
SI Materials and Methods
Strains Used in This Study.
The strains used in this study are as follows: query strain: S. cerevisiae BY4742 MATα vts1Δ::NatMX can1Δ::STE2pr-Sp_his5 lyp1Δ his3Δ1 leu2Δ0 ura3Δ0 met15Δ0 (40); single deletion strains: BY4741 MATa vts1::KanMX his3Δ1 leu2Δ0 ura3Δ0 met15Δ0; BY4741 MATa tor1::KanMX his3Δ1 leu2Δ0 ura3Δ0 met15Δ0; BY4741 MATa rev3::KanMX his3Δ1 leu2Δ0 ura3Δ0 met15Δ0; DaMP strain: BY4741 MATa tor2-DaMP his3Δ1 leu2Δ0 ura3Δ0 met15Δ0 (34); double deletion strains: BY4741 MATa vts1Δ::NatMX tor1::KanMX can1Δ::STE2pr-Sp_his5 lyp1Δ his3Δ1 leu2Δ0 ura3Δ0 met15Δ0; BY4741 MATa vts1Δ::NatMX tor2-DaMP can1Δ::STE2pr-Sp_his5 lyp1Δ his3Δ1 leu2Δ0 ura3Δ0 met15Δ0; BY4741 MATa vts1Δ::NatMX rev3::KanMX can1Δ::STE2pr-Sp_his5 lyp1Δ his3Δ1 leu2Δ0 ura3Δ0 met15Δ0.
Construction of a Custom Microfluidic Imaging Platform.
Internally, the MiSeq determines the sequence of each cluster by fluorescence imaging of reversibly labeled and 3′-terminated nucleotides that are serially incorporated by a DNA polymerase as templated by library constructs. Randomly arrayed clonal clusters on the flow cell are imaged in “tiles,” where each tile corresponds to a field of view along the length of the flow cell lane (41). Because the MiSeq is not amenable to custom protocols, we use the fact that tile number and cluster position are reported along with each sequence to enable downstream assays that are read out on a separate, custom-built instrument, using the previously sequenced MiSeq flow cell as an ultrahigh-throughput array and a substrate for subsequent in situ RNA generation.
The custom imaging station was built from repurposed components harvested from an Illumina Genome Analyzer II (GAII). The GAII is a previous-generation sequencer that, due to limitations in read length, speed, reagent availability, as well as the large amount of hands-on time required for operation, is all but defunct and is rapidly being phased out in favor of newer sequencers that are more convenient and economical. Although pioneering sequencing-flow cell-array experiments done by our group and others have used the GAII as both a platform for sequencing and subsequent assays (28, 29, 42), the Genome Analyzer is likely not a practical option for further development of these high-throughput experiments. However, as outdated GAII sequencers are decommissioned and often available for repurposing, many high-quality components still within their usable service life are readily available.
We built an instrument that accepts previously sequenced MiSeq flow cells, interfacing with the fluidics, allowing thermal control, and enabling fluorescence imaging. Using separate instruments for sequencing and downstream assays allows maximum flexibility for custom protocols, for example, RNA generation and binding. This instrument was built combining many components from used GAII instruments with custom-engineered retrofit components, electronics, and software (Table S1).
Just as in the MiSeq, our custom imaging station images the flow cell in tiles along the length of the lane. To associate the signal from each cluster in the image with its corresponding sequence, cross-correlation methods are used to register tile images from the custom imaging station to the sequence data positions for each tile from the MiSeq. However, nonaffine optical aberrations between the two platforms make simple translation (by the offset indicated by the cross-correlation peak) insufficient for precise registration. To this end, we use a hierarchical registration method where the entire image is first globally registered to the data, and then the data within a progressively finer grid of subtiles are each individually registered to the subimage in their local neighborhood. In this study, we did two levels of hierarchical registration, a coarse registration with a 4 × 4 grid followed by a fine registration with a 16 × 16 grid. After this progressive discrete registration is complete, a continuous function describing the aberrations between platforms in both x and y is fit to a quadratic surface:
Together, these functions constitute a continuous offset map, which is then applied to the data to achieve precise alignment of sequence data and experimental images.
Library Design and Construction.
We used a standard Nextera library preparation kit (Illumina) to enzymatically fragment the S. cerevisiae genome into 80- to 300-nt fragments. We used PCR to attach an 8-nt i5 barcode, an E. coli RNA polymerase (RNAP) promoter, an RNAP stall sequence, and Illumina sequencing adapters (Fig. S3A). This initial PCR was run with 0.5 μM of each primer (IDT) and stopped before completion. The concentration of DNA was quantified via qPCR and the PCR was further amplified to a final concentration of 4 nM using short P1/P2 primers that anneal to the 5′ ends. The final PCR was purified using AMPure XP beads (Beckman Coulter). A conceptually similar PCR protocol was used to amplify each of the 3 SRE variants from a parent vector kindly provided by C. Smibert, University of Toronto, Toronto (https://benchling.com/s/EHytJEzc/edit). Primers were chosen such that an additional Nextera adapter sequence was added on each end to match the fragmented genomic library. The SRE library preparation was added to the genomic library prep at a molar ratio of 1:1,000.
Sequencing Amplified Libraries.
The library was sequenced using a paired-end 2 × 75 MiSeq Reagent Kit, version 3, at a cluster density of 946,000 per mm2 with 95% clusters PF and 97% ≥ Q30. The flow cell was removed from the sequencer before the standard postrun wash step and stored in its original storage buffer for up to 1 mo. All FASTQ files from individual barcodes were provided as input for the software analysis pipeline.
Generation of a Transcribed Genome Array.
Double-stranded DNA (dsDNA) clusters on the MiSeq flow cell were denatured with formamide at 55 °C to remove all fluorescent nucleotide analogs. Following denaturation, we confirmed no residual fluorescence from the sequencing. To regenerate dsDNA with standard nucleotides, we annealed a 5′ biotinylated primer to the 3′ sequencing adaptor and resynthesized dsDNA using Klenow DNA polymerase (1× NEB buffer 2, 250 μM dNTP mix, 0.1 units/μL NEB Klenow, 0.01% Tween 20) incubated for 30 min at 37 °C. We then flowed in 1 μM RNase-free streptavidin to bind to the 5′ biotinylated primer and passivized with a 5 μM biotin wash. To block and quantify all potential single-stranded DNA, we annealed an Alexa 647-labeled oligo complementary to the constant stall sequence. As a control, we flowed in 10 nM Vts1 at this stage and observed no binding to DNA. We then incubated the dsDNA with a transcription initiation mix containing sigma-saturated RNAP and 3 nt at 2.5 μM (1× T7A1 reaction buffer [20 mM Tris, 20 mM NaCl, 7 mM MgCl2, 0.1 mM EDTA, 0.1% BME, 0.03 mg/mL BSA, 2.14% (vol/vol) glycerol], 25 μM of each NTP [ATP, GTP, and UTP], 125 U/mL RNAP [sigma-saturated holoenzyme from NEB], and 0.01% Tween-20) for 10 min at 37 °C. In this buffer, RNAP initiated onto dsDNA clusters and progressed to the first cytosine where it stalled. These initial 26 bases of transcription were sufficient to keep the RNAP bound to the dsDNA, but short enough such that the footprint from the stalled RNAP occluded the initiation site from additional RNAP. Excess RNAP was washed from solution with the original transcription initiation mix minus RNAP. Finally, extension buffer (1 mM all four NTPs in 1× T7A1 reaction buffer) was added for 5 min at 37 °C to allow transcription to proceed. After transcription, RNAP was terminally stalled at the biotin–streptavidin roadblock, generating a stable RNAP-mediated DNA–RNA tether.
Vts1 Protein Purification, Labeling, and Quantification.
Gibson cloning was used to insert the RNA binding domain of Vts1 (442–523) into a pET vector containing C-terminal SNAP and 6×His tags (https://benchling.com/s/yBCqWM/edit). The resultant plasmid [Vts1(442–523)-SNAP-His6] was transformed into E. coli BL21(DE3) cells. Following induction trials, a 2-L culture derived from a single transformant was grown at 37 °C in Luria–Bertani medium containing 50 μg/mL kanamycin until the OD600 reached 0.6. The culture was then adjusted to 1 mM isopropyl β-d-1-thiogalactopyranoside (IPTG) and incubated for 3 h at 37 °C with continuous shaking. Cells were harvested by centrifugation, and the pellet was stored at −80 °C. All subsequent procedures were performed at 4 °C. Thawed cell pellets were resuspended in 30 mL of buffer A [50 mM Tris⋅HCl, pH 7.4, 250 mM NaCl, 10% (wt/vol) sucrose] in presence of two protease inhibitor tablets (Roche). Lysozyme was added to a final concentration of 0.2 mg/mL. After mixing for 1 h, the lysate was sonicated to reduce viscosity, and insoluble material was removed by centrifugation for 45 min at 30,000 × g. The soluble extract was mixed for 1 h with 10 mL of a 50% (vol/vol) slurry of Ni-NTA resin (Qiagen) that had been equilibrated in buffer A. The resin was recovered by centrifugation and resuspended in 20 mL of buffer B [50 mM Tris⋅HCl, pH 7.4, 150 mM NaCl, 10% (vol/vol) glycerol]. The cycle of centrifugation and resuspension of the resin was repeated thrice, after which the resin (5 mL) was poured into a column. The column was washed serially with 10 mL of buffer C (50 mM Tris⋅HCl, pH 7.4, 2 M KCl) and 10 mL of buffer B containing 25 mM imidazole. The bound proteins were eluted stepwise in 10-mL aliquots of 100, 200, 300, 400, and 500 mM imidazole in buffer B. The elution profile was monitored by SDS/PAGE. The 300 and 400 mM imidazole eluate fractions containing Vts1(442–523)-SNAP-His6 were pooled and dialyzed for 3 h against 4 L of buffer C [50 mM Tris⋅HCl, pH 7.4, 20 mM NaCl, 10% (vol/vol) glycerol, 2 mM DTT]. The dialysate was then mixed for 1 h with 2 mL of a 50% (vol/vol) slurry of SP-Sepharose resin (GE) that had been equilibrated in buffer C. The resin (1 mL) was then poured into a column and Vts1(442–523)-SNAP-His6 was recovered as a flow-through and subsequently concentrated by centrifugal ultrafiltration (Fig. S7A). Protein concentration was measured both by Bradford dye reagent and A280 absorbance. A high yield of highly purified protein (∼25 mg per L of bacterial culture) was obtained. Subsequently, Vts1(442–523)-SNAP-His6 was fluorescently labeled using SNAP-Surface549 (NEB). Covalent labeling of the SNAP tag was conducted by incubating 80 µL of reaction mixture containing 50 mM Tris⋅HCl, pH 7.4, 100 mM NaCl, 0.1% Tween 20, 2 mM DTT, 10 μM Vts1(442–523)-SNAP-His6, and 20 μM SNAP-Surface 549 (NEB) at 4 °C for 16 h. Excess fluorescent dye was removed using 7K MWCO Zeba spin desalting columns (Thermo) following manufacturer’s instructions, and the labeled protein was recovered in buffer TMK (100 mM Tris⋅HCl, pH 7.4, 80 mM KCl, 10 mM MgCl2, 1 mM DTT) (Fig. S7A). Concentration of labeled protein was measured using A280 absorbance and was corrected for dye absorbance.
Vts1 Binding Experiments on the TGA.
SNAP-Surface 549 labeled Vts1 was diluted in binding buffer (20 mM Tris⋅HCl, pH 7.4, 150 mM NaCl, 0.01% Tween 20, 5 mM MgCl2, 0.1 mg/mL BSA) to obtain a twofold protein dilution series from 1 to 128 nM. The MiSeq flow cell was first imaged in the green channel under buffer-only conditions (zero concentration point) and subsequently after flowing protein at increasing concentrations. At each concentration, we took nine images over a period of ∼40–45 min to empirically verify that equilibrium had been reached. Following binding at the highest concentration (128 nM of labeled protein), a washout experiment was conducted by flushing binding buffer containing no protein into the flow cell and repeated imaging at 12 time points spanning 800 min in a geometric spread over time.
A fraction of the fluorescence signal was often present at the end of the experiments on clusters positive for binding, suggesting the possibility of incubation time-dependent off-rates or a permanently bound fraction, which is an area of future characterization. Before fitting of Kd, therefore, we normalized this residual signal such that the fraction expected for each incubation time was proportional to the incubated protein concentration. This normalization generally had small effects on the fitting of Kd. Photobleaching and photo–cross-linking controls were also performed, with bleaching effects estimated to be in the ∼1% range. After correcting for bleaching, we report median apparent Kd values from clusters that were observed to bind above background at each genomic locus to provide relative measures of binding strength under the described experimental conditions.
Median apparent Kd values for TGA substrates were calculated by fitting an equilibrium-binding curve at different protein concentrations. Although the relative concentrations of protein were controlled by dilution, the absolute quantification of protein was measured by A280. An error in this absolute quantification may account for the constant correction factor between TGA measurements and fluorescence polarization measurements of Kd from the literature. The absolute protein concentration could have been overestimated due to (i) incomplete SNAP-labeling and the presence of unlabeled dark Vts1-SAM in the A280 quantification, and (ii) an increase in absorbance per unit protein due to conjugation with the dye. Overestimating the absolute concentration of protein would result in underestimating the true Kd by a constant factor, which matches the observation that bulk solution measurements of affinity are stronger by a constant factor. Furthermore, literature-reported Kd values derive from an idealized stem loop that does not exist in the yeast genome. We therefore compared the literature-reported Kd values to cohorts of stem loops sharing the same structural features, which necessarily includes both weak and strong binders.
Neighborhood Mapping Method.
We used standard MATLAB image-processing algorithms to identify Vts1 binding events in the highest concentration image (128 nM). We first performed a morphological opening to correct for background illumination and set a manual threshold to segment binding events (Fig. S2). Roughly 500 binding events per image were identified (1 in 1,000 RNA clusters). The subpixel resolution sequencer coordinate map was used to map each binding event to its underlying sequence. Due to chromatic aberration between the red channel (used to quantify RNA) and the green channel (used to measure Vts1 binding), a direct overlay was not possible. Instead, we leveraged the bounded nature of the chromatic aberration to consider all RNA clusters within a 10 × 10-pixel radius as candidate clusters (Fig. S2E). We pooled the candidate clusters and mapped all candidate substrates to the yeast genome (43–46). True binding regions were defined as regions with at least 12 unique binding events mapping to that region in a highly strand-specific manner (P < 0.001, binomial test). Highly degenerate or high coverage regions were removed by subtracting regions found from candidate sequence pools generated from control neighborhoods offset by 10 pixels from the true binding event. One remaining set of degenerate targets derived from subtelomeric regions (YRF1-1 to YRF1-8) was not included in downstream analysis, even though four of these targets have been identified in previous studies.
Fitting Kd.
Integrated fluorescence values at eight concentrations of Vts1 (from 1 to 128 nM) were measured from a constant mask for each cluster. After accounting for a relatively small immobile signal fraction (see above) and a bleaching correction, these values were fit to a binding curve with the following equation:
where Fobs is observed fluorescence, Fmax is fit maximum fluorescence, Fmin is fit minimum fluorescence, Kd is affinity constant, x is concentration of Vts1, and n is the Hill coefficient. The Hill coefficient was found to be approximately equal to 1 in all cases and was subsequently set to 1 for refitting.
De Novo Primary Motif Search.
The bounds of each binding region were defined using a crude peak-calling algorithm based on read-depth coverage. The edges of the binding region were set as the location where the read coverage dropped below the half-maximal coverage for that region, which produced compacted intervals of ∼80 nt in length. The FASTA sequences for the 325 binding regions were input in the RNAcontext algorithm (31) with the reverse complement sequences used as nonbinding controls to maintain equal base composition. The algorithm was run with the PHIME structural alphabet, 200-nt local folding window, and a min/max motif length of 4/12. As a control, 325 regions containing CNGGN motifs were randomly chosen from the S. cerevisiae genome and analyzed using the RNAcontext algorithm with the same parameters. No significant motif or structural preference was found in this control dataset (Fig. S4A).
Covariation Matrix Construction.
A covariation matrix was constructed by creating a multiple sequence alignment centered on each instance of “GCNGGN” within the binding regions. The covariance between each pair of positions was calculated as a raw count of all pairwise nucleotide combinations (Fig. S4C). The matrix was then reduced by substituting covariance with the probability of base pairing (including G:U base pairs). A z score was calculated by comparing the observed frequency of base pairing to the null expectation, accounting for nucleotide distribution at each individual position (Fig. 2B). As a control, a covariance matrix was constructed using a multiple sequence alignment of all instances of GCNGGN in the S. cerevisiae genome (Fig. S4D). No significant structural features were observed in this covariance matrix.
The strong diagonal signal in the covariation matrix defines a region of base pairing that spans between 5 and 8 bp (Fig. 2B; z score ∼ 10; loop length is defined by the number of residues between the two diagonals). All loop regions began at the invariant cytosine (C1; Fig. 2A, shown in blue) and extended for 4–7 nucleotides, encompassing a pair of invariant guanosines.
Single-Nucleotide Resolution of Binding Sites.
Once the covariation matrix confirmed the structural requirement for a hairpin loop, the location of the hairpin lop within each binding interval was determined to single-nucleotide resolution using a custom algorithm. First, all candidate CNGGN loop regions were identified via regular expressions. Next, the length of the adjoining stem region was calculated for potential loop lengths between 4 and 7, with the maximal stem length being kept. If the stem contained less than 4 bp (43 cases), a new regular expression search was initiated with alternate base pairs at the 1 and 4 positions in the loop. Each alternate base pair was evaluated for all possible loop lengths, and that with the longest stem was chosen. This resulted in a uniquely defined, single-nucleotide resolution stem loop variant for each binding region.
Comparison with Immunoprecipitation-Based Methods.
For stem loops that fell within the transcribed strand of an ORF (205/325), we compared TGA-identified targets to those previously published from two immunoprecipitation datasets for Vts1 (22, 23). We rejected the null hypothesis that TGA-defined targets are uncorrelated to previously defined targets (P < 10−30) by using a Poisson cumulative distribution to simulate a randomized selection of 205 ORF targets. For targets specific to one dataset and not present in the other, we report absolute transcript abundance as measured by Miura et al. (17).
Correlation Between Structural Features and Apparent Kd.
We grouped binding targets according to structural features such as G:C loop closure, loop length, and C1:G4 status. To calculate bootstrapped error for each substrate, we used MATLAB to bootstrap mean Kd values 5,000 times (without replacement) and report 95% confidence intervals of the resulting distribution (Fig. S6 A and B).
Identifying ProtoORF Targets.
We identified Vts1 binding sites within the set of 107,425 protoORFs as defined by Carvunis et al. (36). These protoORFs span about 60% of noncoding sequence space 9,380,000 nt out of 15,400,000 nt). The filtered set of protoORFs (>300 nt) span 437,946 nt of sequence space and contain more Vts1 binding sites compared the null expectation. We found that 73% of intergenic Vts1 targets fall within at least one protoORF. Enrichment was calculated against the null expectation that the 100 Vts1 hairpins observed in intergenic sequence arose at random positions, independently of any functional annotations. The P value for an enhanced enrichment for longer protoORFs was calculated based on the observed frequency of Vts1 binding any protoORF.
In Silico Folding of the Yeast Genome.
NUPACK3.0.4 was used to computationally fold local regions of the yeast genome. Local regions were centered on sequences that matched the consensus CNGGN hairpin sequence (total, 37,173) with 50 bp of flanking sequence on both sides. All sequences were folded using the “pairs” function, and all .ppairs outputs were parsed via a custom MATLAB script that sums all of the dot matrix outputs. Each dot matrix was also scored according whether a stem loop is predicted to form with CNGGN0–3 residues in the loop region. There were 296 loci with a stem loop score of >5. These loci were annotated by their position within the yeast genome, matched to our RNA-seq data, and functionally evaluated via transcript levels in vts1Δ vs. WT cells (Fig. S7F).
Analysis of Loop Composition and Length.
Our dataset revealed a strict requirement for G3 and for base pairing between positions 1 and 4 within the loop. This observation is consistent with NMR and X-ray crystallographic structural studies: G3 is the only nucleobase within the binding motif that directly contacts Vts1. Although most targets conformed to this C1–G4 base-pairing consensus, 43 of the 325 did not contain this canonical C:G base pair (Fig. 3C). In each of these targets, we detected alternative stem loops with A:U, G:C, and even G:U base pairs between positions 1 and 4. These targets were weaker Vts1 binders compared with loops with C1–G4 base pairs. Finally, following G4, we observed a variable uridine-rich bulge of 0–3 nt in length. Among Vts1 targets, a 1-nt uridine bulge was most common (48%), even though motifs without a bulge (25%) had slightly stronger affinities (Fig. 3E). Notably, the nucleotide at position 5 shows the greatest flexibility among the loop nucleotides in NMR ensembles (21), providing a possible structural explanation for why variation in loop length is tolerated, whereas the other structural features are more strictly required (Movie S1).
RNA Sequencing and Analysis.
RNA sequencing was performed on two biological replicates of wild-type (WT) and vts1Δ cells. Fifty milliliters of cells were grown to midexponential phase (OD ∼0.6), harvested, and snap frozen in liquid nitrogen. RNA extraction and library preparation was performed using standard kits (stranded, Ribo-Zero rRNA removal). All samples were sequenced to ∼30,000,000 read depth (1 × 50 bp) on one lane of a HiSeq 4000. Reads were cleaned and trimmed, aligned using Bowtie2, and quantified using Cufflinks (43–47). RNA-seq data will be deposited to Gene Expression Omnibus (GEO) before publication.
Growth Phenotyping and Analysis.
Growth phenotypes were measured for WT, single-deletion, and double-deletion strains in parallel with 4–16 technical replicates per strain. Strains were pinned onto agar plates using a Singer ROTOR robot and imaged at 24, 48, and 72 h time points using an Epson V700 photo scanner. Colony sizes were quantified using SGAtools (sgatools.ccbr.utoronto.ca) and normalized to WT. Edge effects were minimized by pinning control strains at all edge positions. No epistasis expectations were calculated according to both additive and multiplicative epistasis models. Added epistasis expectation is shown in Fig. 4 G–I.
Calculating Functional Enrichment.
We identified 298 Vts1 targets in transcribed sequences including protoORFs (16,650,091 bp total), but only 27 targets in nontranscribed strands (7,664,158 bp total) by our calculation). Given the equal representation of RNAs from all sequences in the TGA, we calculated functional enrichment against the null hypothesis that any stretch of sequence should be equally likely to contain a Vts1 binding site. For 5′-UTRs and 3′-UTRs, we calculated enrichment relative to the null expectation that a UTR sequence of a given length is as likely to contain a Vts1 binding site as any other genomic sequence of identical length. P values were calculated as the Poisson probability of having at least as many Vts1-binding sites as observed, given the null frequency of finding a binding site. The annotation of the yeast transcriptome was on the basis of Nagalakshmi et al. (48).
qRT-PCR for ProtoORFs.
RNA extraction was performed using standard hot-phenol method from midlog cultures of WT and delta Vts1 yeast cells (BY4741 background). Contaminating DNA was removed from the samples by treating with DNA-free DNA removal kit (Thermo AM1906) as per the manufacturer’s instructions. Primers to target protoORF regions were designed using Primer3 web tool. cDNA was generated from the input RNA using oligo-dT primers and SuperScript II Reverse Transcriptase (Thermo). Quantitative PCR assays were conducted in optical-grade 96-well plates on a Bio-Rad CFX Connect setup. The reactions were performed in 20-μL volumes with 2 μL of input cDNA, 1.5 μM of locus-specific forward and reverse primers, and 10 μL of 2× SYBR Green Master Mix (KAPA). All of the amplifications were carried out with an initial step at 95 °C for 5 min followed by 35 cycles of 95 °C for 30 s, 55 °C for 1 min followed by a melt curve analysis (65–95 °C in steps of 0.5 °C). Melt curve analysis for every reaction indicated a single product, which was further confirmed by agarose gel electrophoresis. The CQ was determined automatically by the instrument. No product was detected in control reactions in which primers, cDNA, or reverse transcriptase were omitted. All of these control reactions had CQ values of >35 cycles. Data were analyzed from three biological replicates for each sample using TAF10 as a reference gene. Log2 enrichment score for each sample was computed by the standard delta-delta-CQ method.
ProtoORF Conservation.
The conservation score track from the University of California, Santa Cruz (UCSC) genome browser was used to measure conservation for each protoORF. The conservation score is based on a genome-wide multiple sequence alignment of seven fungal genomes that span several hundred millions of years of evolution. Conservation scores were averaged across all Vts1-targeted protoORFs and plotted for individually validated protoORF targets (Fig. S8C).
Additional Data.
Additional tables, example images, and code can be found at https://www.dropbox.com/s/juo3bnow2wdd8zq/Supplemental%20Data.zip?dl=0.
Supplementary Material
Acknowledgments
This work was supported by National Institutes of Health (NIH) Grants R01-GM111990, P50-HG007735, and P01GM066275 (to W.J.G.), and DP2-GM119140 (to D.F.J.). D.F.J. is also supported as a Searle Scholar, as a Kimmel Scholar, and by a Science and Engineering Fellowship from the David and Lucile Packard Foundation. This work was catalyzed by a seed grant from the Stanford Systems Biology Center (P50-GM107615), and the Beckman Center (to W.J.G.). A.K.C. is a Howard Hughes Medical Institute Fellow of the Damon Runyon Cancer Research Foundation (DRG2221-15). R.S. is a Stanford Graduate Fellow.
Footnotes
The authors declare no conflict of interest.
This article is a PNAS Direct Submission.
Data deposition: The sequence reported in this paper has been deposited in the Gene Expression Omnibus (GEO) database, www.ncbi.nlm.nih.gov/geo (accession no. GSE95851).
This article contains supporting information online at www.pnas.org/lookup/suppl/doi:10.1073/pnas.1618370114/-/DCSupplemental.
References
- 1.Gerstberger S, Hafner M, Tuschl T. A census of human RNA-binding proteins. Nat Rev Genet. 2014;15(12):829–845. doi: 10.1038/nrg3813. [DOI] [PMC free article] [PubMed] [Google Scholar]
- 2.Tsvetanova NG, Klass DM, Salzman J, Brown PO. Proteome-wide search reveals unexpected RNA-binding proteins in Saccharomyces cerevisiae. PLoS One. 2010;5(9):1–12. doi: 10.1371/journal.pone.0012671. [DOI] [PMC free article] [PubMed] [Google Scholar]
- 3.Castello A, et al. Insights into RNA biology from an atlas of mammalian mRNA-binding proteins. Cell. 2012;149(6):1393–1406. doi: 10.1016/j.cell.2012.04.031. [DOI] [PubMed] [Google Scholar]
- 4.Bartel DP. MicroRNAs: Target recognition and regulatory functions. Cell. 2009;136(2):215–233. doi: 10.1016/j.cell.2009.01.002. [DOI] [PMC free article] [PubMed] [Google Scholar]
- 5.Curtis D, Lehmann R, Zamore PD. Translational regulation in development. Cell. 1995;81(2):171–178. doi: 10.1016/0092-8674(95)90325-9. [DOI] [PubMed] [Google Scholar]
- 6.Moore MJ, Proudfoot NJ. Pre-mRNA processing reaches back to transcription and ahead to translation. Cell. 2009;136(4):688–700. doi: 10.1016/j.cell.2009.02.001. [DOI] [PubMed] [Google Scholar]
- 7.Ray D, et al. A compendium of RNA-binding motifs for decoding gene regulation. Nature. 2013;499(7457):172–177. doi: 10.1038/nature12311. [DOI] [PMC free article] [PubMed] [Google Scholar]
- 8.Hellman LM, Fried MG. Electrophoretic mobility shift assay (EMSA) for detecting protein-nucleic acid interactions. Nat Protoc. 2007;2(8):1849–1861. doi: 10.1038/nprot.2007.249. [DOI] [PMC free article] [PubMed] [Google Scholar]
- 9.Shi X, Herschlag D. Fluorescence polarization anisotropy to measure RNA dynamics. Methods Enzymol. 2009;469:287–302. doi: 10.1016/S0076-6879(09)69014-5. [DOI] [PubMed] [Google Scholar]
- 10.Campbell ZT, Wickens M. Probing RNA-protein networks: Biochemistry meets genomics. Trends Biochem Sci. 2015;40(3):157–164. doi: 10.1016/j.tibs.2015.01.003. [DOI] [PMC free article] [PubMed] [Google Scholar]
- 11.McMahon AC, et al. TRIBE: Hijacking an RNA-editing enzyme to identify cell-specific targets of RNA-binding proteins. Cell. 2016;165(3):742–753. doi: 10.1016/j.cell.2016.03.007. [DOI] [PMC free article] [PubMed] [Google Scholar]
- 12.Licatalosi DD, et al. HITS-CLIP yields genome-wide insights into brain alternative RNA processing. Nature. 2008;456(7221):464–469. doi: 10.1038/nature07488. [DOI] [PMC free article] [PubMed] [Google Scholar]
- 13.König J, et al. iCLIP reveals the function of hnRNP particles in splicing at individual nucleotide resolution. Nat Struct Mol Biol. 2010;17(7):909–915. doi: 10.1038/nsmb.1838. [DOI] [PMC free article] [PubMed] [Google Scholar]
- 14.Zhao J, et al. Genome-wide identification of polycomb-associated RNAs by RIP-seq. Mol Cell. 2010;40(6):939–953. doi: 10.1016/j.molcel.2010.12.011. [DOI] [PMC free article] [PubMed] [Google Scholar]
- 15.Friedersdorf MB, Keene JD. Advancing the functional utility of PAR-CLIP by quantifying background binding to mRNAs and lncRNAs. Genome Biol. 2014;15(1):R2. doi: 10.1186/gb-2014-15-1-r2. [DOI] [PMC free article] [PubMed] [Google Scholar]
- 16.Lapointe CP, Wilinski D, Saunders HAJ, Wickens M. Protein-RNA networks revealed through covalent RNA marks. Nat Methods. 2015;12(12):1163–1170. doi: 10.1038/nmeth.3651. [DOI] [PMC free article] [PubMed] [Google Scholar]
- 17.Miura F, et al. Absolute quantification of the budding yeast transcriptome by means of competitive PCR between genomic and complementary DNAs. BMC Genomics. 2008;9:574. doi: 10.1186/1471-2164-9-574. [DOI] [PMC free article] [PubMed] [Google Scholar]
- 18.Kishore S, et al. A quantitative analysis of CLIP methods for identifying binding sites of RNA-binding proteins. Nat Methods. 2011;8(7):559–564. doi: 10.1038/nmeth.1608. [DOI] [PubMed] [Google Scholar]
- 19.Flynn RA, et al. Dissecting noncoding and pathogen RNA-protein interactomes. RNA. 2015;21(1):135–143. doi: 10.1261/rna.047803.114. [DOI] [PMC free article] [PubMed] [Google Scholar]
- 20.Chen L, et al. Global regulation of mRNA translation and stability in the early Drosophila embryo by the Smaug RNA-binding protein. Genome Biol. 2014;15(1):R4. doi: 10.1186/gb-2014-15-1-r4. [DOI] [PMC free article] [PubMed] [Google Scholar]
- 21.Aviv T, et al. The NMR and X-ray structures of the Saccharomyces cerevisiae Vts1 SAM domain define a surface for the recognition of RNA hairpins. J Mol Biol. 2006;356(2):274–279. doi: 10.1016/j.jmb.2005.11.066. [DOI] [PubMed] [Google Scholar]
- 22.Aviv T, et al. The RNA-binding SAM domain of Smaug defines a new family of post-transcriptional regulators. Nat Struct Biol. 2003;10(8):614–621. doi: 10.1038/nsb956. [DOI] [PubMed] [Google Scholar]
- 23.Hogan DJ, Riordan DP, Gerber AP, Herschlag D, Brown PO. Diverse RNA-binding proteins interact with functionally related sets of RNAs, suggesting an extensive regulatory system. PLoS Biol. 2008;6(10):e255. doi: 10.1371/journal.pbio.0060255. [DOI] [PMC free article] [PubMed] [Google Scholar]
- 24.Rendl LM, Bieman MA, Smibert CA. S. cerevisiae Vts1p induces deadenylation-dependent transcript degradation and interacts with the Ccr4p-Pop2p-Not deadenylase complex. RNA. 2008;14(7):1328–1336. doi: 10.1261/rna.955508. [DOI] [PMC free article] [PubMed] [Google Scholar]
- 25.Rendl LM, Bieman MA, Vari HK, Smibert CA. The eIF4E-binding protein Eap1p functions in Vts1p-mediated transcript decay. PLoS One. 2012;7(10):e47121. doi: 10.1371/journal.pone.0047121. [DOI] [PMC free article] [PubMed] [Google Scholar]
- 26.Riordan DP, Herschlag D, Brown PO. Identification of RNA recognition elements in the Saccharomyces cerevisiae transcriptome. Nucleic Acids Res. 2011;39(4):1501–1509. doi: 10.1093/nar/gkq920. [DOI] [PMC free article] [PubMed] [Google Scholar]
- 27.Oberstrass FC, et al. Shape-specific recognition in the structure of the Vts1p SAM domain with RNA. Nat Struct Mol Biol. 2006;13(2):160–167. doi: 10.1038/nsmb1038. [DOI] [PubMed] [Google Scholar]
- 28.Tome JM, et al. Comprehensive analysis of RNA-protein interactions by high-throughput sequencing-RNA affinity profiling. Nat Methods. 2014;11(6):683–688. doi: 10.1038/nmeth.2970. [DOI] [PMC free article] [PubMed] [Google Scholar]
- 29.Buenrostro JD, et al. Quantitative analysis of RNA-protein interactions on a massively parallel array reveals biophysical and evolutionary landscapes. Nat Biotechnol. 2014;32(6):562–568. doi: 10.1038/nbt.2880. [DOI] [PMC free article] [PubMed] [Google Scholar]
- 30.Greenleaf WJ, Frieda KL, Foster DAN, Woodside MT, Block SM. Direct observation of hierarchical folding in single riboswitch aptamers. Science. 2008;319(5863):630–633. doi: 10.1126/science.1151298. [DOI] [PMC free article] [PubMed] [Google Scholar]
- 31.Ghaemmaghami S, et al. Global analysis of protein expression in yeast. Nature. 2003;425(6959):737–741. doi: 10.1038/nature02046. [DOI] [PubMed] [Google Scholar]
- 32.Kazan H, Ray D, Chan ET, Hughes TR, Morris Q. RNAcontext: A new method for learning the sequence and structure binding preferences of RNA-binding proteins. PLoS Comput Biol. 2010;6(7):e1000832. doi: 10.1371/journal.pcbi.1000832. [DOI] [PMC free article] [PubMed] [Google Scholar]
- 33.Aviv T, Lin Z, Ben-Ari G, Smibert CA, Sicheri F. Sequence-specific recognition of RNA hairpins by the SAM domain of Vts1p. Nat Struct Mol Biol. 2006;13(2):168–176. doi: 10.1038/nsmb1053. [DOI] [PubMed] [Google Scholar]
- 34.Breslow DK, et al. A comprehensive strategy enabling high-resolution functional analysis of the yeast genome. Nat Methods. 2008;5(8):711–718. doi: 10.1038/nmeth.1234. [DOI] [PMC free article] [PubMed] [Google Scholar]
- 35.Doles J, et al. Suppression of Rev3, the catalytic subunit of Polzeta, sensitizes drug-resistant lung tumors to chemotherapy. Proc Natl Acad Sci USA. 2010;107(48):20786–20791. doi: 10.1073/pnas.1011409107. [DOI] [PMC free article] [PubMed] [Google Scholar]
- 36.Carvunis AR, et al. Proto-genes and de novo gene birth. Nature. 2012;487(7407):370–374. doi: 10.1038/nature11184. [DOI] [PMC free article] [PubMed] [Google Scholar]
- 37.Temme C, Simonelig M, Wahle E. Deadenylation of mRNA by the CCR4-NOT complex in Drosophila: Molecular and developmental aspects. Front Genet. 2014;5(May):143. doi: 10.3389/fgene.2014.00143. [DOI] [PMC free article] [PubMed] [Google Scholar]
- 38.Campbell ZT, et al. Cooperativity in RNA-protein interactions: Global analysis of RNA binding specificity. Cell Reports. 2012;1(5):570–581. doi: 10.1016/j.celrep.2012.04.003. [DOI] [PMC free article] [PubMed] [Google Scholar]
- 39.Lambert N, et al. RNA Bind-n-Seq: Quantitative assessment of the sequence and structural binding specificity of RNA binding proteins. Mol Cell. 2014;54(5):887–900. doi: 10.1016/j.molcel.2014.04.016. [DOI] [PMC free article] [PubMed] [Google Scholar]
- 40.Tong AH, et al. Systematic genetic analysis with ordered arrays of yeast deletion mutants. Science. 2001;294(5550):2364–2368. doi: 10.1126/science.1065810. [DOI] [PubMed] [Google Scholar]
- 41.Metzker ML. Sequencing technologies—the next generation. Nat Rev Genet. 2010;11(1):31–46. doi: 10.1038/nrg2626. [DOI] [PubMed] [Google Scholar]
- 42.Nutiu R, et al. Direct measurement of DNA affinity landscapes on a high-throughput sequencing instrument. Nat Biotechnol. 2011;29(7):659–664. doi: 10.1038/nbt.1882. [DOI] [PMC free article] [PubMed] [Google Scholar]
- 43.McKenna A, et al. The Genome Analysis Toolkit: A MapReduce framework for analyzing next-generation DNA sequencing data. Genome Res. 2010;20(9):1297–1303. doi: 10.1101/gr.107524.110. [DOI] [PMC free article] [PubMed] [Google Scholar]
- 44.Quinlan AR, Hall IM. BEDTools: A flexible suite of utilities for comparing genomic features. Bioinformatics. 2010;26(6):841–842. doi: 10.1093/bioinformatics/btq033. [DOI] [PMC free article] [PubMed] [Google Scholar]
- 45.Langmead B, Salzberg SL. Fast gapped-read alignment with Bowtie 2. Nat Methods. 2012;9(4):357–359. doi: 10.1038/nmeth.1923. [DOI] [PMC free article] [PubMed] [Google Scholar]
- 46.Bolger AM, Lohse M, Usadel B. Trimmomatic: A flexible trimmer for Illumina sequence data. Bioinformatics. 2014;30(15):2114–2120. doi: 10.1093/bioinformatics/btu170. [DOI] [PMC free article] [PubMed] [Google Scholar]
- 47.Trapnell C, et al. Differential gene and transcript expression analysis of RNA-seq experiments with TopHat and Cufflinks. Nat Protoc. 2012;7(3):562–578. doi: 10.1038/nprot.2012.016. [DOI] [PMC free article] [PubMed] [Google Scholar]
- 48.Nagalakshmi U, et al. The transcriptional landscape of the yeast genome defined by RNA sequencing. Science. 2008;320(5881):1344–1349. doi: 10.1126/science.1158441. [DOI] [PMC free article] [PubMed] [Google Scholar]
Associated Data
This section collects any data citations, data availability statements, or supplementary materials included in this article.


