Abstract
Pseudohypoxia plays a central role in the progression and therapeutic resistance of clear cell renal cell carcinoma (ccRCC); however, the underlying mechanisms are poorly understood. MicroRNA miR-126 has decreased expression in metastatic or relapsed ccRCC as compared to primary tumors, but the mechanisms by which miR-126 is implicated in RCC remain unknown. Through RNA-seq profiling to evaluate the impact of overexpression or CRISPR knockout of miR-126, we have identified SERPINE1 as a miR-126-5p target regulating cell motility, and SLC7A5 as a miR-126-3p target regulating the mTOR/HIF pathway. Specifically, miR-126 inhibits HIFα protein expression independent of von Hippel-Lindau tumor suppressor (VHL). On the other hand, deactivation of miR-126 induces a pseudohypoxia state due to increased HIFα expression, which further enhances therapeutic resistance and cell motility mediated by SLC7A5 and SERPINE1, respectively. Finally, the clinical relevance of miR-126 modulated gene regulation in ccRCC has been confirmed with profiling data from The Cancer Genome Atlas.
Keywords: microRNA, miR-126, renal cell carcinoma, hypoxia, pseudohypoxia
1. Introduction
Renal cell carcinoma (RCC) accounts for about 90% of kidney cancer. Clear cell RCC (ccRCC) is the most common form, accounting for over 70% of all RCC cases [1]. The majority of sporadic and hereditary ccRCC lacks functional VHL protein (pVHL, or von Hippel-Lindau tumor suppressor), which functions as a ubiquitin E3 ligase targeting hypoxia-inducing factor α (HIF1α/2α) for proteasomal degradation in the presence of oxygen [2, 3]. Besides VHL inactivation, other gene defects have also been demonstrated to be involved in the development of ccRCC, including mutations in MTOR, TSC1, PIK3CA, and PTEN [4], all of which are important components or regulators of the mammalian target of rapamycin (mTOR) pathway. mTOR activation resulting from these defects in ccRCC stimulates the translation of numerous proteins including HIFα. HIFα accumulation, caused by pVHL inactivation and mTOR activation, further facilitates secretion of several growth factors including VEGF and PDGF, which function as upstream activators of mTOR and thus form a positive feedback circuit [5]. Targeted therapy based on mTOR inhibitors and VEGF inhibitors have been recently developed for cancer treatment but their efficacy on kidney cancer is rather modest [6]. Consequently, a deeper understanding of the regulation of the mTOR/HIF pathway in RCC is urgently needed for improving RCC treatment.
MicroRNAs (miRNAs) are small noncoding RNAs that are involved in a variety of cancer-relevant processes such as proliferation, cell cycle control, apoptosis, differentiation, migration and metabolism [7]. miRNA expression changes have been demonstrated in many types of cancer, suggesting their potential values in cancer diagnosis, prognosis and treatment. Up- or down-regulated miRNA expression levels in RCC have been described and reviewed in recent literature [8–10]. Certain key molecules for ccRCC, such as HIFα, VEGF and mTOR, are possible targets of these dysregulated miRNAs. On the other hand, the expression of certain miRNAs can be regulated by these key molecules, especially HIFα. For example, several hypoxia-related miRNAs, such as miR-210, have been demonstrated to be transcriptionally regulated through hypoxia response element (HRE) via HIF1α in various types of cancer [11]. Recently, multiple profiling studies have shown that miR-126, a highly expressed miRNA in vascularized tissues, is downregulated in metastatic versus primary RCC [8, 12–14]. Decreased expression of miR-126 is also observed in the tumors of RCC patients who experienced tumor relapse [15]. However, the details concerning miR-126 involvement in RCC progression remain unknown. In the present study, we have identified SERPINE1 and SLC7A5 as miR-126 targets and demonstrated their implications in metastasis and therapeutic resistance of ccRCC through the mTOR/HIF pathway.
2. Materials and Methods
2.1. Cell culture and reagents
RCC cell lines 786-O, Caki-1 and their exogenous VHL-expressing cells were gifts from Dr. Maria Czyzyk-Krzeska at University of Cincinnati. RCC4 cell lines with or without exogenous VHL expression were provided by Dr. Xin Huang at University of Pittsburgh. HeLa and 293T cells were purchased from ATCC. The cells were cultured with DMEM supplemented with 10% heat inactivated FBS and were grown at 37°C in a hu midified atmosphere (5% CO2). Antibodies used in this study include anti-HIF1α (EMD Millipore 04-1006), anti-HIF2α (Novus NB100-132), anti-phospho-mTOR (Cell Signaling #5536), anti-S6 ribosomal protein (Cell Signaling #2217), anti-phospho-S6 ribosomal protein (Cell Signaling #4857), and anti-β-Actin (Sigma A5441).
2.2. miRNA or siRNA transfection
All siRNAs were designed using our previously published tool, siOligo [16] and purchased from Sigma-Aldrich or Ambion. Synthetic miR-126-3p, miR-126-5p (Ambion), siRNAs and their respective negative controls were transfected with Lipofectamine 2000 (Life Technologies) as previously described [17]. Total RNA was extracted 24 or 48 hours post-transfection using the mirVana RNA Isolation Kit (Life Technologies).
2.3. RNA-seq
High-throughput RNA sequencing (RNA-seq) was performed as previously described [18]. In brief, total RNA was extracted from the cells using the mirVana kit. Ribosomal RNA (rRNA) was then removed from total RNA using the RiboMinus kit (Life Technologies) and custom oligonucleotide probes for rRNAs. Then, the RNA samples were used as template to construct sequencing libraries with the NEBNext mRNA Library Prep kit (New England BioLabs). The cDNA libraries were loaded into HiSeq 2500 (Illumina) for sequencing at the Genome Technology Access Center at Washington University. The raw sequence reads were analyzed using a custom bioinformatics pipeline for clustering before mapping to the RefSeq human transcriptome with Bowtie [19]. Mapped sequence reads were subsequently normalized using the RPKM method (reads per kb per million) for total read count followed by trimmed mean for read composition. Normalized reads across samples were compared to evaluate differences in transcript abundance.
2.4. Quantitative PCR with reverse transcription (qRT-PCR)
Reverse transcription was performed with the High Capacity RT kit (Life Technologies). The PCR primer sequences were retrieved from our online database, PrimerBank [20]. Real-time PCR was performed to validate the expression changes of candidate miRNA targets under various experimental conditions, using the standard PrimerBank protocol as described previously [21]. GAPDH and β-actin were included as internal controls for expression data normalization. Gene expression changes were determined with the ΔΔCt method by comparison with the negative control PCR.
2.5. miR-126 gene knockout by CRISPR/Cas9
sgRNA oligo targeting miR-126 (GGACGGCGCATTATTACTCA) was designed using our recently published tool, WU-CRISPR [22]. sgRNA oligos were annealed and cloned into the BsmBI digestion site of LentiCRISPR V2 vector (AddGene 52961) [23]. The LentiCRISPR Empty vector (without sgRNA), used as negative control, was engineered by end repair with Klenow enzyme after BsmBI digestion. All constructs were confirmed by DNA sequencing. To produce the lentivirus, LentiCRISPR plasmid was co-transfected into HEK293T cells with the packaging plasmids pVSVg (AddGene 8454) and psPAX2 (AddGene 12260). Cells were infected with virus and selected by puromycin (2 μg/ml) for four days. miR-126 gene expression was determined by qRT-PCR for pooled cells or single-cell clones as described previously [24].
2.6. Luciferase reporter assay
The 3′-UTRs of human SERPINE1 and SLC7A5 were amplified by PCR and cloned into XhoI and SbfI restriction enzyme sites of pmirGLO vector (Promega). For luciferase reporter assays, each construct (together with miRNA mimics or siRNA) was transfected into 293T cells with Lipofectamine 2000. Twenty-four hours post transfection, luminescent signal from firefly luciferase was quantified with a microplate reader and normalized by luminescent signal from Renilla luciferase.
2.7. Western blot
Whole cell lysate was prepared with RIPA buffer (Santa Cruz Biotechnology) containing protease inhibitors, PMSF and orthovanadate. Total protein was denatured by heating and separated on SDS-PAGE gel. After transferring to nitrocellulose membrane and blocking with 5% milk in TBS buffer, the protein of interest was immunoplexed with the indicated primary antibody and corresponding secondary antibody. The immunocomplexes were detected by enhanced chemiluminescence (Millipore, P90719) and visualized with a Bio-Rad ChemiDoc imaging system.
2.8. Transwell assay
Cell migration ability was examined by transwell assay using 8.0 μm polycarbonate transwell inserts (Corning) as previously described [18]. Briefly, after one hour hydration of transwell inserts with serum-free medium, the bottom wells were filled with 600 μL medium containing 10% bovine serum. A total of 5×10⁴ cells in 100 μl serum-free medium were plated in the upper inserts and allowed to migrate for five hours. Non-migrated cells were removed with a cotton swab, while cells that had migrated were fixed and stained with Hema-3 (Fisher Scientific) for counting.
2.9. Lactate measurement
For assessment of lactate production, the cells were seeded at 5×10⁴/well in a 24-well plate. After siRNA transfection, the medium was discarded and the cells were washed three times with DPBS. Cells were cultured with serum-free medium for one hour and the medium was then collected for lactate measurement. The amount of lactate present in the medium was determined using the Lactate Assay Kit (BioVision Research Products) according to the manufacturer’s instructions. The amount of lactate produced by the cells in each sample was calculated by subtracting the amount of lactate in the control medium without cells.
2.10. MTS assay
Cells were seeded at 1×10⁴/well in triplicate in a 96-well plate. Various treatments were given 24 hours after cell seeding. Cell viability was measured with the CellTiter 96 AQueous One Solution Cell Proliferation Assay (MTS) kit from Promega (Madison, WI, USA). In brief, 10 μL of MTS substrate was added into each well containing 100 μL of 10% FBS medium. The plate was then incubated for 3 hours, and the absorbance was measured at 490 nm using a microplate reader.
2.11. Retrieval of TCGA data
A total of 537 patients with ccRCC were identified in The Cancer Genome Atlas (TCGA). Normalized RNA-seq data were publicly available for 533 patients and normalized miRNA-seq data were available for 516 patients. All RNA-seq, miRNA-seq, and anonymized clinical patient data files were downloaded through the TCGA data portal (http://tcga-data.nci.nih.gov). All patient survival data was limited to a maximum cutoff of five years.
2.12. Statistical analysis of RNA-seq and miRNA-seq data
Gene Set Enrichment Analysis (GSEA) was performed to identify hallmark gene sets that were differentially expressed [25]. Overall survival analysis was conducted using the ‘survival’ package in the R program (http://www.r-project.org). The p-values for survival outcome were calculated using the logrank test in Cox proportional hazards regression analysis. Statistical significance in differential expression of individual genes or miRNAs was determined using the Student’s t-test. Comparison of the distribution of expression levels was conducted using the Kolmogorov-Smirnov test.
3. Results
3.1. Both miR-126-3p and miR-126-5p are functional miRNAs
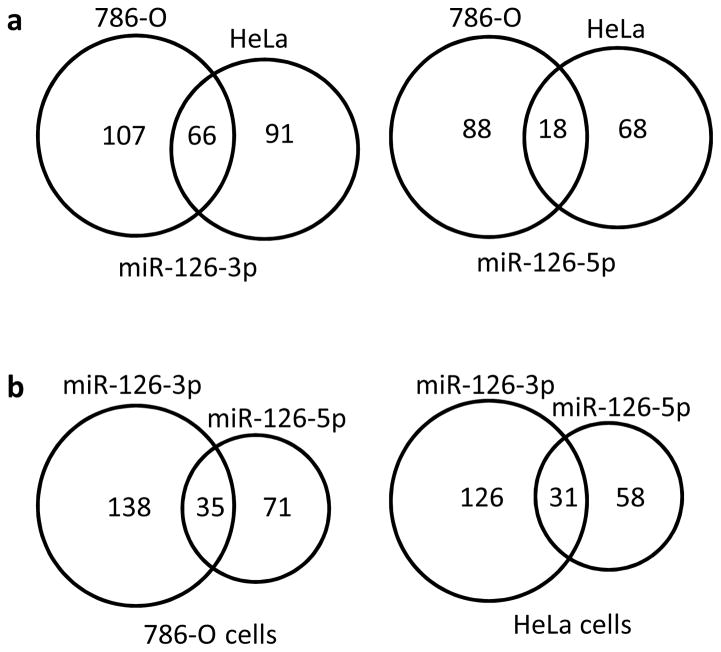
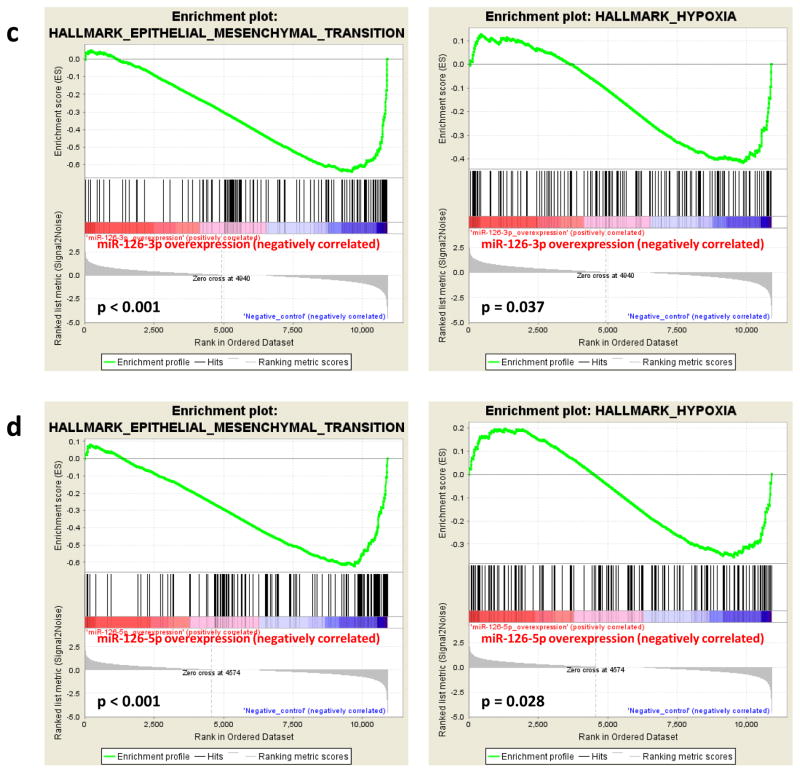
The mature forms of miR-126, including both miR-126-3p and miR-126-5p (miR-126*), are derived from the seventh intron of the EGFL7 gene. Multiple published studies have focused on the physiological significance and disease implications of miR-126-3p, but few explored the functions of miR-126-5p, possibly because of its relatively low abundance in comparison to miR-126-3p. To examine whether miR-126-5p is also a functional miRNA, we individually transfected miR-126-3p and miR-126-5p mimics into 786-O and HeLa cells, respectively, and their impacts on the transcriptome were determined by RNA-seq analysis. Target transcript downregulation by at least 50% was chosen as the cutoff point in our analysis. As shown in Fig. 1a, 66 and 18 genes were downregulated by at least 50% in both 786-O and HeLa cells as a result of overexpression of miR-126-3p and miR-126-5p, respectively. Further, 173 and 106 genes were downregulated in 786-O cells in response to miR-126-3p and miR-126-5p overexpression, respectively, while 35 genes were downregulated by both miRNAs (Fig. 1b). Similarly, 31 genes were identified in HeLa cells that were downregulated by both miRNAs, suggesting that miR-126-3p and miR-126-5p function cooperatively to regulate common gene targets. Interestingly, Gene Set Enrichment Analysis (GSEA) for cells overexpressing miR-126-3p or miR-126-5p indicated that both miR-126-3p and miR-126-5p were negatively associated with hypoxia and epithelial-mesenchymal transition (EMT) pathways in 786-O cells, with p-values ranging from 0.037 to less than 0.001 (Fig. 1c and d). Combined together, our analysis indicated that both miR-126-3p and miR-126-5p are functional miRNAs that work cooperatively for target regulation.
Figure 1.
Both miR-126-3p and miR-126-5p are functional miRNAs. (a, b) Downregulated genes resulting from overexpression of miR-126-3p or miR-126-5p mimics in 786-O or HeLa cells as revealed by RNA-seq. Genes downregulated by at least 50% were included in the analysis. (c, d) GSEA analysis using the datasets of overexpression of miR-126-3p (c) or miR-126-5p (d) in 786-O cells.
3.2. Identification of genes targeted by miR-126-3p and miR-126-5p
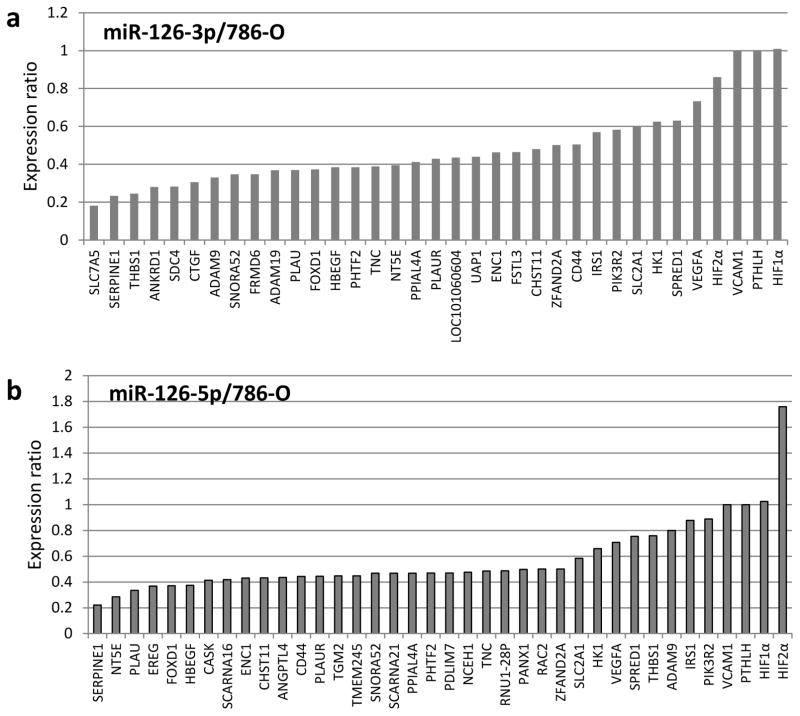
To systematically identify bona fide targets of miR-126-3p and miR-126-5p in RCC cells, we utilized both overexpression and knockout techniques. Specifically, miR-126 was overexpressed or knocked out, and the impact on the transcriptome was evaluated with RNA-seq. CRISPR/Cas9 assays were employed to knock out the miR-126 gene, which resulted in drastic suppression of both miR-126-5p and miR-126-3p expression in various cell lines (Supplementary Fig. S1). Through RNA-seq analysis, we identified 53 genes that were increased in expression by at least 30% in both 786-O and Caki-1 miR-126 knockout cells as compared with CRISPR negative control cells. Among these 53 upregulated genes, nine genes, including SNORA52, ANKRD, THBS1, SERPINE1, FSTL3, FRMD6, UAP1, LOC101060604 and SLC7A5, had significant reduction in expression (>50%) resulting from overexpression of either miR-126-3p or miR-126-5p in 786-O cells (Fig. 2a and b) or HeLa cells (Supplementary Fig. S2a and b). No seed sequences for either miR-126 species were identified in the 3′-UTR regions of SNORA52, ANKRD, THBS1 and LOC101060604, suggesting indirect regulation of these genes by miR-126. SERPINE1, FRMD6 and UAP1 were bioinformatically predicted as miR-126-5p targets, while SLC7A5 was predicted as a miR-126-3p target. The expression of SERPINE1 was most significantly impacted by miR-126 as compared to FRMD6 and UAP1 under both miR-126 overexpression and knockout conditions. SLC7A5 was the only potential target of miR-126-3p as identified in our profiling analysis. Thus, SERPINE1 and SLC7A5 were selected for further functional target validation.
Figure 2.
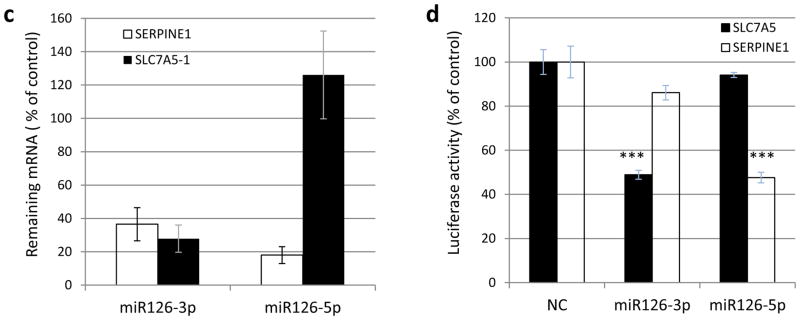
Identification of miR-126-3p or miR-126-5p targets. (a, b) Expression changes as revealed by RNA-seq in response to overexpression of miR-126-3p or miR-126-5p mimics in 786-O cells. Selected genes are presented, including those with decreased expression as well as several genes of interest from the HIF pathway. (c) RT-qPCR validation of SERPINE1 and SLC7A5 downregulation in response to transfection of miR-126-3p or miR-126-5p mimics. (d) Validation of direct binding of miR-126-3p and miR-126-5p with SLC7A5 and SERPINE1 3′-UTRs by luciferase report assay, respectively. The data are represented as the mean ± s.e.m. of triplicates. *** p<0.001 by Student’s t-test.
We next performed real-time PCR to validate the RNA-seq results. Consistent with the RNA-seq data, real-time PCR analysis also showed that miR-126-3p downregulated the expression of both SLC7A5 and SERPINE1 significantly, while miR-126-5p downregulated the expression of SERPINE1 only (Fig. 2c).
The direct targeting of SLC7A5 and SERPINE1 in the 3′-UTR by miR-126-3p or miR-126-5p was further validated by luciferase reporter assay. As shown in Fig. 2d, luciferase activity from the expression plasmid containing SLC7A5 3′-UTR was decreased in cells co-transfected with miR-126-3p, but not miR-126-5p. Similarly, miR-126-5p, but not miR-126-3p, significantly repressed the luciferase activity from the plasmid containing SERPINE1 3′-UTR. These data indicated that SLC7A5 was directly targeted by miR-126-3p, whereas SERPINE1 was directly targeted by miR-126-5p. Interestingly, the expression of SERPINE1 mRNA was downregulated by overexpression of either miR-126-3p or miR-126-5p (Fig. 2c), suggesting additional indirect mechanisms by which miR-126-3p regulates SERPINE1 expression.
3.3. miR-126 deactivation induced a pseudohypoxia state by upregulation of HIFα protein expression independent of VHL protein
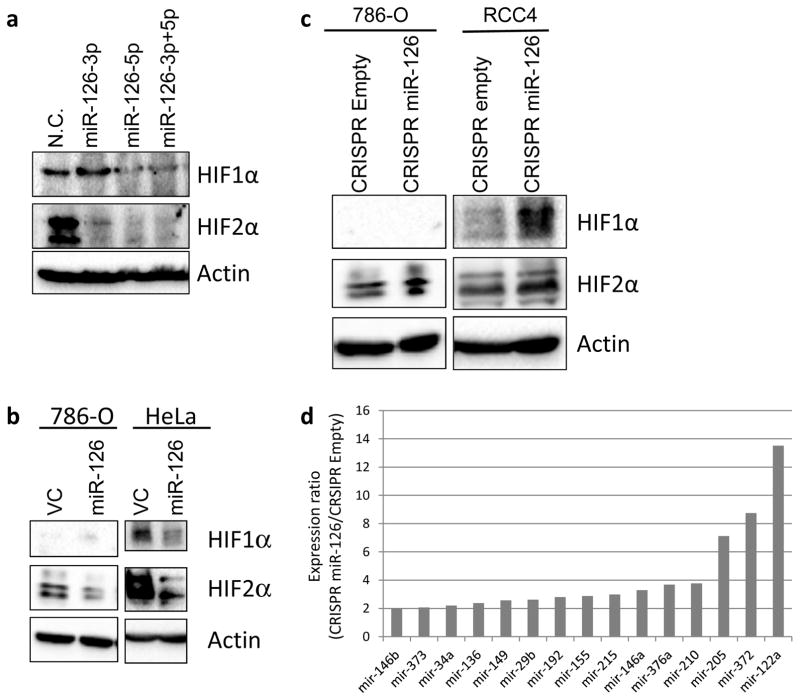
SERPINE1 has been demonstrated as a downstream target of both HIF1α and HIF2α [26]. Besides SERPINE1, our RNA-seq results revealed that other HIFα targets such as CTGF, NT5E, PLAU, PLAUR, HK1 and SLC2A1 [27], were also downregulated by at least 35% in response to overexpression of miR-126-3p or miR-126-5p in both 786-O and HeLa cells (Fig. 2 and Supplementary Fig. S2). Thus, we hypothesized that the HIFα pathway is regulated by miR-126. This hypothesis was further supported by our GSEA analysis, which indicated that both miR-126-3p and miR-126-5p were negatively associated with the hypoxia pathway (Fig. 1c and d). Interestingly, RNA-seq results did not show a significant decrease in mRNA expression of either HIF1α or HIF2α after overexpression of miR-126-3p or miR-126-5p (Fig. 2 and Supplementary Fig. S2), suggesting potential post-translational regulation of HIFα proteins by miR-126. To test this hypothesis, we transfected miR-126-3p and miR-126-5p, individually or in combination, into HeLa cells and determined the protein expression of HIF1α and HIF2α by Western blot. As shown in Fig. 3a, miR-126-5p significantly downregulated the protein expression of both HIF1α and HIF2α, whereas miR-126-3p downregulated the expression of HIF2α only. The inhibitory effect of miR-126 on HIF1α and HIF2α protein expression was further confirmed in 786-O and HeLa cells stably expressing the miR-126 construct (encoding both miR-126-3p and miR-126-5p) (Fig. 3b and Supplementary Fig. S3). More importantly, in cells with miR-126 knockout by CRISPR/Cas9, HIF1α and HIF2α protein levels were increased (Fig. 3c), which further suggested a regulatory role of miR-126 on the HIF pathway.
Figure 3.
miR-126-3p and miR-126-5p regulate HIF1α/2α expression. (a) HIF1α/2α expression was decreased in response to transient overexpression of miR-126-3p or miR-126-5p. (b, c) HIF1α/2α expression changes in stable cell lines with either overexpression (b) or knockout (c) of miR-126. (d) List of the most activated miRNAs in RCC4 cells in response to miR-126 knockout.
Multiple miRNAs including miR-210, miR-373 and miR-155, have been demonstrated to be regulated under HIF1α transcriptional control through hypoxia response element [28, 29]. Given that loss of miR-126 significantly increased HIF1α/2α protein expression, we hypothesized that these HIF1α-induced miRNAs are upregulated in miR-126 knockout cells. To test this hypothesis, we performed miRNA profiling assays in RCC4 cells, in which both HIF1α and HIF2α are expressed. As shown in Fig. 3d, miR-210, miR-155 and miR-373 were among the miRNAs whose expression was increased by over two-fold in miR-126 knockout cells. This result is consistent with the hypothesis that HIF1α is regulated by miR-126.
The expression of HIFα proteins is tightly controlled by von Hippel-Lindau protein (pVHL) in the presence of oxygen [3]. To examine whether pVHL is involved in HIFα regulation by miR-126, we knocked out the miR-126 gene by CRISPR/Cas9 in 786-O cells expressing exogenously introduced VHL. The expression of HIF2α and pVHL proteins was determined by Western blot. miR-126 knockout increased the expression of HIF2α protein (Supplementary Fig. S4), which was consistent with our previous findings (Fig. 3c). HIF1α was not examined here since it is defective in 786-O cells. In contrast, miR-126 knockout did not affect pVHL expression, suggesting that the expression regulation of HIFα proteins by miR-126 was not dependent on VHL protein.
3.4. miR-126 deactivation promoted RCC cell migration through SERPINE1
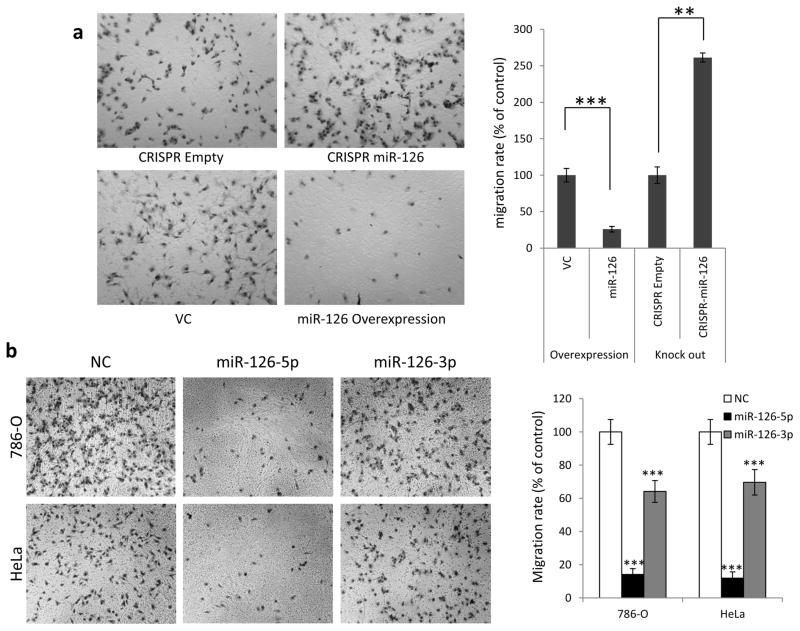
Our GSEA analysis suggested a strong link between miR-126 expression and the EMT pathway (Fig. 1c and d and Supplementary Fig. S5), a key step in tumor metastasis. To further explore how miR-126 is involved in tumor metastasis in RCC, we first evaluated the motility of 786-O cells with altered miR-126 expression by transwell assay. As shown in Fig. 4a, knockout of miR-126 by CRISPR/Cas9 led to significantly increased cell motility compared with negative control cells. Additionally, miR-126 was overexpressed in cells through either stable expression of miR-126 lentiviral construct (Fig. 4a) or transient expression of miR-126-3p or −5p mimics (Fig. 4b). Under both overexpression conditions, cell motility was significantly decreased. These results demonstrate that miR-126 is involved in the regulation of cell migration.
Figure 4.
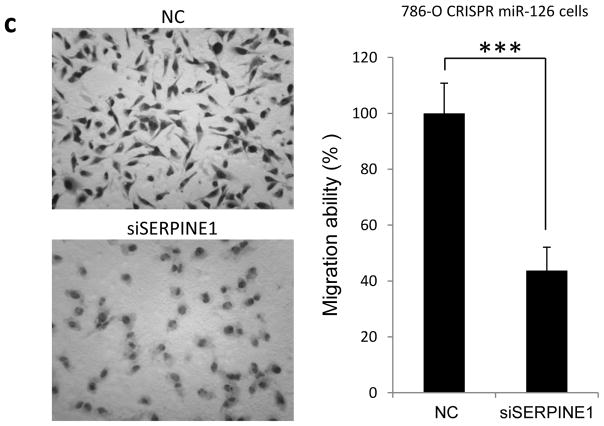
miR-126 regulates cell motility through SERPINE1. (a) 786-O cell migration ability impacted by stable overexpression or knockout of miR-126. (b) miR-126-5p is more potent than miR-126-3p at suppressing the motility of 786-O and HeLa cells. (c) Increased motility of CRISPR miR-126 cells was offset by siRNA against SERPINE1. The data are presented as the mean ± s.e.m. of triplicates. **p<0.01, *** p<0.001 by Student’s t-test.
SERPINE1 has been demonstrated as a promoter of tumor metastasis in various types of tumor [30, 31]. Since SERPINE1 is a direct target of miR-126-5p, we tested whether miR-126 regulates tumor cell motility through SERPINE1. siRNA targeting SERPINE1 was transfected into 786-O cells with miR-126 knockout, and the migration ability of the cells was measured by transwell assay. As shown in Fig. 4c, siRNA against SERPINE1 significantly decreased the migration ability of miR-126 knockout cells. Taken together, these results suggest that SERPINE1 plays a key role in miR-126 mediated regulation of tumor cell motility.
3.5. miR-126 deactivation led to elevated mTOR activity through SLC7A5
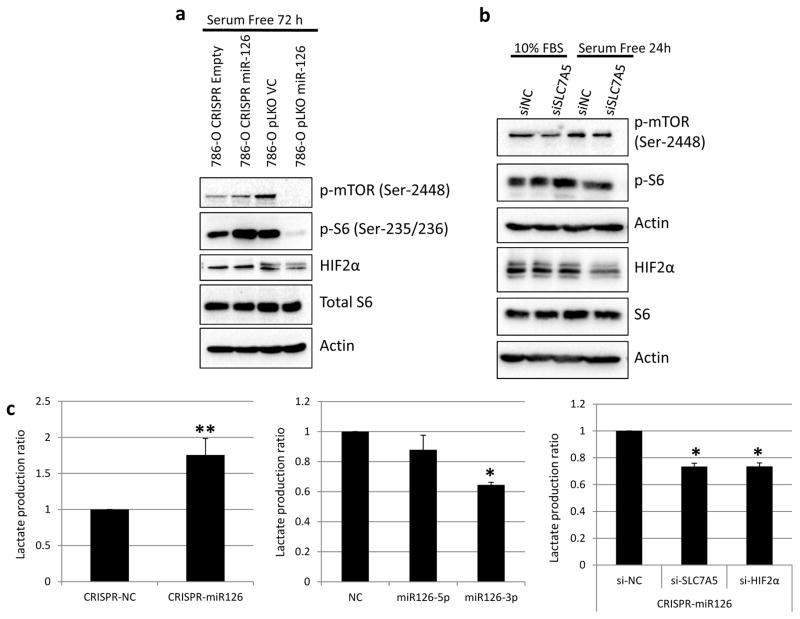
SLC7A5 is an essential component of the transporter for glutamine and leucine, which are avidly consumed by cancer cells [32]. Recently, increased SLC7A5 expression has been associated with elevated mTOR activity in cancer cells [33, 34], as well as the invasive potential and unfavorable prognosis of ccRCC [35]. More interestingly, mTOR activation by HIF2α is mediated by SLC7A5 [36]. Since we have identified SLC7A5 as a miR-126-3p target, we next sought to examine whether the mTOR activity is impacted by miR-126 through SLC7A5. mTOR activity was measured by the expression of phosphorylated mTOR at Ser-2448 as well as its well-established downstream target, S6, phosphorylated at Ser-235/236. When the cells were under stress induced by serum starvation, the mTOR activity was elevated in CRISPR miR-126 cells when compared with CRISPR negative control cells (Fig. 5a). In contrast, the mTOR activity was decreased drastically in 786-O cells overexpressing miR-126 as compared to the vector control cells. HIF2α, a downstream target of mTOR, exhibited changes consistent with the mTOR activity (Fig. 5a).
Figure 5.
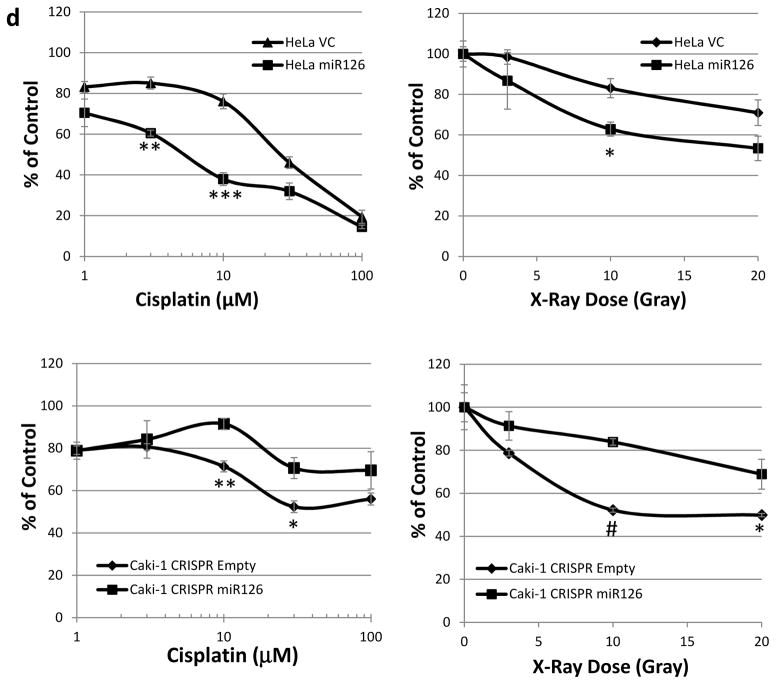
miR-126 regulates the mTOR activity and therapeutic sensitivity of cancer cells to cisplatin or radiation treatment. (a) The mTOR activity impacted by overexpression or knockout of miR-126 under serum starvation condition. (b) SLC7A5 is involved in miR-126 regulation of the mTOR activity. (c) miR-126 regulates lactate production through SLC7A5 and HIFα. (d) Overexpression of miR-126 sensitized HeLa cells to cisplatin and radiation treatment. Knockout of miR-126 induced resistance to cisplatin and radiation treatment in Caki-1 cells. The data are represented as the mean ± s.e.m. of triplicates. *p<0.05, **p<0.01, ***p<0.001, #p<1×10⁻⁴ by Student’s t-test.
To elucidate whether miR-126 regulates the mTOR activity through SLC7A5, we examined the cells with suppressed SLC7A5 expression by siRNA knockdown. As shown in Fig. 5b, the mTOR activity was decreased in cells transfected with siRNA against SLC7A5. Downstream targets of mTOR, including p-S6 and HIF2α, exhibited significant downregulation only under serum starvation condition, but not under normal culture condition. This suggests that regulation of the mTOR activity by SLC7A5 is impaired by serum stimulation. Combined together, these results indicated that SLC7A5 is involved in miR-126 mediated regulation of the mTOR activity.
Elevated mTOR activity leads to increased lactate production through glycolysis in RCC cells [37]. Thus, we next examined the impact of miR-126 expression changes on lactate production. In the 786-O cells with miR-126 knockout, the lactate production was increased by about 1.7 fold as compared to negative control cells (Fig. 5c). To further clarify the role of miR-126-3p and miR-126-5p in lactate production, we transfected the miRNA mimics individually in HeLa cells. As shown in Fig. 5c, miR-126-3p significantly suppressed lactate production as compared to the negative control. Given that miR-126-3p regulates the expression of SLC7A5 and HIF2α, which induce lactate production, we next sought to explore whether miR-126-3p regulates lactate production through SLC7A5 or HIF2α. SLC7A5 and HIF2α were knocked down individually by siRNA in 786-O CRISPR miR-126 cells. Lactate production was inhibited by about 30% under both conditions (Fig. 5c). Taken together, these data suggest that miR-126-3p regulates the mTOR activity and lactate production through direct targeting of SLC7A5 as well as indirect modulation of HIF2α expression.
3.6. miR-126 deactivation resulted in resistance to radiation or chemotherapy
Renal cell carcinoma (RCC), especially metastatic RCC, is notorious for its resistance to conventional chemotherapy and radiotherapy [38]. Activated hypoxia signaling and elevated mTOR activity are believed to be important factors contributing to the intrinsic resistance of RCC to conventional treatments [39, 40]. Given that miR-126 loss stimulates hypoxia signaling and increases mTOR activity in RCC, we hypothesized that miR-126 plays a critical role in the therapeutic resistance of RCC. To this end, we compared the cell sensitivity to cisplatin and X-ray radiation when miR-126 was overexpressed or knocked out. As shown in Fig. 5d, overexpression of miR-126 significantly sensitized the cancer cells to cisplatin or X-ray treatment as compared to control cells. On the other hand, miR-126 deactivation by CRISPR/Cas9 knockout resulted in resistance to cisplatin or X-ray treatment of the cancer cells.
3.7. miR-126-3p and miR-126-5p were significantly associated with overall survival and metastasis in RCC
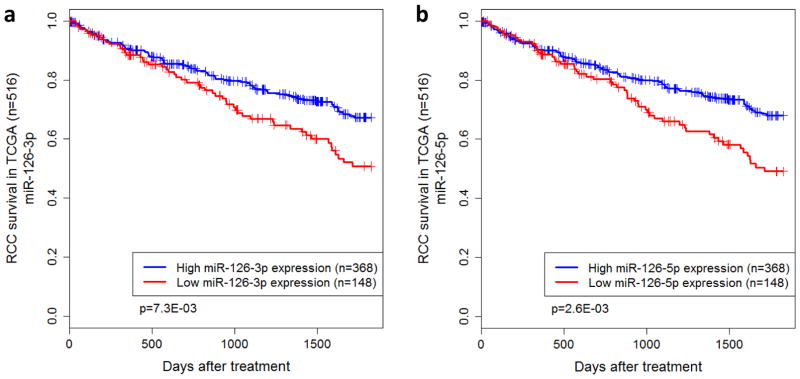
To investigate the clinical significance of miR-126 in RCC, expression profiling data from The Cancer Genome Atlas (TCGA) were analyzed. Specifically, the expression profiles of both miR-126-3p and miR-126-5p were correlated to patient survival outcomes. Of the 516 RCC patients from TCGA, 148 were reported as deceased by the end of five year follow-up. Kaplan-Meier survival analysis indicated that overall survival was significantly associated with both miR-126-3p (p=2.5E-04) and miR-126-5p (p=1.9E-03). Both miRNAs were found to be under-expressed in the deceased cohort. Based on the proportion of deceased patients, the patients were assigned to groups of high or low expression for miR-126-3p and miR-126-5p, respectively. For each miRNA, the two populations had significantly different survival outcomes (p=7.3E-03 for miR-126-3p, p=2.6E-03 for miR-126-5p) (Fig. 6a and b).
Figure 6.
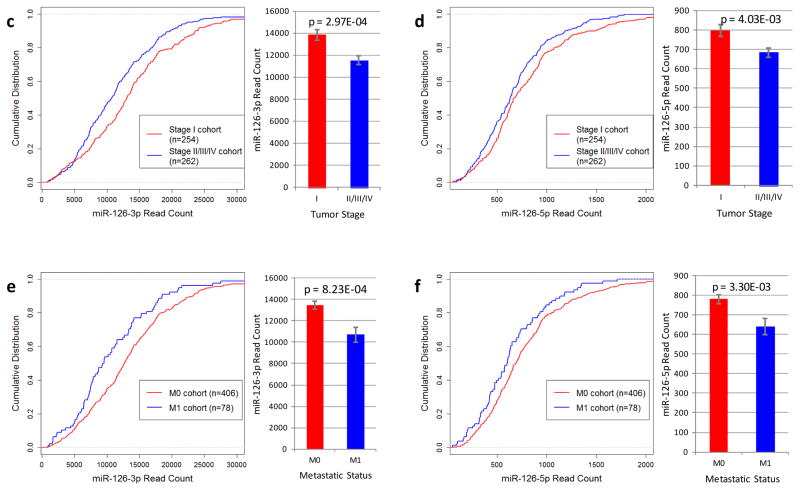
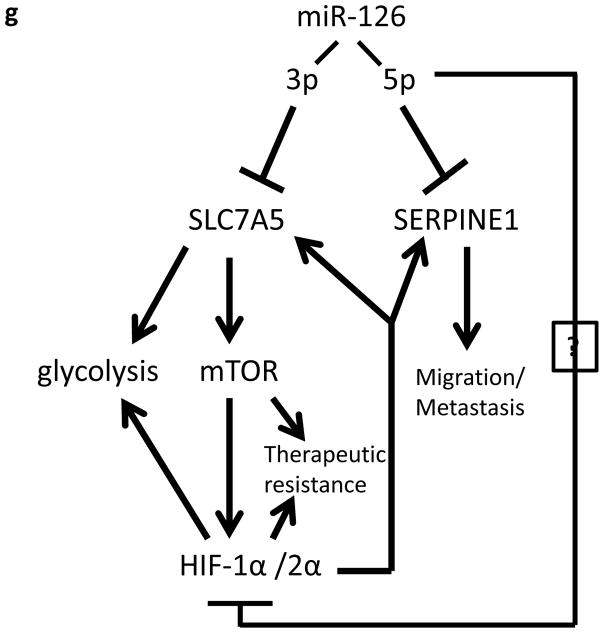
TCGA data analysis indicates that miR-126 is significantly associated with clinical outcomes in RCC. (a, b) Kaplan-Meier survival analysis of patients stratified by miR-126 expression. Statistical significance was determined using the logrank test. (c, d) Low tumor stage at diagnosis is associated with higher expression of both miR-126-3p and miR-126-5p. Statistical significance was determined using the Student’s t-test. (e, f) Tumors that did not metastasize express higher levels of miR-126-3p and miR-126-5p as compared to the tumors that metastasized. (g) A proposed model for miR-126 involvement in ccRCC.
The expression levels of miR-126-3p and miR-126-5p were also correlated with additional clinical features. Overall, low miR-126 expression was correlated with poor clinical stages. Specifically, significant differences were observed when comparing the expression of both miR-126-3p and miR-126-5p between patients who presented with Stage I tumors versus advanced stage tumors (p=2.97E-04 for miR-126-3p and p=4.0E-03 for miR-126-5p, respectively) (Fig. 6c and d). In addition, patients who presented with metastatic tumors (M1) had lower miR-126 expression (p = 8.2E-03 for miR-126-3p and p=3.3E-03 for miR-126-5p, respectively) (Fig. 6e and f) and higher SLC7A5 and SERPINE1 expression (Supplementary Fig. S6) as compared to those with primary RCC only (M0).
4. Discussion
Pseudohypoxia, triggered by HIFα up-regulation in the presence of oxygen, plays a central role in promoting both tumor progression and therapeutic resistance [39, 41]. Pseudohypoxia in tumor cells is mainly induced by accelerated mTOR-dependent translation of HIFα protein and/or impaired degradation of HIFα protein [42]. Specifically in ccRCC cells, multiple genes controlling these two pathways, such as TSC1, TSC2, PTEN and VHL, are frequently mutated. These gene defects can lead to activation of HIFα, which contributes greatly to two well-known phenotypes of ccRCC: highly vascularized tumors and drastic increase in fatty acid synthesis [43].
In the present study, we demonstrated a novel mechanism by which miR-126 regulates the mTOR/HIF pathway in ccRCC. miR-126-3p deactivation results in increased expression of SLC7A5, which in turn leads to elevated mTOR activity and HIFα protein expression. Meanwhile, miR-126-5p deactivation stimulates HIFα expression at the protein level through currently unknown mechanisms. Interestingly, the two targets of miR-126-3p and miR-126-5p, SLC7A5 and SERPINE1, have also been demonstrated as downstream targets of HIFα proteins. Thus, a positive feedback circuit between miR-126 deactivation, increased expression of SLC7A5 and SEPRINE1, and activated mTOR/HIFα signaling may promote metastasis and therapeutic resistance in ccRCCs that have decreased expression of miR-126 (Fig. 6g). Moreover, the clinical relevance of miR-126 modulated pathway has further been confirmed by analysis of TCGA profiling data.
Given that pseudohypoxia is an important mechanism contributing to the therapeutic resistance of RCC, HIFα suppression is a potential strategy for overcoming this treatment barrier [44]. Based on our findings, miR-126 could be considered as a promising therapeutic agent to suppress HIFα activity. Indeed, overexpression of miR-126 sensitized cancer cells to both chemotherapy and radiotherapy in our study. Moreover, our results also demonstrated that miR-126 could significantly suppress the EMT pathway by targeting SERPINE1, leading to potential improvement in treating metastatic RCC. Thus, miR-126 could serve as a potent multi-targeting agent for the treatment of RCC.
Supplementary Material
Highlights.
By targeting SLC7A5 and SERPINE1, miR-126 plays a major role in regulation of the mTOR/HIF pathway in ccRCC.
Dysregulated mTOR/HIF caused by miR-126 deactivation in ccRCC induces pseudohypoxia, which leads to therapeutic resistance and increased tumor cell motility.
Low miR-126 expression is significantly associated with overall survival and metastasis in ccRCC.
Acknowledgments
We are grateful to Drs. Maria Czyzyk-Krzeska at University of Cincinnati and Xin Huang at University of Pittsburgh for providing RCC cell lines. We thank Drs. Kareem Azab and Qing Yang at Washington University in St. Louis for sharing antibodies. This research was supported by the National Institutes of Health (grant R01GM089784).
Footnotes
Publisher's Disclaimer: This is a PDF file of an unedited manuscript that has been accepted for publication. As a service to our customers we are providing this early version of the manuscript. The manuscript will undergo copyediting, typesetting, and review of the resulting proof before it is published in its final citable form. Please note that during the production process errors may be discovered which could affect the content, and all legal disclaimers that apply to the journal pertain.
References
- 1.Lopez-Beltran A, Carrasco JC, Cheng L, Scarpelli M, Kirkali Z, Montironi R. 2009 update on the classification of renal epithelial tumors in adults. Int J Urol. 2009;16:432–443. doi: 10.1111/j.1442-2042.2009.02302.x. [DOI] [PubMed] [Google Scholar]
- 2.Ivan M, Kondo K, Yang H, Kim W, Valiando J, Ohh M, Salic A, Asara JM, Lane WS, Kaelin WG. HIFalpha targeted for VHL-mediated destruction by proline hydroxylation: implications for O2 sensing. Science. 2001;292:464–468. doi: 10.1126/science.1059817. [DOI] [PubMed] [Google Scholar]
- 3.Hu D, Liu W, Wu G, Wan Y. Nuclear translocation of Skp2 facilitates its destruction in response to TGF beta signaling. Cell Cycle. 2011;10:285–292. doi: 10.4161/cc.10.2.14517. [DOI] [PMC free article] [PubMed] [Google Scholar]
- 4.Kim S, Yu H. Mutual regulation between the spindle checkpoint and APC/C. Semin Cell Dev Biol. 2011;22:551–558. doi: 10.1016/j.semcdb.2011.03.008. [DOI] [PMC free article] [PubMed] [Google Scholar]
- 5.Mondal G, Sengupta S, Panda CK, Gollin SM, Saunders WS, Roychoudhury S. Overexpression of Cdc20 leads to impairment of the spindle assembly checkpoint and aneuploidization in oral cancer. Carcinogenesis. 2007;28:81–92. doi: 10.1093/carcin/bgl100. [DOI] [PubMed] [Google Scholar]
- 6.Nilsson J, Yekezare M, Minshull J, Pines J. The APC/C maintains the spindle assembly checkpoint by targeting Cdc20 for destruction. Nat Cell Biol. 2008;10:1411–1420. doi: 10.1038/ncb1799. [DOI] [PMC free article] [PubMed] [Google Scholar]
- 7.Jansson MD, Lund AH. MicroRNA and cancer. Mol Oncol. 2012;6:590–610. doi: 10.1016/j.molonc.2012.09.006. [DOI] [PMC free article] [PubMed] [Google Scholar]
- 8.Khella HW, Scorilas A, Mozes R, Mirham L, Lianidou E, Krylov SN, Lee JY, Ordon M, Stewart R, Jewett MA, Yousef GM. Low expression of miR-126 is a prognostic marker for metastatic clear cell renal cell carcinoma. Am J Pathol. 2015;185:693–703. doi: 10.1016/j.ajpath.2014.11.017. [DOI] [PubMed] [Google Scholar]
- 9.Ebrahimi F, Gopalan V, Smith RA, Lam AK. miR-126 in human cancers: clinical roles and current perspectives. Exp Mol Pathol. 2014;96:98–107. doi: 10.1016/j.yexmp.2013.12.004. [DOI] [PubMed] [Google Scholar]
- 10.Gu L, Li H, Chen L, Ma X, Gao Y, Li X, Zhang Y, Fan Y, Zhang X. MicroRNAs as prognostic molecular signatures in renal cell carcinoma: a systematic review and meta-analysis. Oncotarget. 2015;6:32545–32560. doi: 10.18632/oncotarget.5324. [DOI] [PMC free article] [PubMed] [Google Scholar]
- 11.Huang X, Ding L, Bennewith KL, Tong RT, Welford SM, Ang KK, Story M, Le QT, Giaccia AJ. Hypoxia-inducible mir-210 regulates normoxic gene expression involved in tumor initiation. Mol Cell. 2009;35:856–867. doi: 10.1016/j.molcel.2009.09.006. [DOI] [PMC free article] [PubMed] [Google Scholar]
- 12.White NM, Khella HW, Grigull J, Adzovic S, Youssef YM, Honey RJ, Stewart R, Pace KT, Bjarnason GA, Jewett MA, Evans AJ, Gabril M, Yousef GM. miRNA profiling in metastatic renal cell carcinoma reveals a tumour-suppressor effect for miR-215. Br J Cancer. 2011;105:1741–1749. doi: 10.1038/bjc.2011.401. [DOI] [PMC free article] [PubMed] [Google Scholar]
- 13.Khella HW, White NM, Faragalla H, Gabril M, Boazak M, Dorian D, Khalil B, Antonios H, Bao TT, Pasic MD, Honey RJ, Stewart R, Pace KT, Bjarnason GA, Jewett MA, Yousef GM. Exploring the role of miRNAs in renal cell carcinoma progression and metastasis through bioinformatic and experimental analyses. Tumour Biol. 2012;33:131–140. doi: 10.1007/s13277-011-0255-5. [DOI] [PubMed] [Google Scholar]
- 14.Heinzelmann J, Unrein A, Wickmann U, Baumgart S, Stapf M, Szendroi A, Grimm MO, Gajda MR, Wunderlich H, Junker K. MicroRNAs with prognostic potential for metastasis in clear cell renal cell carcinoma: a comparison of primary tumors and distant metastases. Ann Surg Oncol. 2014;21:1046–1054. doi: 10.1245/s10434-013-3361-3. [DOI] [PubMed] [Google Scholar]
- 15.Slaby O, Redova M, Poprach A, Nekvindova J, Iliev R, Radova L, Lakomy R, Svoboda M, Vyzula R. Identification of MicroRNAs associated with early relapse after nephrectomy in renal cell carcinoma patients. Genes Chromosomes Cancer. 2012;51:707–716. doi: 10.1002/gcc.21957. [DOI] [PubMed] [Google Scholar]
- 16.Wang X, Wang X, Varma RK, Beauchamp L, Magdaleno S, Sendera TJ. Selection of hyperfunctional siRNAs with improved potency and specificity. Nucleic acids research. 2009;37:e152. doi: 10.1093/nar/gkp864. [DOI] [PMC free article] [PubMed] [Google Scholar]
- 17.Jiang Z, Liu W, Wang Y, Gao Z, Gao G, Wang X. Rational design of microRNA-siRNA chimeras for multifunctional target suppression. RNA (New York, NY) 2013;19:1745–1754. doi: 10.1261/rna.039677.113. [DOI] [PMC free article] [PubMed] [Google Scholar]
- 18.Liu W, Gao G, Hu X, Wang Y, Schwarz JK, Chen JJ, Grigsby PW, Wang X. Activation of miR-9 by human papillomavirus in cervical cancer. Oncotarget. 2014;5:11620–11630. doi: 10.18632/oncotarget.2599. [DOI] [PMC free article] [PubMed] [Google Scholar]
- 19.Langmead B, Trapnell C, Pop M, Salzberg SL. Ultrafast and memory-efficient alignment of short DNA sequences to the human genome. Genome biology. 2009;10:R25. doi: 10.1186/gb-2009-10-3-r25. [DOI] [PMC free article] [PubMed] [Google Scholar]
- 20.Wang X, Spandidos A, Wang H, Seed B. PrimerBank: a PCR primer database for quantitative gene expression analysis, 2012 update. Nucleic acids research. 2012;40:D1144–1149. doi: 10.1093/nar/gkr1013. [DOI] [PMC free article] [PubMed] [Google Scholar]
- 21.Wang X, Seed B. A PCR primer bank for quantitative gene expression analysis. Nucleic acids research. 2003;31:e154. doi: 10.1093/nar/gng154. [DOI] [PMC free article] [PubMed] [Google Scholar]
- 22.Wong N, Liu W, Wang X. WU-CRISPR: characteristics of functional guide RNAs for the CRISPR/Cas9 system. Genome Biol. 2015;16 doi: 10.1186/s13059-015-0784-0. [DOI] [PMC free article] [PubMed] [Google Scholar]
- 23.Sanjana NE, Shalem O, Zhang F. Improved vectors and genome-wide libraries for CRISPR screening. Nat Methods. 2014;11:783–784. doi: 10.1038/nmeth.3047. [DOI] [PMC free article] [PubMed] [Google Scholar]
- 24.Wang X. A PCR-based platform for microRNA expression profiling studies. RNA. 2009;15:716–723. doi: 10.1261/rna.1460509. [DOI] [PMC free article] [PubMed] [Google Scholar]
- 25.Subramanian A, Tamayo P, Mootha VK, Mukherjee S, Ebert BL, Gillette MA, Paulovich A, Pomeroy SL, Golub TR, Lander ES, Mesirov JP. Gene set enrichment analysis: a knowledge-based approach for interpreting genome-wide expression profiles. Proc Natl Acad Sci U S A. 2005;102:15545–15550. doi: 10.1073/pnas.0506580102. [DOI] [PMC free article] [PubMed] [Google Scholar]
- 26.Kietzmann T, Roth U, Jungermann K. Induction of the plasminogen activator inhibitor-1 gene expression by mild hypoxia via a hypoxia response element binding the hypoxia-inducible factor-1 in rat hepatocytes. Blood. 1999;94:4177–4185. [PubMed] [Google Scholar]
- 27.Benita Y, Kikuchi H, Smith AD, Zhang MQ, Chung DC, Xavier RJ. An integrative genomics approach identifies Hypoxia Inducible Factor-1 (HIF-1)-target genes that form the core response to hypoxia. Nucleic Acids Res. 2009;37:4587–4602. doi: 10.1093/nar/gkp425. [DOI] [PMC free article] [PubMed] [Google Scholar]
- 28.Nallamshetty S, Chan SY, Loscalzo J. Hypoxia: a master regulator of microRNA biogenesis and activity. Free Radic Biol Med. 2013;64:20–30. doi: 10.1016/j.freeradbiomed.2013.05.022. [DOI] [PMC free article] [PubMed] [Google Scholar]
- 29.Loscalzo J. The cellular response to hypoxia: tuning the system with microRNAs. J Clin Invest. 2010;120:3815–3817. doi: 10.1172/JCI45105. [DOI] [PMC free article] [PubMed] [Google Scholar]
- 30.de Fraipont F, Nicholson AC, Feige JJ, Van Meir EG. Thrombospondins and tumor angiogenesis. Trends Mol Med. 2001;7:401–407. doi: 10.1016/s1471-4914(01)02102-5. [DOI] [PubMed] [Google Scholar]
- 31.Lawler J. Thrombospondin-1 as an endogenous inhibitor of angiogenesis and tumor growth. J Cell Mol Med. 2002;6:1–12. doi: 10.1111/j.1582-4934.2002.tb00307.x. [DOI] [PMC free article] [PubMed] [Google Scholar]
- 32.Fuchs BC, Bode BP. Amino acid transporters ASCT2 and LAT1 in cancer: partners in crime? Semin Cancer Biol. 2005;15:254–266. doi: 10.1016/j.semcancer.2005.04.005. [DOI] [PubMed] [Google Scholar]
- 33.Chen R, Zou Y, Mao D, Sun D, Gao G, Shi J, Liu X, Zhu C, Yang M, Ye W, Hao Q, Li R, Yu L. The general amino acid control pathway regulates mTOR and autophagy during serum/glutamine starvation. J Cell Biol. 2014;206:173–182. doi: 10.1083/jcb.201403009. [DOI] [PMC free article] [PubMed] [Google Scholar]
- 34.Nicklin P, Bergman P, Zhang B, Triantafellow E, Wang H, Nyfeler B, Yang H, Hild M, Kung C, Wilson C, Myer VE, MacKeigan JP, Porter JA, Wang YK, Cantley LC, Finan PM, Murphy LO. Bidirectional transport of amino acids regulates mTOR and autophagy. Cell. 2009;136:521–534. doi: 10.1016/j.cell.2008.11.044. [DOI] [PMC free article] [PubMed] [Google Scholar]
- 35.Betsunoh H, Fukuda T, Anzai N, Nishihara D, Mizuno T, Yuki H, Masuda A, Yamaguchi Y, Abe H, Yashi M, Fukabori Y, Yoshida K, Kamai T. Increased expression of system large amino acid transporter (LAT)-1 mRNA is associated with invasive potential and unfavorable prognosis of human clear cell renal cell carcinoma. BMC Cancer. 2013;13:509. doi: 10.1186/1471-2407-13-509. [DOI] [PMC free article] [PubMed] [Google Scholar]
- 36.Elorza A, Soro-Arnáiz I, Meléndez-Rodríguez F, Rodríguez-Vaello V, Marsboom G, de Cárcer G, Acosta-Iborra B, Albacete-Albacete L, Ordóñez A, Serrano-Oviedo L, Giménez-Bachs JM, Vara-Vega A, Salinas A, Sánchez-Prieto R, Martín del Río R, Sánchez-Madrid F, Malumbres M, Landázuri MO, Aragonés J. HIF2α acts as an mTORC1 activator through the amino acid carrier SLC7A5. Mol Cell. 2012;48:681–691. doi: 10.1016/j.molcel.2012.09.017. [DOI] [PubMed] [Google Scholar]
- 37.Massari F, Ciccarese C, Santoni M, Brunelli M, Piva F, Modena A, Bimbatti D, Fantinel E, Santini D, Cheng L, Cascinu S, Montironi R, Tortora G. Metabolic alterations in renal cell carcinoma. Cancer Treat Rev. 2015 doi: 10.1016/j.ctrv.2015.07.002. [DOI] [PubMed] [Google Scholar]
- 38.George CM, Stadler WM. The role of systemic chemotherapy in the treatment of kidney cancer. Cancer Treat Res. 2003;116:173–182. doi: 10.1007/978-1-4615-0451-1_10. [DOI] [PubMed] [Google Scholar]
- 39.Rini BI, Atkins MB. Resistance to targeted therapy in renal-cell carcinoma. Lancet Oncol. 2009;10:992–1000. doi: 10.1016/S1470-2045(09)70240-2. [DOI] [PubMed] [Google Scholar]
- 40.Rini BI. New strategies in kidney cancer: therapeutic advances through understanding the molecular basis of response and resistance. Clin Cancer Res. 2010;16:1348–1354. doi: 10.1158/1078-0432.CCR-09-2273. [DOI] [PubMed] [Google Scholar]
- 41.Buczek M, Escudier B, Bartnik E, Szczylik C, Czarnecka A. Resistance to tyrosine kinase inhibitors in clear cell renal cell carcinoma: from the patient’s bed to molecular mechanisms. Biochim Biophys Acta. 2014;1845:31–41. doi: 10.1016/j.bbcan.2013.10.001. [DOI] [PubMed] [Google Scholar]
- 42.King A, Selak MA, Gottlieb E. Succinate dehydrogenase and fumarate hydratase: linking mitochondrial dysfunction and cancer. Oncogene. 2006;25:4675–4682. doi: 10.1038/sj.onc.1209594. [DOI] [PubMed] [Google Scholar]
- 43.Frew IJ, Moch H. A clearer view of the molecular complexity of clear cell renal cell carcinoma. Annu Rev Pathol. 2015;10:263–289. doi: 10.1146/annurev-pathol-012414-040306. [DOI] [PubMed] [Google Scholar]
- 44.Semenza GL. Targeting HIF-1 for cancer therapy. Nat Rev Cancer. 2003;3:721–732. doi: 10.1038/nrc1187. [DOI] [PubMed] [Google Scholar]
Associated Data
This section collects any data citations, data availability statements, or supplementary materials included in this article.


