Primary forest clearing as a share of gross disturbance in Brazilian Legal Amazon changed from 67% in 2001 to 47% in 2013.
Keywords: Brazil, Amazon, deforestation, forest loss, Forest Monitoring, carbon dynamics, remote sensing, sampling
Abstract
Deforestation rates in primary humid tropical forests of the Brazilian Legal Amazon (BLA) have declined significantly since the early 2000s. Brazil’s national forest monitoring system provides extensive information for the BLA but lacks independent validation and systematic coverage outside of primary forests. We use a sample-based approach to consistently quantify 2000–2013 tree cover loss in all forest types of the region and characterize the types of forest disturbance. Our results provide unbiased forest loss area estimates, which confirm the reduction of primary forest clearing (deforestation) documented by official maps. By the end of the study period, nonprimary forest clearing, together with primary forest degradation within the BLA, became comparable in area to deforestation, accounting for an estimated 53% of gross tree cover loss area and 26 to 35% of gross aboveground carbon loss. The main type of tree cover loss in all forest types was agroindustrial clearing for pasture (63% of total loss area), followed by small-scale forest clearing (12%) and agroindustrial clearing for cropland (9%), with natural woodlands being directly converted into croplands more often than primary forests. Fire accounted for 9% of the 2000–2013 primary forest disturbance area, with peak disturbances corresponding to droughts in 2005, 2007, and 2010. The rate of selective logging exploitation remained constant throughout the study period, contributing to forest fire vulnerability and degradation pressures. As the forest land use transition advances within the BLA, comprehensive tracking of forest transitions beyond primary forest loss is required to achieve accurate carbon accounting and other monitoring objectives.
INTRODUCTION
Rates of deforestation in Brazil significantly slowed after 2004 according to the Brazilian national satellite–based deforestation monitoring system PRODES (www.obt.inpe.br/prodes) (1). The major underlying cause of deforestation has been beef and soybean production in response to growing global and national demands (2, 3). Deforestation in the region in the early 2000s was reported to be predominantly due to pasture expansion (4), with increasing forest-to-cropland conversion in Mato Grosso (5). Success in slowing deforestation is attributed to a number of factors, including declining commodity prices, the role of government policies and implementation, civil society activism, and private industry engagement (6–8). Despite the recent deforestation reduction, Brazil remains the single largest contributor to natural forest loss among tropical countries (9). Extant demands for commodities sourced through tropical deforestation will test the ability of Brazil to achieve further reductions in forest loss.
The PRODES (1) data set and a global forest loss map from the University of Maryland (UMD) (10) agree on the general decreasing deforestation trend in Brazil for the past decade but disagree in terms of the absolute forest cover loss rates, presumably due to differences in methodology. Although PRODES quantifies large-scale deforestation of disturbed and undisturbed primary forest, other forest change dynamics (including secondary forest clearing, logging, and fire) are omitted. Conversely, the UMD map quantifies any tree cover loss, including forest plantation rotations, fire, logging, and natural disturbances. PRODES ignores all changes outside of the old-growth forests of the dense humid tropical forest biome, whereas the UMD product maps all tree cover dynamics, including secondary forest and dry tropical woodland clearing. Additionally, minimum mapping units of 6.25 and 0.09 ha for PRODES and UMD, respectively, result in product differences.
Most regional- and continental-scale studies on the types of deforestation are based on tabular data sources and modeling (4, 11, 12). Remote sensing data, specifically time series of medium– and high–spatial resolution optical imagery, can be used to attribute types of stand-replacement forest clearing (deforestation), for example, clearing for pasture, cropland, mining, infrastructure, and urban expansion. This has been realized in the form of postdeforestation land-use mapping by the Brazilian systems TerraClass (www.inpe.br/cra/projetos_pesquisas/dados_terraclass.php) and TerraClass Cerrado (www.dpi.inpe.br/tccerrado/) and the nongovernmental land-cover and land-use mapping initiative MapBiomas (http://mapbiomas.org). The use of remotely sensed data in assessing the degree and type of partial canopy loss (forest degradation) has been demonstrated in monitoring wildfires and selective logging (13, 14). Given these demonstrated capabilities, a more comprehensive accounting of forest disturbance dynamics is possible for the Brazilian Amazon.
All wall-to-wall deforestation or postdisturbance land-use maps derived using remotely sensed data contain errors, which results in the biased area estimates derived via map pixel counting (15–17). This study follows good practice recommendations (15–17) to use a probability sample for unbiased area estimation from remotely sensed data. Our study includes the following objectives: (i) produce unbiased estimates of annual forest disturbance rates between 2000 and 2013 for the states of the BLA using a sample-based approach; (ii) characterize the types of forest disturbance and predisturbance forest types; (iii) assess carbon implications of the observed forest loss dynamics; and (iv) compare sample-based estimates with the existing deforestation, forest degradation, and postdeforestation land-use maps.
RESULTS
BLA total tree cover loss
Most tree cover loss in the BLA between 2000 and 2013 occurred in dense primary humid tropical forests (Fig. 1 and table S1). The rates of human clearing in all forest types decreased after 2005 (Fig. 2B). The relative difference between the maximum and minimum tree cover loss years was 73% in primary forests (maximum, 2003; minimum, 2013), 75% in natural woodlands (maximum, 2004; minimum, 2008–2009), and 66% in other forests (maximum, 2002; minimum, 2012) (table S2B). Fire disturbance had three peaks (2005, 2007, and 2010). By 2013, human clearing of other forest types, together with natural forest loss and non–stand-replacement disturbances (fire and selective logging) in all forest types (including primary), was comparable in area to that of clearing of primary forests (0.70 ± 0.08 Mha versus 0.63 ± 0.07 Mha, where the ± term is the SE of the estimate) (table S3 and Fig. 2B). That is, by 2013, deforestation in woodlands and secondary forests, together with natural tree cover loss and degradation in all forest types, had reached a magnitude of area similar to that of deforestation in dense primary humid tropical forests, which is the main target of current national-level mitigation efforts.
Fig. 1. Sample-based estimates of the total 2000–2013 tree cover loss area in BLA.
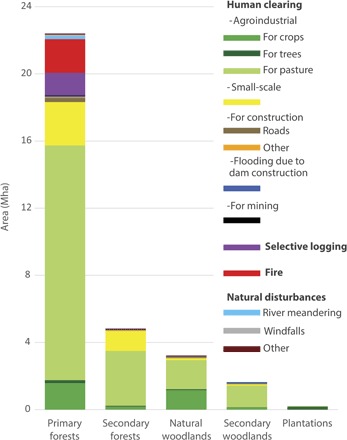
Estimates are disaggregated by predisturbance forest type and disturbance type. Selective logging and fire categories do not represent complete tree cover loss but rather the area affected by these processes. See table S1 for SEs of the estimates.
Fig. 2. Sample-based estimates of annual tree cover loss area in BLA.
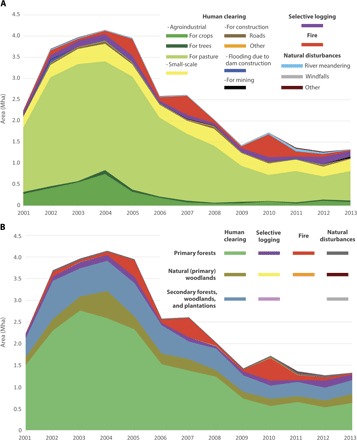
Estimates are disaggregated by (A) disturbance type and (B) predisturbance forest type and disturbance type group. Selective logging and fire categories do not represent complete tree cover loss but rather the area affected by these processes. See tables S2 and S3 for SEs of the estimates.
State-level tree cover loss estimates
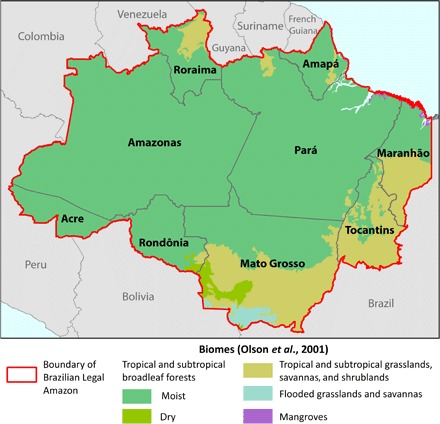
At the state level, the largest contributors to tree cover loss are Mato Grosso and Pará, which together comprise 60% of the total 13-year loss area (table S4 and Fig. 3A). These two states are also the leading contributors to primary forest loss (Fig. 3B), whereas Maranhão, Mato Grosso, and Tocantins, which are partially located within Cerrado woodlands (Fig. 4), make up 99% of tree cover loss in natural woodlands (table S4).
Fig. 3. The 2000–2013 state-level tree cover loss area estimates.
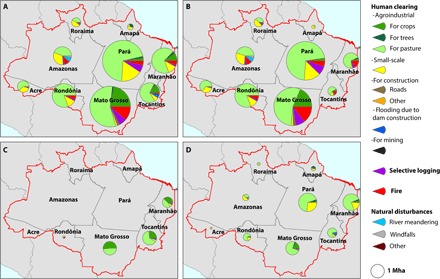
Estimates are disaggregated by disturbance type in (A) all forests, (B) primary forests, (C) natural woodlands, and (D) secondary forests, woodlands, and plantations. See table S4 for SEs of the estimates.
Fig. 4. Study area—BLA.
Agroindustrial forest clearing for pasture is the largest contributor to primary forest loss at the state level (Fig. 3B), except for Roraima and Amapá, where small-scale clearing prevails over agroindustrial. Small-scale clearing is the second largest disturbance type in other frontier states (Acre, Amazonas, and Rondônia). Mato Grosso has a substantial portion of primary forest loss to croplands (18%; table S4), followed by fire (14%). Primary forest fires are also widespread in Maranhão (16%), Tocantins (15%), Amazonas (10%), Pará (5%), Rondônia (5%), and Roraima (4%). Most selective logging occurs within Mato Grosso and Pará, the two largest primary forest clearing contributors, and is estimated at 8 and 7% of the total primary forest loss of these states, respectively. Natural forest disturbances, namely, river meandering and windfalls, contribute more than 1% of primary forest loss only in Amazonas (8% river meandering and 3% windfalls) and Roraima (2% windfalls).
Natural woodlands are converted to cropland more often than primary forests are converted to cropland (Fig. 3C). Conversion to cropland is a major type of loss dynamic in the natural woodlands of Mato Grosso (50%) and the second largest (after pasture conversion) loss type in the natural woodlands of Maranhão (37%) and Tocantins (24%).
Secondary forests and woodlands are primarily cleared for agroindustrial pastures and small-scale agricultural activities (Fig. 3D). Clearing for plantations is a significant contributor to loss dynamics in some areas (45% in Amapá and 2 to 3% in Amazonas, Maranhão, Mato Grosso, Pará, and Rondônia).
Construction of the Luis Eduardo Magalhães (Lajeado) Dam in Tocantins, which was completed in 2002, resulted in extensive inundation and contributed 5% of the total 2000–2013 tree cover loss in the state (4% of loss in primary forests, 3% in natural woodlands, and 10% in secondary forests and woodlands).
Annual state-level tree cover loss estimates (Fig. 5 and table S5) show a peak loss in primary forests and natural woodlands in 2003 and 2004 in most states and a less pronounced peak in secondary forests and woodlands in 2002 in Mato Grosso, Maranhão, and Tocantins. The largest annual loss amplitude is observed in Mato Grosso (1.62 ± 0.12 Mha in 2004 versus 0.12 ± 0.04 Mha in 2009).
Fig. 5. Annual human forest clearing by state.
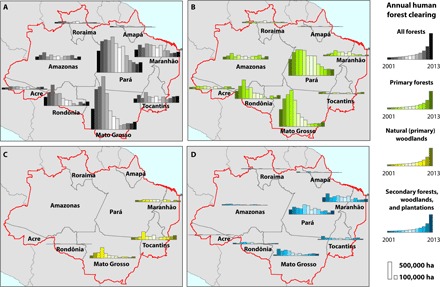
(A) In all forests, (B) in primary forests, (C) in natural (primary) woodlands, and (D) in secondary forests, woodlands, and plantations. See table S5 for SEs of the estimates.
Carbon implications
Our results indicate that, by 2013, clearing of woodlands and secondary forests and non–stand-replacement disturbances (fires and selective logging) exceeded human clearing of primary forests in area (53% versus 47%) (table S3 and Fig. 2B). We used our sample data to estimate the implications of this result on gross carbon loss. From all sample pixels of tree cover loss (3908 pixels), we derived the range of mean predisturbance aboveground carbon (AGC) density estimates from three carbon maps (Table 1). AGC loss was assumed to be 100%, resulting from stand-replacement forest disturbances (human and natural), 4 to 37% (average 21%) from selective logging (18), and 10 to 50% (average 30%) from fire (19). The results of this estimation process indicate that 26 to 35% of 2013 gross AGC loss likely resulted from disturbance types other than human clearing of primary forests. The lowest contribution of other disturbance types to gross AGC loss was in 2003 (13 to 18%), corresponding to an annual peak of primary forest clearing, and the highest contribution was in 2010 (38 to 49%), the drought year with fire disturbance peak (Fig. 6). If deforestation (clearing of primary forests) continues to decline, carbon emissions from other forest and disturbance types, including natural woodlands, will constitute a substantial proportion of gross carbon loss in the BLA.
Table 1. Mean AGC density in predisturbance forest types (MgC/ha).
For carbon data source description, see Materials and Methods.
| Sample size (n) | Predisturbance (year 2000) AGC density (MgC/ha) | ||||
| Baccini et al. (48) | Saatchi et al. (50) | Avitabile et al. (51) | Range | ||
| Primary forests | 2702 | 99.3 | 94.9 | 77.4 | 77.4–99.3 |
| Natural (primary) woodlands | 387 | 27.5 | 28.4 | 18.9 | 18.9–28.4 |
| Secondary forests, woodlands, and plantations |
819 | 48.4 | 48.3 | 44.8 | 44.8–48.4 |
Fig. 6. Estimated annual percent of gross AGC loss from human clearing of primary forests versus other forest disturbances.
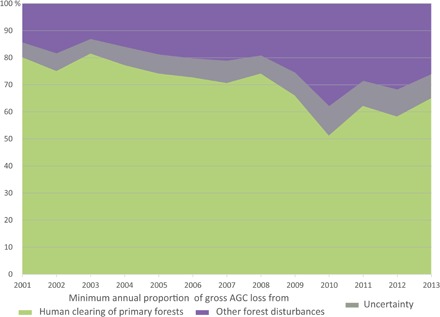
Other disturbances include human clearing of woodlands and secondary forests, fires, and selective logging. Uncertainty is based on the range of mean AGC estimates per forest type from Table 1.
Comparison with deforestation and tree cover loss maps
PRODES and Souza et al. (20) both map deforestation in primary humid tropical forests of the Brazilian Amazon, which corresponds to the human clearing of primary forests in our study. Although all three studies document decreased annual deforestation rates after 2005 and agree in the overall area of deforestation, annual estimates vary up to 65% (Table 2 and Fig. 7). The largest relative disagreement is 2009, when Souza et al. (20) detect substantially larger deforestation areas than PRODES and the current study. The peak of deforestation is 2003 according to our study and 2004 according to others.
Table 2. Comparison between annual deforestation estimates.
(A) Current study (human clearing of primary forests), (B) PRODES, and (C) Souza et al. (20). Total difference between (A) and (C), and (B) and (C) is calculated only for 2001–2010 because of the absence of Souza et al. (20) estimates for 2011–2013.
| Area of deforestation (Mha) | ||||||||||||||
| 2001 | 2002 | 2003 | 2004 | 2005 | 2006 | 2007 | 2008 | 2009 | 2010 | 2011 | 2012 | 2013 | Total | |
| (A) Sample | 1.51 | 2.30 | 2.77 | 2.59 | 2.33 | 1.52 | 1.38 | 1.24 | 0.73 | 0.56 | 0.65 | 0.53 | 0.63 | 18.72 |
| (B) PRODES | 1.82 | 2.17 | 2.54 | 2.78 | 1.90 | 1.43 | 1.17 | 1.29 | 0.75 | 0.70 | 0.64 | 0.46 | 0.59 | 18.22 |
| (C) Souza et al. (20) | 1.72 | 2.33 | 2.22 | 2.44 | 2.22 | 1.60 | 1.38 | 1.24 | 1.20 | 0.55 | — | — | — | 16.91 |
| Difference between estimates (%) | ||||||||||||||
| 2001 | 2002 | 2003 | 2004 | 2005 | 2006 | 2007 | 2008 | 2009 | 2010 | 2011 | 2012 | 2013 | Total | |
| Sample versus PRODES (A − B)/A × 100% |
−20.5 | 6.0 | 8.2 | −7.4 | 18.3 | 6.3 | 15.3 | −4.4 | −2.3 | −25.2 | 1.4 | 13.5 | 6.3 | 2.7 |
| Sample versus Souza (A − C)/A × 100% |
−14.2 | −1.4 | 19.6 | 5.5 | 4.5 | −4.9 | 0.1 | −0.3 | −64.2 | 1.7 | — | — | — | 0.04 |
| PRODES versus Souza (B − C)/B × 100% |
5.3 | −7.8 | 12.5 | 12.0 | −17.0 | −11.9 | −18.0 | 3.9 | −60.5 | 21.5 | — | — | — | −2.3 |
Fig. 7. Comparison of sample- and map-based annual deforestation estimates.
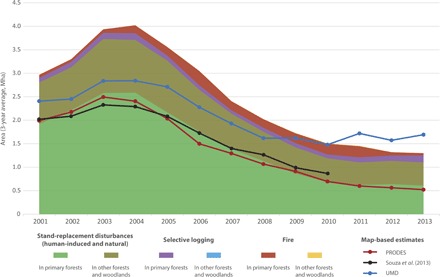
Three-year averages of sample-based annual tree cover loss estimates by disturbance type (stand-replacement disturbances, selective logging, and fire) and forest type (primary forests and other forests and woodlands) compared with 3-year averages of annual map-based deforestation estimates from PRODES and Souza et al. (20) and tree cover loss estimates from UMD map.
PRODES is successful in reproducing our unbiased sample-based annual loss area estimates, but PRODES is not spatially accurate. Only 79% of the sample-based estimated area of human clearing of primary forest was within the PRODES forest mask. Thus, the forest mask imposed by PRODES results in omitting 21% of the estimated area of primary forest cover loss.
The UMD map detects more tree cover loss in the BLA each year, compared to PRODES and Souza et al. (20) (Fig. 7). The explanation for this difference is that the UMD map is not limited to mapping deforestation of primary forests but includes all tree cover loss dynamics. The UMD map underestimates total tree cover loss at the beginning of the study period (before 2010) and overestimates total tree cover loss at the end, that is, displays a temporal pattern of bias, which is absent in PRODES and Souza et al. (20). This may be due to the following reasons: (i) loss date attribution uncertainty (10); (ii) a possible increase of model sensitivity to loss events at the end of the study period caused by the after-effects of the two large droughts (2005 and 2010); and (iii) the new model including Landsat 8 data in 2013, which has proven to increase sensitivity to small-scale disturbances.
Comparison with forest degradation maps
Results of the current sample-based analysis indicate fire peaks in 2005, 2007, and 2010 (Fig. 8), which is consistent with earlier Moderate Resolution Imaging Spectroradiometer (MODIS)–based observations (21). Two of these fire peaks, 2005 and 2010, occur within years of extreme drought (22, 23). Drought conditions, together with forest fragmentation edge effects and selective logging, increase humid tropical forest susceptibility to fire, which often originates from human activities outside of the forest (24, 25). Selective logging rates remain constant in the region between 2000 and 2013 (Fig. 8). We compared our selective logging and fire area estimates with mapping results from the Brazilian national forest degradation monitoring system DEGRAD and from Souza et al. (20) (Fig. 8).
Fig. 8. Comparison of forest degradation estimates.
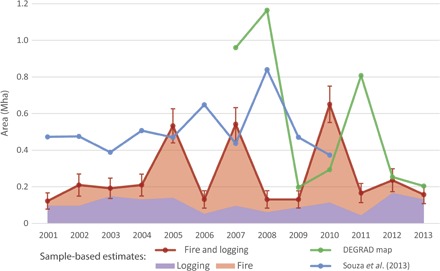
Sample-based fire and selective logging estimates are compared with DEGRAD map within sampling region and Souza et al. (20) degradation estimate. Error bars represent ±SE.
DEGRAD detects areas affected by selective logging and fire during 2007–2013 (see www.obt.inpe.br/degrad/ and Materials and Methods for more information on DEGRAD methodology). The larger degradation area detected by DEGRAD compared to the sample-based analysis (combined selective logging and fire) is likely due to (i) differences in methodology and definitions (DEGRAD marks the entire forest patches as degraded when disturbance signs are present, whereas we consider only a 120-m buffer around visible logging damage and fire scars as degraded). This difference was partially offset by analyzing DEGRAD only within the sampling region of the current study, leaving out 49% of DEGRAD area. (ii) DEGRAD includes some pre-2007 degradation in the 2007–2013 map: 26% (41 of 160) of the samples marked as pre-2007 fire or logging degradation were identified as 2007–2013 degradation in DEGRAD.
Peaks of degradation detected by DEGRAD are 1 year later compared to the peak fire years from our sample and independent MODIS estimates (Fig. 8). The 1-year lag in DEGRAD is confirmed by a sample-level degradation date analysis: 72% (89 of 124) of the sampled pixels identified as 2007–2013 degradation in both our sample analysis and DEGRAD had DEGRAD year of disturbance 1 year later. The lag in degradation detection is probably due to the use of single-date imagery in the DEGRAD system: Year 2008 DEGRAD map was based on imagery from 7 April to 3 October 2008 (91% of the scenes were acquired before September), whereas our sample-based analysis indicates that ~70% of fires in 2000–2013 occurred in September to December (Table 3).
Table 3. Monthly distribution of sample pixels identified as fire disturbance, 2000–2013.
“End of year—uncertain date” indicates that the fire scar was observed in the first 16-day composite of the year and there were no cloud-free 16-day composites at the end of the previous year; in this case, fire was attributed to the end of the previous year.
| Jan | Feb | Mar | Apr | May | June | July | Aug | Sep | Oct | Nov | Dec | End of year—uncertain date | |
| Number of pixels | 2 | 2 | 5 | 3 | 5 | 1 | 6 | 45 | 93 | 18 | 31 | 9 | 15 |
Souza et al. (20) 2000–2010 forest degradation estimates are also based on a single-date Landsat imagery analysis and have a similar 1-year lag in degradation date detection (Fig. 8), detecting peaks of forest degradation in 2006 and 2008 instead of 2005 and 2007 and missing the 2010 peak.
The differences between the three estimates are probably due to different degradation definitions, which are often difficult to formalize (for example, how the boundaries of the burnt areas are defined or what distance from visible logging extractions is considered degraded), different methodological approaches [automated image classification of Souza et al. (20) versus visual image interpretation of DEGRAD versus visual sample interpretation of the current study], different input data [a single Landsat image per year by Souza et al. (20) and DEGRAD versus a continuum of 16-day Landsat composites in our study], and slightly different study areas.
Comparison with land-cover and land-use maps
We have compared our sample-based estimates of forest disturbance types to the existing land-cover and land-use maps for the BLA, namely, TerraClass, TerraClass Cerrado, and MapBiomas. The TerraClass system (www.inpe.br/cra/projetos_pesquisas/dados_terraclass.php) maps land uses following deforestation detected by PRODES by 2004, 2008, 2010, 2012, and 2014 (26). We compared sampled pixels identified as human clearing of primary forests in our analysis with the temporally closest TerraClass map (see Materials and Methods and Table 4). Similar to our results, TerraClass identified pasture as the most widespread postdeforestation land use: 87% of area identified as TerraClass pasture corresponds to the agroindustrial clearing for pasture disturbance type in our sample analysis, indicating a high degree of agreement between the two products. Of the sample pixels falling within TerraClass pasture, 7% are labeled as small-scale clearing disturbance, a difference that does not necessarily represent a thematic disagreement. Only 6% of the area TerraClass labels as pasture disagrees with our sample interpretation, falling into cropland, tree plantation, construction, dam, and mining disturbance types. More than 85% of the TerraClass area of annual agriculture was in agreement with our agroindustrial clearing for crops disturbance type. A large percent of small-scale clearing area from our current study corresponds to TerraClass forest (46% of the area), which is likely explained by the median size of small-scale clearing in our study being 5 ha and minimum mapping unit of PRODES being 6.25 ha. Small-scale clearings also correspond to TerraClass pastures (26%), secondary regrowth and reforestation (15%), mosaic of land uses (5%), and other classes (8%). Numerous forest loss sample pixels are identified as no deforestation or secondary vegetation in TerraClass (columns “Forest,” “Nonforested areas,” and “Secondary regrowth and reforestation”), probably because of the differences in deforestation date identification between our sample-based analysis and PRODES, which is the deforestation baseline for TerraClass.
Table 4. Comparison between types of human clearing in primary forests (2001–2013) identified from the sample and postdeforestation land-use types from TerraClass.
Cell entries of the confusion matrix denote the number of sample pixels in each category (a mixed loss pixel was recorded as 0.5). The 113.5 sample pixels with TerraClass showing later loss date than the current analysis (for example, 2004 instead of 2001–2003) were excluded from the analysis and are not displayed in the table.
|
Human clearing of primary forests (current study) |
TerraClass | |||||||||||
| Pasture |
Annual agriculture (cropland) |
Mosaic of land uses |
Secondary regrowth and reforestation |
Forest |
Nonforested areas |
Water |
No data |
Mining |
Urban areas |
Total | ||
| Agroindustrial clearing |
Pasture | 944 | 11.5 | 35 | 129 | 250 | 56 | 1.5 | 80.5 | 0 | 0 | 1507.5 |
| Crops | 52 | 86 | 0 | 6 | 10 | 17.5 | 0 | 4.5 | 0 | 0 | 176 | |
| Trees | 4 | 3 | 1 | 8 | 2 | 2 | 0 | 0 | 0 | 0 | 20 | |
| Small-scale clearing | 73.5 | 0 | 13.5 | 43.5 | 130 | 10 | 3 | 7.5 | 0 | 0 | 281 | |
| Construction | Roads | 5.5 | 0 | 0.5 | 2.5 | 15.5 | 3 | 0 | 0 | 0 | 0 | 27 |
| Other | 2.5 | 0 | 1 | 0.5 | 1 | 0.5 | 0 | 0 | 0 | 0 | 5.5 | |
| Dam construction | 3 | 0 | 0 | 0 | 4 | 2 | 0 | 0 | 0 | 0 | 9 | |
| Mining | 2 | 0 | 0 | 0 | 0.5 | 0 | 0 | 0 | 0 | 0 | 2.5 | |
| Total | 1086.5 | 100.5 | 51 | 189.5 | 413 | 91 | 4.5 | 92.5 | 0 | 0 | 2028.5 | |
TerraClass Cerrado (www.dpi.inpe.br/tccerrado/) maps 2013 land uses for the Cerrado region of Brazil. We compared sample pixels identified as 2001–2012 human clearing of natural woodlands in our analysis with the 2013 TerraClass Cerrado map (see Materials and Methods and Table 5). Of the sample pixels falling within TerraClass Cerrado pasture, 79% were labeled as pasture in our sample interpretation; of TerraClass cropland, 95% of sample pixels were labeled as cropland. At the same time, TerraClass Cerrado omits 21% of the area identified as human clearing of natural woodlands in the current study, marking them as natural vegetation (Table 5). TerraClass and TerraClass Cerrado confirm our finding that natural woodlands are converted to croplands more often than primary forests are converted to croplands (Tables 4 and 5): The pasture/cropland conversion ratio is 2:1 in TerraClass Cerrado (natural woodlands of Cerrado region) and 11:1 in TerraClass (primary forests of BLA).
Table 5. Comparison between types of human clearing in natural woodlands (2001–2012) identified from the sample and 2013 land use according to TerraClass Cerrado.
Cell entries of the confusion matrix denote the number of sample pixels (1 and 0.5 loss) in each category.
|
Human clearing of natural woodlands (current study) |
TerraClass Cerrado | ||||||||
| Pasture |
Agriculture (annual and perennial) |
Mosaic of land uses |
Forestry |
Natural vegetation |
Water | No data | Total | ||
| Agroindustrial clearing |
Pasture | 115 | 3 | 0 | 1 | 41 | 0 | 0 | 160 |
| Crops | 25.5 | 73.5 | 0 | 3 | 9.5 | 0 | 1 | 112.5 | |
| Trees | 2 | 0 | 0 | 2 | 1 | 0 | 0 | 5 | |
| Small-scale clearing | 3.5 | 0 | 0 | 0 | 3.5 | 0 | 0 | 7 | |
| Construction | Roads | 0 | 0.5 | 1 | 0 | 4 | 0 | 0 | 5.5 |
| Other | 0 | 0 | 1 | 0 | 1 | 0 | 0 | 2 | |
| Dam construction | 0 | 0 | 0 | 0 | 1 | 4 | 0 | 5 | |
| Mining | 0 | 0 | 0 | 0 | 0 | 0 | 0 | 0 | |
| Total | 146 | 77 | 2 | 6 | 61 | 4 | 1 | 297 | |
MapBiomas (http://mapbiomas.org) maps major types of land cover and land use (forest, cropland, pasture, planted forests, coastal forests, water, and others) annually between 2008 and 2015 for the Amazon, Cerrado, and Pantanal biomes, which enables comparison with our sampled pixels, identified as 2001–2013 human clearing of all forest types (see Materials and Methods and Table 6). Of the sample pixels falling within MapBiomas pasture, 86% were labeled as pasture in our sample interpretation; of MapBiomas cropland, 64% of sample pixels were labeled as cropland. Thirty percent of the area identified as human clearing of all forest types in the current study falls within the MapBiomas “Other” category, which represents nonforested types of land cover and therefore does not disagree with our interpretation in terms of forest cover absence. A major disagreement between our sample-based result and MapBiomas is the 26% of the human forest clearing area that MapBiomas labels as “Forest.” This disagreement is probably due to the different forest definitions used and possible commission errors in the MapBiomas annual forest layers (MapBiomas has yet to undergo a formal accuracy assessment).
Table 6. Comparison between types of human clearing in all forest types (2001–2013) identified from the sample and land cover/land use according to MapBiomas.
Cell entries of the confusion matrix denote the number of sample pixels (1 and 0.5 loss) in each category.
|
Human clearing of all forest types (current study) |
MapBiomas | |||||||||
| Pasture | Agriculture | Forest |
Planted forest |
Coastal forest |
Water | Other | No data | Total | ||
| Agroindustrial clearing |
Pasture | 997.5 | 73.5 | 536 | 0 | 0 | 1 | 717 | 0 | 2325 |
| Crops | 87.5 | 132.5 | 28.5 | 0 | 0 | 0 | 101 | 0 | 349.5 | |
| Trees | 3 | 1 | 30 | 0 | 0 | 0 | 20 | 0 | 54 | |
| Small-scale clearing | 61.5 | 0 | 271.5 | 0 | 0 | 0 | 121 | 1 | 455 | |
| Construction | Roads | 9.5 | 1 | 15 | 0 | 0 | 0 | 13 | 0 | 38.5 |
| Other | 4 | 0 | 1 | 0 | 0 | 0 | 10 | 0 | 15 | |
| Dam construction | 0 | 0 | 0 | 0 | 0 | 18 | 4 | 0 | 22 | |
| Mining | 1.5 | 0 | 0 | 0 | 0 | 1 | 6 | 0 | 8.5 | |
| Total | 1164.5 | 208 | 882 | 0 | 0 | 20 | 992 | 1 | 3267.5 | |
DISCUSSION
Forest monitoring systems using remote sensing have traditionally been map-based. Wall-to-wall maps are useful for a variety of applications, including regional forest management and law enforcement, planning of ground-based measurement campaigns, and informing ecosystem and biodiversity modeling. Sample-based validation data provide critical information necessary to quantify classification errors and biases present in the maps and to produce unbiased area estimates and their associated uncertainties expressed as confidence intervals (17). Here, we demonstrate how sample reference data can be used for multiple research objectives, complementing map-based monitoring, including (i) unbiased area estimation, satisfying Intergovernmental Panel on Climate Change emissions reporting requirements, which specify the absence of over- or underestimation so far as can be judged, and reduction of uncertainties as far as practicable (27); (ii) verification of temporal trends from the maps or revealing their biases over time; and (iii) attribution of additional thematic information (for example, forest disturbance type or predisturbance forest type).
Brazil conducts the most advanced operational forest monitoring system, integrating near–real-time deforestation monitoring [DETER and DETER-B (28)], annual deforestation [PRODES (1)], forest degradation (DEGRAD), and postdeforestation land-use (TerraClass) mapping within primary forests. However, the increasing contribution of tree cover loss in other (nonprimary) forest types to gross tree cover and carbon loss suggests that national monitoring systems should expand beyond the ever-decreasing primary forest resource that is currently monitored by PRODES. For example, secondary forests have rapid carbon and nutrient accumulation potential (29), which may be offset by their widespread reclearing. Cerrado woodlands and savannas have high species richness and endemism, high rates of land conversion to agriculture, and low level of protection, which pose an imminent threat for biodiversity, water recycling to the atmosphere, and other deleterious impacts (30–32). Brazil has prototyped a deforestation monitoring system for other biomes outside of the Amazon region (PMDBBS system, http://siscom.ibama.gov.br/monitora_biomas/). This effort included producing a baseline map of 2002 vegetation for Caatinga, Cerrado, Mata Atlântica, Pampa, and Pantanal biomes and mapping 2002–2008 and 2008–2009 vegetation changes using data from Landsat and CBERS (China-Brazil Earth Resources Satellite) satellites. However, the maps were updated for the years 2010 and 2011 only for the Cerrado biome; no updates are available for the following years. TerraClass postdeforestation land-use mapping was expanded to include the Cerrado region but only for the year 2013. Moderate-resolution (MODIS-based) monitoring of vegetation changes in the Cerrado region has been prototyped in several studies (33, 34), but not yet implemented operationally, as with DETER in primary forests.
National forest monitoring should not focus only on forest clearing and conversion to nonforest land uses (“deforestation”). Non–stand-replacement disturbances, such as selective logging, paired with climate change and increased vulnerability to fire, may lead to significant carbon emissions and biodiversity losses and eventually to conversion of forests to other land covers. DEGRAD is one example of such a national-scale degradation monitoring effort, even though limited by a single-date image analysis approach. Our results suggest that the use of the entire record of satellite observations, rather than a single best image for a given year, may yield better results in tree cover loss date attribution and improve near–real-time forest disturbance monitoring (35). An independent nongovernmental MapBiomas system is moving in this direction by using the entire archive of Landsat observations to map annual land-cover and land-use transitions in all biomes of Brazil.
As illustrated in this study, quantifying forest disturbance dynamics is a complex task. Comprehensive tracking of predisturbance state (primary versus secondary), disturbance factor (for example, fire versus mechanical clearing), and subsequent land use (for example, soybean versus mining) is a challenge. The work of the Brazilian National Institute for Space Research (INPE) on documenting these dynamics is at the forefront of all similar national capabilities, as evidenced by the host of INPE products seeking to track comprehensive forest change. Our study demonstrates the increased need for such systematic monitoring because the relative amounts of tree cover loss due to different factors have changed dramatically since 2000. For applications such as carbon monitoring, the omission of forest disturbance types other than large-scale clearing may lead to inaccurate emission estimation. To address this issue, national forest monitoring systems could produce wall-to-wall characterizations of forest type, loss, and gain. Such maps could then be used to construct strata for the allocation of a probability sample, resulting in unbiased, precise estimators of forest cover loss dynamics and associated carbon losses and gains (17, 36, 37).
MATERIALS AND METHODS
Study area
The study area is the BLA; Brazilian states of Acre, Amapá, Amazonas, Mato Grosso, Pará, Rondônia, Roraima, and Tocantins; and the western part of the state of Maranhão (Fig. 4). The boundaries of BLA were obtained from the database of the Woods Hole Research Center (http://whrc.org/publications-data/datasets/large-scale-biosphere-atmosphere-experiment/) and modified to exclude the east of Maranhão in accordance with the PRODES study area.
Most of the BLA (81.2%) lies within the tropical moist broadleaf forest biome (Fig. 4); 16.3% within tropical grasslands, savannas, and shrublands, including Guianan savanna in the north of the region and Cerrado woodlands in the south; 1.2% within Chiquitano tropical dry broadleaf forests; 1.0% within Pantanal flooded savannas; and 0.3% within coastal mangroves (38). Although most states in the BLA are dominated by humid tropical forests, significant parts of Tocantins, Maranhão, and Mato Grosso are occupied by Cerrado woodlands.
PRODES and UMD data sets
PRODES is a deforestation monitoring system operated by INPE. PRODES maps deforestation within an ever-decreasing “nominally intact” forest mask (Fig. 9) (39); clearing of secondary forest regrowth is not mapped. The PRODES forest mask includes primarily dense humid tropical forests; Cerrado woodlands are mostly considered nonforest (Fig. 9). The PRODES methodology is a scene-based semiautomated classification, involving (i) generation of fractional images using linear spectral mixture modeling, (ii) image segmentation, (iii) unsupervised classification of segments, and (iv) visual interpretation and correction of mapping results (39). Scene-based approaches are more affected by cloud artifacts, which are labeled as no data areas in PRODES (Fig. 9). The minimum size of the image segment in PRODES mapping method (minimum mapping unit) is 6.25 ha (1), which likely introduces omission of deforestation associated with clearing of smaller forest patches.
Fig. 9. PRODES forest mask and 2001–2013 forest cover loss and UMD 2001–2013 tree cover loss within BLA.
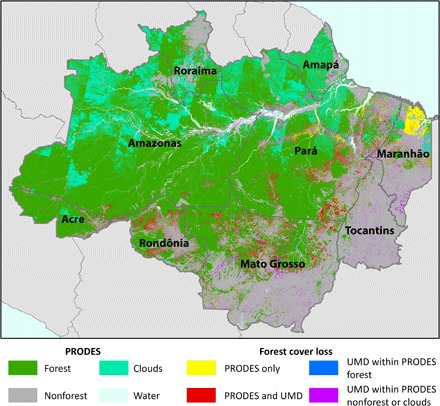
The UMD global tree cover loss product (10) maps the loss of any woody vegetation taller than 5 m (with % canopy cover of >0), regardless of it being natural intact vegetation or secondary regrowth. Hence, the UMD product characterizes tree cover dynamics both within and outside of the PRODES forest mask (Fig. 9). The UMD mapping method is a more data-intensive pixel-based approach that uses all available cloud-free pixels (40), allowing it to map tree cover loss within PRODES no-data (cloudy) areas (Fig. 9).
Sampling design
We aggregated all forest loss areas detected by PRODES and UMD products from 2001 to 2013 as “combined forest loss” to define the region of interest. Combined forest loss was buffered by 120 m (four Landsat pixels) to include areas with likely forest loss omission in both products. The population from which the sample was selected consisted of the combined PRODES and UMD forest loss and associated buffer (Fig. 10). A total of 10,000 sample pixels (30 m × 30 m) were selected from this region via simple random sampling. Sample-based estimates of forest loss area were produced for the entire BLA and for each state separately (Table 7). The SE of the estimated area depends on the absolute size of the sample (see Eq. 2) and not on the percent of the population sampled (41). For example, the sample size of 10,000 yielded an SE of 1.3% for the total 2001–2013 forest cover loss estimate in BLA (table S1), which we consider to be sufficiently precise.
Fig. 10. Population from which the simple random sample of 10,000 pixels was selected.
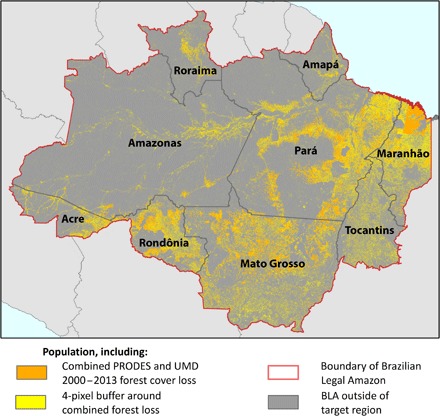
Table 7. Sample size (number of pixels) and area of target region by state in BLA.
| State | Sample size, n | Area of target region, Atot (Mha) |
| Acre | 310 | 2.74 |
| Amapá | 151 | 1.29 |
| Amazonas | 877 | 7.15 |
| Maranhão | 1,278 | 11.50 |
| Mato Grosso | 2,550 | 22.75 |
| Pará | 3,030 | 26.37 |
| Rondônia | 909 | 7.81 |
| Roraima | 210 | 1.88 |
| Tocantins | 685 | 5.88 |
| BLA total | 10,000 | 87.36 |
A direct estimator of area for simple random sampling (16) was used to estimate the area of tree cover loss based on the sample reference values. These area estimates are based on the reference data and sample labeling protocol described in the following subsection. For each sampled pixel, the proportion of area of tree cover loss was recorded as 0, 0.5, or 1. The estimated area of tree cover loss type i within a region of interest was computed as
| (1) |
where is the sample mean proportion of tree cover loss of type i (that is, mean of the n sample pixel values of 0, 0.5, or 1), Atot is the area of the region of interest, and n is the number of sample pixels in the region of interest.
Area estimates can be produced for the full population or regions of interest such as states. For the full population, the sample size is n = 10,000. Sample sizes for each state are listed in Table 7. The SE of the estimated area is
| (2) |
where si is the sample SD of tree cover loss type i in the region of interest (that is, the SD of the tree cover loss values of 0, 0.5, and 1 for the n pixels sampled in that region). The estimates for regions of interest such as states are considered “domain” or “subpopulation” estimates, and the estimators implemented are those recommended by Cochran [(41), section 2.12].
Reference data and sample labeling protocol
Reference values for each sampled pixel were derived via visual interpretation of annual Landsat composite images for 1999–2013 and, when available, high-resolution imagery from Google Earth. Reference data and final interpretation results for each sampled pixel are available at glad.umd.edu/brazil. Landsat annual composites represent median normalized reflectance values from all available cloud/shadow-free pixels for a given year. Methods for cloud screening, image normalization, and per-pixel compositing are described by Potapov et al. (40). In addition to annual Landsat composites, 16-day composite images from 1999–2013 were examined for sampled pixels identified as having experienced forest degradation (from fire and selective logging) in the initial sample screening. This was done to get a more precise estimate of the timing of these events: Low-intensity disturbances such as fires occur in local dry seasons and during droughts. If these disturbances occurred late in the year, their annual allocation might be incorrectly assigned to the following year using median annual composites.
Each sampled pixel was initially visually assessed independently by two experts. Sample pixels with disagreement between experts were subsequently revisited until a consensus was reached. All sampled pixels were identified as yes/no tree cover loss. Pixels with tree cover loss were further attributed with (i) loss year (2001–2013), (ii) likely disturbance type, and (iii) predisturbance forest type. Mixed sample pixels, located on the boundary of tree cover loss patches, were marked as edge pixels and treated as “0.5 loss” in area calculations, with 404 of 10,000 sample pixels (4%) identified as boundary pixels. We identified only the first stand-replacement forest disturbance event during the study period (2000–2013) and the associated land-cover transition. For example, if a forested sample pixel was initially converted to pasture, and later transformed to cropland, our analysis would assign it as a forest-to-pasture conversion. If a sample pixel experienced tree cover loss at the beginning of the study period followed by tree-cover regrowth and a second tree cover loss event, we would record only the first loss event and ignore the subsequent dynamics. However, this example case would be labeled as a forestry land use, that is, the clearing of trees to be replaced by tree cover in the management of a plantation.
Types of forest disturbance were subdivided into stand-replacement (human forest clearing and natural forest disturbances) and non–stand-replacement (degradation), which consists of fire and selective logging (Table 8). For stand-replacement disturbances, a sample pixel was considered “loss” if the entire pixel or half of the pixel (in case of mixed boundary pixels) experienced complete tree cover loss. Human forest clearing includes large-scale agroindustrial clearing for nonwoody crops, tree plantations, and pasture; small-scale clearing; clearing for mining, road construction, and other construction; and flooding of forests after the construction of dams (Table 8). Agroindustrial forest clearing is reliably distinguished from all other clearing types at Landsat resolution based on the size, shape, and spatial pattern of a clearing. However, distinguishing agroindustrial clearing for row crops from newly established pastures may be challenging in the absence of high-resolution imagery on Google Earth. Georeferenced ground images from Panoramio provide additional information for interpreters in these cases. Small-scale clearing was identified by its size and postclearing land use (combination of cropland, pasture, orchards, and residences) for older clearings and by size only for the fresh clearings. Median area of loss patches identified as small-scale clearing is 5 ha. Only 24% of small-scale clearing sample pixels fall within the most recent INCRA (National Institute of Colonization and Agrarian Reform) settlement map, which indicates that these small-scale clearings are created not only by smallholders (rural settlers) but also by agroindustrial enterprises. Natural forest disturbances include windfalls, river meandering, and other natural disturbances. The latter category is very rare and implies that the type of natural disturbance could not be identified reliably (for example, it was not clear whether tree cover was lost due to a windfall or as an after-effect of a drought).
Table 8. Types of forest disturbance.
Images are subsets of pre- and postdisturbance (top and bottom, respectively) for annual Landsat composites (band combination, 5-4-3). Small red rectangles represent sampled pixels.
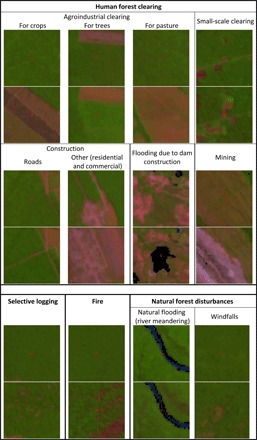
For non–stand-replacement disturbances, which included forest degradation due to fire and selective logging, a sample pixel was marked as affected by forest disturbance if it experienced canopy damage or was located within a 120-m buffer around visible fire or logging damage. The 120-m buffer (four Landsat pixels) is the minimum number of 30-m Landsat pixels, containing a 100-m buffer, corresponding to the area initially affected by felling of individual trees in conventional selective logging (42) and containing the most edge effects associated with increased tree mortality and altered forest structure (43). If a sample pixel experienced degradation (due to fire or logging) before being cleared within a study period, we considered clearing to be the major type of forest disturbance and recorded only clearing to avoid double-counting. Tropical forest fires have a distinct pattern of concentric circles (Table 8) because of diurnal variation in precipitation and humidity (44), which enables their identification on Landsat imagery. Selective logging is marked by the presence of logging roads and a semiregular pattern of gaps caused by tree extraction (Table 8).
Major predisturbance forest types were defined as dense (>60% canopy cover) tropical forests (both humid and dry), woodlands and parklands (10 to 60% canopy cover), and tree plantations (Table 9). Dense tropical forests were further subdivided into primary and secondary, which in Landsat imagery have different spectral responses (primary forests are usually characterized by low spectral reflectance in the shortwave infrared range) and texture (primary forests have larger crowns creating a recognizable texture, whereas secondary forests look comparatively uniform). Primary and secondary forests can be unambiguously distinguished in submeter imagery when available from Google Earth by the size of tree crowns. Primary forests identified this way using satellite imagery include primary intact and primary degraded (for example, previously selectively logged) and may include some old-growth secondary forests (for example, cleared during the rubber boom of 1879–1912). Field data show that tropical secondary forests regain the density, basal area, aboveground biomass (AGB), and species richness similar to those of primary forests after 40 years (45), and selectively logged primary forests fully restore their AGB in about 25 years (46). This evidence suggests that primary degraded and old-growth secondary forests, indistinguishable in circa 2000 satellite imagery from primary intact forests, have carbon storage and biodiversity value analogous to those of primary intact forests, and that possible inclusion of such forests into our “primary forest” category will not affect the main conclusions of the study.
Table 9. Predisturbance forest types.
Images are subsets of pre- and postdisturbance (top and bottom, respectively) for annual Landsat composites on the left (band combination, 5-4-3) and Google Earth imagery on the right. Small red rectangles represent sampled pixels.
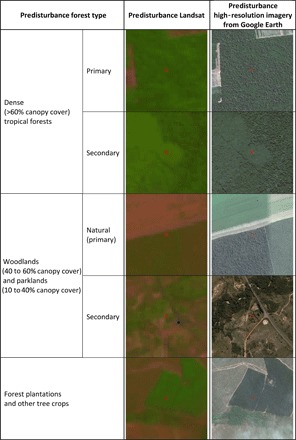
Woodlands and parklands were also subdivided into natural (primary) and secondary. Natural woodlands and parklands correspond to the uniform woody vegetation patches in the “Tropical grasslands, savannas, and shrublands” biome (38). The biome map also helped distinguish between dense secondary forests in the tropical forest biome and natural woodlands. Secondary woodlands and parklands represent sparse secondary regrowth in both tropical forests and savannas. Tree plantations are characterized by regular patch shapes, high reflectance in the shortwave infrared range and uniform texture in Landsat imagery, and systematic planting recognizable in high-resolution imagery.
Quality of reference data
The quality of sample visual interpretation depends on multiple factors, such as the availability of reference satellite data, distinguishability of various classes with the available satellite data (discussed in the previous subsection), image interpretation experience of validation experts, and usability of validation interface. Here, we will discuss several indicators of the quality of the reference sample data, which is a basis of the current analysis.
The primary source of reference data to identify the presence or absence of forest loss in each sampled pixel was annual Landsat cloud-free composites, produced using the entire archive of Landsat ETM+ data for the study period. Eighty-one percent of the sampled pixels had at least one cloud-free observation in each year (2000–2013), 9% had one missing annual observation, 4% had two missing observations, 2% had three missing observations, 3% had four missing observations, and 2% had five or more missing observations. Additionally, 44% of all sample pixels had at least one very high resolution (VHR; resolution, <1 m) image on Google Earth, 34% had SPOT image (resolution, 2.5 m), and 22% had only Landsat. These higher-resolution imagery sources (VHR and SPOT) facilitated identification of forest loss cause and predisturbance forest type. Sampled pixels with detected forest loss had higher availability of high-resolution imagery on Google Earth (58% VHR, 38% SPOT, and 4% Landsat only), which is probably due to the fact that high-resolution imaging systems target settlements and areas of human development more often than undisturbed forested areas.
Visual interpretation of each sample pixel was first performed by each of the two experts independently; initial agreement between the interpreters on the sampled pixel belonging to the yes/no/boundary forest loss category was 87%. The remaining 13% of sampled pixels were iteratively reinterpreted until consensus was reached. From the sampled pixels with initial forest loss agreement, 80% had loss year agreement and another 12% had a 1-year difference in loss date between the two interpreters. Sampled pixels with initial forest loss agreement had 78% agreement for loss type and 82% agreement for predisturbance forest type. High rates of initial interpretation agreement illustrate that interpretation criteria, described in the previous subsection, were applied by the experts consistently.
Auxiliary data: DEGRAD
DEGRAD is a forest degradation monitoring system operated by INPE (www.obt.inpe.br/degrad/). DEGRAD data for the BLA exist for 2007–2013 and identify three types of degradation: mild (small gaps from selective logging), moderate (later stages of selective logging, skid trails, and other logging infrastructure are visible in the imagery, but large trees and the structure of canopy are still preserved), and intensive (significant loss of large trees and understory due to heavy selective logging, often accompanied by recurring fires). The DEGRAD methodology is based on visual interpretation of a single good image during the year. Hand-drawn polygons of forest degradation outline the forest area in which degradation events were observed. Of the degradation area mapped by DEGRAD, 49% is outside of our sampling region, which includes forest canopy damages, detectable in Landsat imagery and mapped by PRODES and UMD, and a surrounding 120-m buffer. To ensure an adequate comparison of our sample-based fire and logging estimates with DEGRAD, we analyzed DEGRAD only within our sampling region.
Auxiliary data: TerraClass and TerraClass Cerrado
TerraClass is another project operated by INPE (www.inpe.br/cra/projetos_pesquisas/dados_terraclass.php) with the objective of mapping land uses following deforestation in primary forests of the BLA (26). TerraClass is currently available for the years 2004, 2008, 2010, 2012, and 2014. Each year’s map assigns the type of land use to all areas that were deforested by that year according to PRODES using single-date Landsat imagery. Current year’s deforestation does not have an assigned postdeforestation land use (for example, year 2004 TerraClass has “Deforestation 2004” class). Therefore, to compare our sample-based disturbance types (which reflect only the first transition of forested vegetation to other land covers) to TerraClass postdeforestation land uses (which may change over time), we overlaid sample pixels identified in our study as 2001–2003 forest loss with 2004 TerraClass; 2004–2007 loss sample pixels with 2008 TerraClass; and 2008–2009 with 2010, 2010–2011 with 2012, and 2012–2013 loss sample pixels with 2014 TerraClass. Only the sample pixels identified as human clearing of primary forests were used in the comparison to ensure the best match with deforestation as mapped by PRODES. All TerraClass pasture categories (pastures, pastures with shrubs, pastures with bare soil, and pastures with tree regeneration) were combined into one pasture category to facilitate the comparison; secondary vegetation and reforestation classes were also combined (Table 4). Combining pasture categories into one class was reported to decrease confusion between TerraClass postdeforestation land-use classes from 23 to 10% based on a sample validation using SPOT reference data (26).
TerraClass Cerrado is a similar Landsat-based system mapping land uses following the conversion of natural vegetation into other land uses in the woodland region of Cerrado (www.dpi.inpe.br/tccerrado/). TerraClass Cerrado is available only for the year 2013. We compared the 2013 TerraClass Cerrado land-use map with the sample pixels labeled as human clearing of natural woodlands in 2001–2012 of our current study (Table 5); year 2013 was eliminated from the comparison due to the possible omission of late 2013 forest loss in TerraClass, which uses single-date Landsat imagery.
Auxiliary data: MapBiomas
MapBiomas is a nongovernmental land-cover and land-use mapping project, operated by a consortium of nongovernmental organizations, universities, and geospatial companies in Brazil (http://mapbiomas.org/), using modern cloud computing and data storage technologies. Currently, the project is still under development. Collection 1 annual land-cover and land-use maps are available for the years 2008 to 2015; accuracy assessment information is not yet available. Maps are produced from multitemporal Landsat image composites using a combination of spectral mixture analysis (to map forests) and supervised Random Forest classification (to map pasture, cropland, and planted forests) and a set of priority rules to combine individual thematic layers.
Because in the current study we identified only the first land-cover transition after stand-replacement forest disturbance, we compared our forest loss sample pixels with the temporally closest MapBiomas map: 2001–2007 forest loss samples were compared with 2008 MapBiomas classes; 2008 loss with 2009 MapBiomas; 2009 with 2010; 2010 with 2011; 2011 with 2012; 2012 with 2013; and 2013 forest loss samples with 2014 MapBiomas land-cover and land-use classes. MapBiomas is available for all biomes, and therefore, we were able to compare it with sampled pixels identified in the current study as human clearing of all forest types (primary and secondary dense humid tropical forests, natural and secondary woodlands, and planted forests).
Auxiliary data: AGC density
To estimate the contribution of different types of forest disturbances to gross carbon loss, we used circa year 2000 biomass maps, rather than maps of “premodern” (circa 1970s) biomass (47), because we do not estimate pre-2000 forest disturbance rates in the present study. The following circa year 2000 AGB/AGC density maps were intersected with our sample pixels: (i) the new 30-m Baccini et al. (48) data set, obtained from the Global Forest Watch website (www.climate.globalforestwatch.org), of a continuous 30-m resolution layer of AGB density estimates, produced using Landsat imagery and Geoscience Laser Altimeter System (GLAS)–estimated biomass following an approach for MODIS-based mapping (49); (ii) Saatchi et al. (50) 1-km resolution AGB density map, derived using a combination of lidar, optical, and microwave remotely sensed data; and (iii) Avitabile et al. (51) 1-km resolution AGB density map, integrating Saatchi’s and Baccini’s maps (49, 50) and correcting for biases present in these maps (52, 53) by using an independent set of reference data.
Predisturbance (year 2000) carbon densities for each forest type (Table 1) were derived by averaging values from each map corresponding to all tree cover loss sample pixels of this forest type. Estimates of AGB density from Baccini’s, Saatchi’s, and Avitabile’s maps (Mg/ha) were converted to AGC density (MgC/ha) using a 0.5 coefficient. The range of mean AGC densities from all three map sources was further used to compare annual proportions of AGC loss from human clearing of primary forests and from other forest disturbances (Fig. 6).
Supplementary Material
Acknowledgments
We thank H. Mesquita (Brazilian Forest Service) for valuable insight into Brazilian national forest monitoring data. Funding: Support for the study was provided by the Gordon and Betty Moore Foundation (grant 5131), Norwegian Climate and Forests Initiative through the Global Forest Watch project, NASA Land Cover and Land Use Change program (grant NNX08AL99G), and NASA Carbon Monitoring System program (grant NNX13AP48G). Author contributions: A.T., M.C.H., P.V.P., and S.V.S. designed the study. A.T., K.S.-R., C.O., and R.A. interpreted sample data. A.T. and S.V.S. performed statistical data analysis. A.T., M.C.H., P.V.P., and S.V.S. wrote and edited the manuscript. Competing interests: The authors declare that they have no competing interests. Data and materials availability: All data needed to evaluate the conclusions of the study are present in the paper and/or the Supplementary Materials. Individual sample interpretation data may be provided by the authors upon request.
SUPPLEMENTARY MATERIALS
Supplementary material for this article is available at http://advances.sciencemag.org/cgi/content/full/3/4/e1601047/DC1
table S1. Total 2001–2013 forest cover loss in BLA by disturbance type and forest type (Mha ± SE).
table S2A. Annual forest cover loss in BLA by disturbance type in all forests (Mha ± SE).
table S2B. Annual tree cover loss in BLA by forest type (Mha ± SE), all disturbance types.
table S3. Annual tree cover loss in BLA by major disturbance types and types of forest cover (Mha ± SE).
table S4. Disturbance types by state and forest type (Mha ± SE), corresponding to Fig. 3.
table S5. Annual human forest clearing by state and forest type (Mha ± SE), corresponding to Fig. 5.
REFERENCES AND NOTES
- 1.Instituto Nacional de Pesquisas Espaciais, Monitoramento da Cobertura Florestal da Amazônia por Satélites: Sistemas PRODES, DETER, DEGRAD E QUEIMADAS 2007-2008 (Instituto Nacional de Pesquisas Espaciais, 2008). [Google Scholar]
- 2.Karstensen J., Peters G., Andrew R. M., Attribution of CO2 emissions from Brazilian deforestation to consumers between 1990 and 2010. Environ. Res. Lett. 8, 024005 (2013). [Google Scholar]
- 3.Fearnside P. M., Figueiredo A. M. R., Bonjour S. C. M., Amazonian forest loss and the long reach of China’s influence. Environ. Dev. Sustain. 15, 325–338 (2013). [Google Scholar]
- 4.Barona E., Ramankutty N., Hyman G., Coomes O. T., The role of pasture and soybean in deforestation of the Brazilian Amazon. Environ. Res. Lett. 5, 024002 (2010). [Google Scholar]
- 5.Morton D. C., DeFries R. S., Shimabukuro Y. E., Anderson L. O., Arai E., del Bon Espirito-Santo F., Freitas R., Morisette J., Cropland expansion changes deforestation dynamics in the southern Brazilian Amazon. Proc. Natl. Acad. Sci. U.S.A. 103, 14637–14641 (2006). [DOI] [PMC free article] [PubMed] [Google Scholar]
- 6.Boucher D., Roquemore S., Fitzhugh E., Brazil’s success in reducing deforestation. Trop. Conserv. Sci. 6, 426–445 (2013). [Google Scholar]
- 7.Nepstad D., Mcgrath D., Stickler C., Alencar A., Azevedo A., Swette B., Bezerra T., Digiano M., Shimada J., Seroa da Motta R., Armijo E., Castello L., Brando P., Hansen M. C., Mcgrath-Horn M., Carvalho O., Hess L., Slowing Amazon deforestation through public policy and interventions in beef and soy supply chains. Science 344, 1118–1123 (2014). [DOI] [PubMed] [Google Scholar]
- 8.Assunção J., Gandour C., Rocha R., Deforestation slowdown in the Brazilian Amazon: Prices or policies? Environ. Dev. Econ. 20, 697–722 (2015). [Google Scholar]
- 9.Tyukavina A., Baccini A., Hansen M. C., Potapov V, Stehman S. V, Houghton R. A., Krylov A. M., Turubanova S., Goetz S. J., Aboveground carbon loss in natural and managed tropical forests from 2000 to 2012. Environ. Res. Lett. 10, 074002 (2015). [Google Scholar]
- 10.Hansen M. C., Potapov V, Moore R., Hancher M., Turubanova S. A., Tyukavina A., Thau D., Stehman S. V, Goetz S. J., Loveland T. R., Kommareddy A., Egorov A., Chini L., Justice C. O., Townshend J. R. G., High-resolution global maps of 21-st century forest cover change. Science 342, 850–853 (2013). [DOI] [PubMed] [Google Scholar]
- 11.Houghton R. A., Carbon emissions and the drivers of deforestation and forest degradation in the tropics. Curr. Opin. Environ. Sustain. 4, 597–603 (2012). [Google Scholar]
- 12.Hosonuma N., Herold M., De Sy V., DeFries R. S., Brockhaus M., Verchot L., Angelsen A., Romijn E., An assessment of deforestation and forest degradation drivers in developing countries. Environ. Res. Lett. 7, 044009 (2012). [Google Scholar]
- 13.Asner G., Knapp D. E., Broadbent E. N., Oliveira J. C., Keller M., Silva J. N., Selective logging in the Brazilian Amazon. Science 310, 480–482 (2005). [DOI] [PubMed] [Google Scholar]
- 14.Souza C. M. Jr, Roberts D., Mapping forest degradation in the Amazon region with Ikonos images. Int. J. Remote Sens. 26, 425–429 (2005). [Google Scholar]
- 15.Olofsson P., Foody G. M., Herold M., Stehman S. V., Woodcock C. E., Wulder M. A., Good practices for estimating area and assessing accuracy of land change. Remote Sens. Environ. 148, 42–57 (2014). [Google Scholar]
- 16.Stehman S. V., Estimating area from an accuracy assessment error matrix. Remote Sens. Environ. 132, 202–211 (2013). [Google Scholar]
- 17.Global Forest Observations Initiative, Integration of Remote-Sensing and Ground-Based Observations for Estimation of Emissions and Removals of Greenhouse Gases in Forests: Methods and Guidance from the Global Forest Observations Initiative (Food and Agriculture Organization, ed. 2, 2016). [Google Scholar]
- 18.Putz F. E., Zuidema P. A., Synnott T., Peña-Claros M., Pinard M. A., Sheil D., Vanclay J. K., Sist P., Gourlet-Fleury S., Griscom B., Palmer J., Zagt R., Sustaining conservation values in selectively logged tropical forests: The attained and the attainable. Conserv. Lett. 5, 296–303 (2012). [Google Scholar]
- 19.Alencar A., Nepstad D., Vera C., Forest understory fire in the Brazilian Amazon in ENSO and non-ENSO years: Area burned and committed carbon emissions. Earth Interact. 10, 1–17 (2006). [Google Scholar]
- 20.Souza C. Jr, Siqueira J., Sales M., Fonseca A., Ribeiro J., Numata I., Cochrane M., Barber C., Roberts D., Barlow J., Ten-year Landsat classification of deforestation and forest degradation in the Brazilian Amazon. Remote Sens. 5, 5493–5513 (2013). [Google Scholar]
- 21.Morton D. C., Le Page Y., DeFries R., Collatz G. J., Hurtt G. C., Understorey fire frequency and the fate of burned forests in southern Amazonia. Philos. Trans. R. Soc. Lond. B Biol. Sci. 368, 20120163 (2013). [DOI] [PMC free article] [PubMed] [Google Scholar]
- 22.Lewis S. L., Brando M., Phillips O. L., Van Der Heijden G. M. F., Nepstad D., The 2010 Amazon drought. Science 331, 554 (2011). [DOI] [PubMed] [Google Scholar]
- 23.Zeng N., Yoon J.-H., Marengo J. A., Subramaniam A., Nobre C. A., Mariotti A., Neelin J. D., Causes and impacts of the 2005 Amazon drought. Environ. Res. Lett. 3, 014002 (2008). [Google Scholar]
- 24.Cochrane M. A., Fire science for rainforests. Nature 421, 913–919 (2003). [DOI] [PubMed] [Google Scholar]
- 25.Cochrane M. A., Laurance W. F., Synergisms among fire, land use, and climate change in the Amazon. AMBIO 37, 522–527 (2008). [DOI] [PubMed] [Google Scholar]
- 26.de Almeida C. A., Coutinho A. C., Esquerdo J. C. D. M., Adami M., Venturieri A., Diniz C. G., Dessay N., Durieux L., Gomes A. R., High spatial resolution land use and land cover mapping of the Brazilian Legal Amazon in 2008 using Landsat-5/TM and MODIS data. Acta Amaz. 46, 291–302 (2016). [Google Scholar]
- 27.Intergovernmental Panel on Climate Change, Good Practice Guidance for Land Use, Land-Use Change and Forestry (IPCC National Greenhouse Gas Inventories Programme, 2003). [Google Scholar]
- 28.Diniz C. G., de Almeida Souza A. A., Santos D. C., Dias M. C., Da Luz N. C., de Moraes D. R. V., Maia J. S. A., Gomes A. R., da Silva Narvaes I., Valeriano D. M., Maurano L. E. P., Adami M., DETER-B: The new Amazon near real-time deforestation detection system. IEEE J. Sel. Top. Appl. Earth Obs. Remote Sens. 8, 3619–3628 (2015). [Google Scholar]
- 29.Fieldpausch T. R., Rondon M. A., Fernandes E. C. M., Riha S. J., Wandelli E., Carbon and nutrient accumulation in secondary forests regenerating on pastures in Central Amazonia. Ecol. Appl. 14, 164–176 (2004). [Google Scholar]
- 30.Klink C. A., Machado R. B., Conservation of the Brazilian cerrado. Conserv. Biol. 19, 707–713 (2005). [Google Scholar]
- 31.Silva J. F., Fariñas M. R., Felfili J. M., Klink C. A., Spatial heterogeneity, land use and conservation in the cerrado region of Brazil. J. Biogeogr. 33, 536–548 (2006). [Google Scholar]
- 32.Spera S. A., Galford G. L., Coe M. T., Macedo M. N., Mustard J. F., Land-use change affects water recycling in Brazil’s last agricultural frontier. Glob. Chang. Biol. 22, 3405–3413 (2016). [DOI] [PubMed] [Google Scholar]
- 33.Ratana P., Huete A. R., Ferreira L., Analysis of cerrado physiognomies and conversion in the MODIS seasonal–temporal domain. Earth Interact. 9, 1–22 (2005). [Google Scholar]
- 34.N. C. Ferreira, L. G. Ferreira, M. E. Ferreira, M. Bustamante, and J. Ometto, Assessing deforestation related carbon emissions in the Brazilian savanna based on moderate resolution imagery, in 2011 IEEE International Geoscience and Remote Sensing Symposium (IGARSS) (IEEE, 2011), pp. 748–751. [Google Scholar]
- 35.Hansen M. C., Krylov A., Tyukavina A., Potapov V., Turubanova S., Zutta B., Ifo S., Margono B., Stolle F., Moore R., Humid tropical forest disturbance alerts using Landsat data. Environ. Res. Lett. 11, 034008 (2016). [Google Scholar]
- 36.Potapov P. V., Dempewolf J., Talero Y., Hansen M. C., Stehman S. V, Vargas C., Rojas E. J., Castillo D., Mendoza E., Calderón A., Giudice R., Malaga N., Zutta B. R., National satellite-based humid tropical forest change assessment in Peru in support of REDD+ implementation. Environ. Res. Lett. 9, 124012 (2014). [Google Scholar]
- 37.Tyukavina A., Stehman S. V., Potapov P.V., Turubanova S. A., Baccini A., Goetz S. J., Laporte N. T., Houghton R. A., Hansen M. C., National-scale estimation of gross forest aboveground carbon loss: A case study of the Democratic Republic of the Congo. Environ. Res. Lett. 8, 1–14 (2013). [Google Scholar]
- 38.Olson D. M., Dinerstein E., Wikramanayake E. D., Burgess N. D., Powell G. V. N., Underwood E. C., D’Amico J. A., Itoua I., Strand H. E., Morrison J. C., Loucks C. J., Allnutt T. F., Ricketts T. H., Kura Y., Lamoreux J. F., Wettengel W. W., Hedao P., Kassem K. R., Terrestrial ecoregions of the world: A new map of life on Earth. Bioscience 51, 933–938 (2001). [Google Scholar]
- 39.Y. E. Shimabukuro, J. R. dos Santos, A. R. Formaggio, V. Duarte, B. F. T. Rudorff, The Brazilian Amazon monitoring program: PRODES and DETER projects, in Global Forest Monitoring from Earth Observation (CRC Press, 2012), p. 354. [Google Scholar]
- 40.Potapov P. V., Turubanova S. A., Hansen M. C., Adusei B., Broich M., Altstatt A., Mane L., Justice C. O., Quantifying forest cover loss in Democratic Republic of the Congo, 2000–2010, with Landsat ETM + data. Remote Sens. Environ. 122, 106–116 (2012). [Google Scholar]
- 41.W. G. Cochran, Sampling Techniques (John Wiley & Sons, ed. 3, 1977). [Google Scholar]
- 42.Asner G. P., Keller M., Silva J. N. M., Spatial and temporal dynamics of forest canopy gaps following selective logging in the eastern Amazon. Glob. Chang. Biol. 10, 765–783 (2004). [Google Scholar]
- 43.Broadbent E. N., Asner G. P., Keller M., Knapp D. E., Oliveira P. J. C., Silva J. N., Forest fragmentation and edge effects from deforestation and selective logging in the Brazilian Amazon. Biol. Conserv. 141, 1745–1757 (2008). [Google Scholar]
- 44.Giglio L., Characterization of the tropical diurnal fire cycle using VIRS and MODIS observations. Remote Sens. Environ. 108, 407–421 (2007). [Google Scholar]
- 45.Aide T. M., Zimmerman J. K., Pascarella J. B., Rivera L., Marcano-Vega H., Forest regeneration in a chronosequence of tropical abandoned pastures: Implications for restoration ecology. Restor. Ecol. 8, 328–338 (2000). [Google Scholar]
- 46.Gourlet-Fleury S., Mortier F., Fayolle A., Baya F., Ouédraogo D., Bénédet F., Picard N., Tropical forest recovery from logging: A 24 year silvicultural experiment from Central Africa. Philos. Trans. R. Soc. Lond. B Biol. Sci. 368, 20120302 (2013). [DOI] [PMC free article] [PubMed] [Google Scholar]
- 47.Nogueira E. M., Yanai A. M., Fonseca F. O. R., Fearnside P. M., Carbon stock loss from deforestation through 2013 in Brazilian Amazonia. Glob. Chang. Biol. 21, 1271–1292 (2015). [DOI] [PubMed] [Google Scholar]
- 48.Zarin D. J., Harris N. L., Baccini A., Aksenov D., Hansen M. C., Azevedo-Ramos C., Azevedo T., Margono B. A., Alencar A. C., Gabris C., Allegretti A., Potapov P., Farina M., Walker W. S., Shevade V. S., Loboda T. V., Turubanova S., Tyukavina A., Can carbon emissions from tropical deforestation drop by 50% in 5 years? Glob. Chang. Biol. 22, 1336–1347 (2016). [DOI] [PMC free article] [PubMed] [Google Scholar]
- 49.Baccini A., Goetz S. J., Walker W. S., Laporte N. T., Sun M., Sulla-Menashe D., Hackler J., Beck P. S. A., Dubayah R., Friedl M. A., Samanta S., Houghton R. A., Estimated carbon dioxide emissions from tropical deforestation improved by carbon-density maps. Nat. Clim. Chang. 2, 182–185 (2012). [Google Scholar]
- 50.Saatchi S. S., Harris N. L., Brown S., Lefsky M., Mitchard E. T. A., Salas W., Benchmark map of forest carbon stocks in tropical regions across three continents. Proc. Natl. Acad. Sci. U.S.A. 108, 9899–9904 (2011). [DOI] [PMC free article] [PubMed] [Google Scholar]
- 51.Avitabile V., Herold M., Heuvelink G. B. M., Lewis S. L., Phillips O. L., Asner G. P., Armston J., Ashton P. S., Banin L., Bayol N., Berry N. J., Boeckx P., De Jong B. H. J., DeVries B., Girardin C. A. J., Kearsley E., Lindsell J. A., Lopez-Gonzalez G., Lucas R., Malhi Y., Morel A., Mitchard E. T. A., Nagy L., Qie L., Quinones M. J., Ryan C. M., Ferry S. J. W., Sunderland T., Vaglio Laurin G., Cazzolla Gatti R., Valentini R., Verbeeck H., Wijaya A., Willcock S., An integrated pan-tropical biomass map using multiple reference datasets. Glob. Chang. Biol. 22, 1406–1420 (2016). [DOI] [PubMed] [Google Scholar]
- 52.Mitchard E. T. A., Feldpausch T. R., Brienen R. J. W., Lopez-Gonzalez G., Monteagudo A., Baker T. R., Lewis S. L., Lloyd J., Quesada C. A., Gloor M., ter Steege H., Meir P., Alvarez E., Araujo-Murakami A., Aragão L. E. O. C., Arroyo L., Aymard G., Banki O., Bonal D., Brown S., Brown F. I., Cerón C. E., Moscoso V. C., Chave J., Comiskey J. A., Cornejo F., Medina M. C., Da Costa L., Costa F. R. C., Di Fiore A., Domingues T. F., Erwin T. L., Frederickson T., Higuchi N., Coronado E. N. H., Killeen T. J., Laurance W. F., Levis C., Mangusson W. E., Marimon B. S., Marimon B. H. Jr, Polo I. M., Mishra P., Nascimento M. T., Neill D., Núñez Vargas M. P., Palacios W. A., Parada A., Molina G. P., Peña-Claros M., Pitman N., Peres C. A., Poorter L., Prieto A., Ramirez-Angulo H., Restrepo Correa Z., Roopsind A., Roucoux K. H., Rudas A., Salomão R. P., Schietti J., Silveira M., de Souza P. F., Steininger M. K., Stropp J., Terborgh J., Thomas R., Toledo M., Torrez-Lezama A., van Andel T. R., van der Heijden G. M. F., Vieira I. C. G., Vieira S., Vilanova-Torre E., Vos V. A., Wang O., Zartman C. E., Malhi Y., Philips O. L., Markedly divergent estimates of Amazon forest carbon density from ground plots and satellites. Glob. Ecol. Biogeogr. 23, 1–12 (2014). [DOI] [PMC free article] [PubMed] [Google Scholar]
- 53.Mitchard E. T. A., Saatchi S. S., Baccini A., Asner G. P., Goetz S. J., Harris N. L., Brown S., Uncertainty in the spatial distribution of tropical forest biomass: A comparison of pan-tropical maps. Carbon Balance Manag. 8, 10 (2013). [DOI] [PMC free article] [PubMed] [Google Scholar]
Associated Data
This section collects any data citations, data availability statements, or supplementary materials included in this article.
Supplementary Materials
Supplementary material for this article is available at http://advances.sciencemag.org/cgi/content/full/3/4/e1601047/DC1
table S1. Total 2001–2013 forest cover loss in BLA by disturbance type and forest type (Mha ± SE).
table S2A. Annual forest cover loss in BLA by disturbance type in all forests (Mha ± SE).
table S2B. Annual tree cover loss in BLA by forest type (Mha ± SE), all disturbance types.
table S3. Annual tree cover loss in BLA by major disturbance types and types of forest cover (Mha ± SE).
table S4. Disturbance types by state and forest type (Mha ± SE), corresponding to Fig. 3.
table S5. Annual human forest clearing by state and forest type (Mha ± SE), corresponding to Fig. 5.


