

Summary
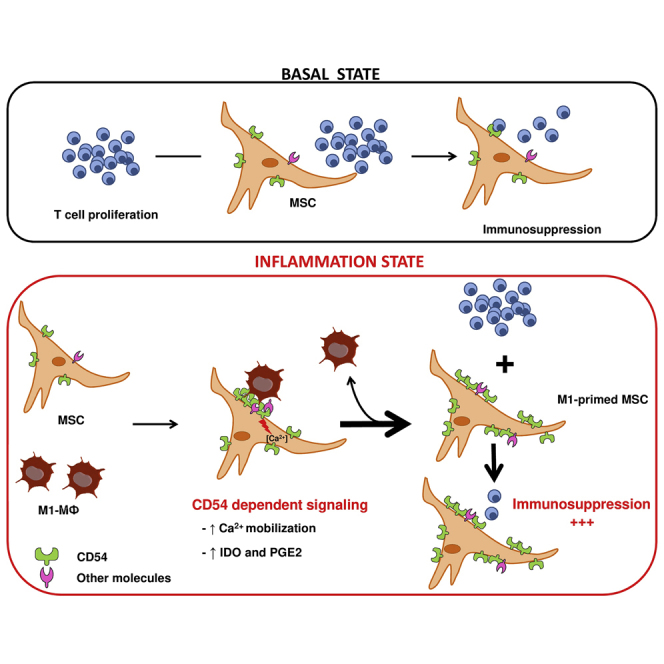
Mesenchymal stromal cells (MSCs) sense and modulate inflammation and represent potential clinical treatment for immune disorders. However, many details of the bidirectional interaction of MSCs and the innate immune compartment are still unsolved. Here we describe an unconventional but functional interaction between pro-inflammatory classically activated macrophages (M1MΦ) and MSCs, with CD54 playing a central role. CD54 was upregulated and enriched specifically at the contact area between M1MФ and MSCs. Moreover, the specific interaction induced calcium signaling and increased the immunosuppressive capacities of MSCs dependent on CD54 mediation. Our data demonstrate that MSCs can detect an inflammatory microenvironment via a direct and physical interaction with innate immune cells. This finding opens different perspectives for MSC-based cell therapy.
Keywords: macrophages; bone marrow mesenchymal stromal cells; functional interaction; CD54; immunosuppression; indoleamine 2,3-dioxygenase; cell therapy
Graphical Abstract
Highlights
-
•
Unconventional but functional interaction between M1MФ and MSCs
-
•
CD54-dependent M1MФ-MSC interaction increases MSC immunosuppressive properties
-
•
First characterization of physical interaction between stromal cells and MΦ
Mesenchymal stromal cells (MSCs) are promising for cell-based therapy in inflammatory disorders by switching off the immune response. Varin and colleagues demonstrate that MSCs and inflammatory macrophages communicate via an unconventional but functional interaction that strongly increases the immunosuppressive capacities of MSCs. This new communication between the innate immune system and MSCs opens new perspectives for MSC-based cell therapy.
Introduction
Mesenchymal stromal cells (MSCs) are adult multipotent stromal cells that can differentiate into tissue of mesodermal origin such as osteoblasts, adipocytes, and chondroblasts (Friedenstein et al., 1976, Pittenger et al., 1999). Originally isolated from bone marrow (BM) (Friedenstein et al., 1976), MSC-like cells are present in all tissues (Crisan et al., 2008). For example, they are found in adipose tissue (adipose stromal cells; ASCs), cord blood, and placenta (Im et al., 2005, Zuk et al., 2002).
In the beginning, MSCs were used to correct bone disorders (Horwitz et al., 1999) and large bone defects (Quarto et al., 2001); however, increasing clinical and basic investigations have demonstrated the successful use of MSCs to treat immune-mediated disorders such as graft-versus-host disease (Le Blanc et al., 2004) and autoimmune diseases (Gao et al., 2016). The benefits of MSCs are associated with their broad immunoregulatory properties, which modulate both adaptive and innate immunity (Di Trapani et al., 2013). Indeed, MSCs can inhibit T cell proliferation and natural killer cell functions (Di Nicola et al., 2002, Krampera et al., 2003) and polarize T cells toward a regulatory phenotype (Maccario et al., 2005) by secreting immunomodulatory factors such as indoleamine 2,3-dioxygenase (IDO) (Frumento et al., 2002) and prostaglandin E2 (PGE2) (Spaggiari et al., 2008). Recent data showed that MSCs inhibit the maturation and function of monocyte-derived dendritic cells (Spaggiari et al., 2009) as well as activation of macrophages.
Macrophages, key elements of initiation and control of inflammation (Mantovani et al., 2013), can be polarized in response to their microenvironment and adapt their function during the different phases of the immune response. Macrophages are typically divided into two types: classically activated macrophages (M1MΦ) and alternatively activated macrophages (M2MΦ) (Mosser and Edwards, 2008). Classically activated M1MΦ, induced by interferon-γ (IFN-γ) + lipopolysaccharide (LPS), display potent antimicrobial activities associated with a high production of pro-inflammatory cytokines, production of nitric oxide, and respiratory burst. Alternatively activated M2MΦ, induced by T helper 2 (Th2) cell cytokines (interleukin-4 [IL-4] and IL-13), are characterized by low production of pro-inflammatory cytokines such as IL-12 and high production of anti-inflammatory cytokines such as IL-10. They play a role in the resolution of inflammation and the promotion of humoral immunity against parasites and tissue repair (Gordon, 2003, Wynn and Vannella, 2016).
MSCs and macrophages are the only cells present in all tissues, and both play an essential role in tissue homeostasis. For example, their interaction plays major role in physiological bone remodeling in adjusting the osteoblast-osteoclast balance (Varin et al., 2013) but is also associated with bone defect pathologies in which the osteoblast-osteoclast balance is dysregulated (Garcia-Gomez et al., 2014).
Different studies demonstrated that MSCs interact with macrophages and affect their functions. Human MSCs turn LPS-activated macrophages into a regulatory-like phenotype, characterized by increased production of anti-inflammatory cytokines and low secretion of pro-inflammatory cytokines (Maggini et al., 2010). Moreover, MSCs can reprogram lung macrophages, modifying their secretory profile and decreasing general inflammation and septicemia (Nemeth et al., 2009). These in vitro and in vivo studies confirmed that MSCs are regulators of the very early phases of inflammation and modulate the inflammatory response mediated by macrophages (Prockop, 2013).
Interestingly, MSCs, as sensors of microenvironment, acquire a phenotype dependent on the inflammation state (Bernardo and Fibbe, 2013). Pro-inflammatory cytokines (tumor necrosis factor α [TNF-α], IFN-γ, IL-1β) modify the secretory profile of MSCs that induces T cell recruitment (Ren et al., 2010). Different Toll-like receptor activation can polarize MSCs into an inflammatory or anti-inflammatory phenotype (Waterman et al., 2010). In this context, soluble factors produced by macrophages induce a pro-inflammatory and pro-migratory phenotype in MSCs (Anton et al., 2012). Nevertheless, the interaction between MФ and MSCs and its effect on the MSC immunosuppressive properties have never been characterized.
Here we describe a functional contact between MФ and MSCs. We used a microarray transcriptome assay to identify the adhesion protein CD54 as a key molecule in the crosstalk between M1MФ and MSCs. Moreover, this interaction, via the CD54 molecule, induced calcium signaling and increased the immunosuppressive abilities dependent on IDO activation in MSCs. We demonstrate a specific physical interaction between pro-inflammatory MФ and MSCs that totally modifies their immunosuppressive functions and will lead to a re-evaluation of the optimal use of MSCs for cell therapy.
Results
Gene Expression Profiling of MSCs after Contact with Innate Immune Cells
To determine the impact of MФ on MSC gene expression, we cultivated BM-derived MSCs (Figure S1) with in vitro-generated pro-inflammatory (M1MФ) or anti-inflammatory (M2MФ) macrophages for 24 hr. After magnetic separation based on CD45 expression (Figure S2), gene expression profiles of MSCs or macrophage-primed MSCs were determined by using the Human GeneChip 1.1 ST Array Strip (Affymetrix). Principal component analysis highlighted a clear distinction of M1MФ-primed MSCs (M1-MSCs) from MSCs and M2MФ-primed MSCs (M2-MSCs) (Figure 1A). Consistent with the idea that MSCs are sensors of the inflammatory environment (Bernardo and Fibbe, 2013), interaction with pro-inflammatory M1MФ modulated a higher number of genes in MSCs than did interaction with anti-inflammatory M2MФ. Indeed, we identified a transcriptional signature of 559 genes whose expression was altered (less or more than 2-fold) in M1-MSCs relative to their expression in MSCs, whereas only 41 genes were differentially expressed in M2-MSCs compared with unprimed MSCs (Figure 1B). These results confirm that the gene expression of MSCs is differentially modulated by the type of macrophage environment.
Figure 1.

Microarray Analysis of the Effect of Pro-inflammatory and Anti-inflammatory Macrophages on Mesenchymal Stromal Cells
MSCs were cultivated alone (MSC), or with pro-inflammatory (M1MФ; M1-MSC) or anti-inflammatory (M2MФ; M2-MSC) MSCs for 24 hr. After magnetic separation, microarray assay was realized.
(A) Principal component analysis of total gene expression. Draw of ellipsoids encompassing the individual data points: MSCs (green; 3 samples), M1-MSCs (red; 3 samples), M2-MSCs (blue; 4 samples). Note that the dots for MSCs (green) and M2-MSCs (blue) are grouped together (Partek).
(B) Venn diagram of total genes modulated in MSCs after contact with M1MФ (M1-MSCs) or M2MФ (M2-MSCs). Gene expression analysis (genes with a fold change ≥2 and false discovery rate [ANOVA] <0.05).
(C) Functional analysis of 559 modulated genes in M1-MSCs.
(D) Heatmap based on the expression of genes coding for proteins involved in immunosuppressive capacities of MSCs (see log2 expression scale).
See also Figure S3.
Functional analysis with the Ingenuity pathway-classification system demonstrated that M1-MSCs showed a significant enrichment of genes involved in cell-mediated immune response, cell-to-cell interaction and signaling, immune cell trafficking, and inflammatory response (Figure 1C). MSCs showed wide immunomodulation capacities, associated with secretion of soluble factors such as PGE2, TNF-stimulated gene 6 (TSG6), and IDO (Ren et al., 2008) as well as the expression of membrane proteins such as CD54 (Ren et al., 2010). Therefore, we analyzed the expression of a set of genes coding for the main proteins involved in the immunosuppressive properties of MSCs and described in the literature (Figures 1D and S3). All three M1-MSC samples clustered together and separately from the others, whereas MSC and M2-MSC samples were mixed and clustered. Surprisingly, M1MФ increased the expression of only a few immunomodulatory genes in MSCs. M1-MSCs expressed a higher level of IDO (fold increase [FI], 5.93; p = 1.4 × 10⁻⁵) compared with MSCs alone or M2-MSCs (FI, 1.19; p = 0.31). qPCR analysis confirmed that M1-MSCs expressed more IDO and COX2 compared with MSC or M2-MSCs. The gene expression of other soluble immunosuppressive molecules such as TSG6 and HMOX were not modified by MSCs on interaction with M1MФ (Figure S3). Also, genes encoding for two proteins, programmed death-ligand 1 (PDL-1) and CD54, involved in the interaction of MSCs with T lymphocytes, showed greater expression in M1-MSCs than MSCs and M2-MSCs (PDL-1: M1-MSC FI, 6.76, p = 1.1 × 10⁻³; M2-MSC FI, 1.03, p = 0.93; CD54: M1-MSC FI, 8.52, p = 7.3 × 10⁻⁴; M2-MSC FI, 1.47, p = 0.31). Finally, the gene expression was higher for MI-MSCs than M2-MSCs for chemokine (C-X-C motif) ligand 9 (CXCL9 : M1-MSC FI, 91.36, p = 2.2 × 10⁻⁸; M2-MSC FI, 1.02, p = 0.9) and CXCL10 (M1-MSC FI, 31.13, p = 1.5 × 10⁻⁶; M2-MSC FI, −1.03, p = 0.91), involved in T cell trafficking (Figure S3). Thus, MSCs adopted a different transcriptome profile on contact with inflammatory macrophages, which seemed to modulate the MSC effect on the T cell compartment.
Contact Is Essential for the M1MФ Effect on the Immunosuppressive Properties of MSCs
Microarray data showed that pro-inflammatory macrophages modulated the expression of genes involved in the immunosuppressive capacities of MSCs. To confirm these results, we co-cultivated MSCs with M1MФ or M2MФ for 24 hr. After magnetic separation based on CD45 expression (Figure S2), the immunosuppression capacity (IS) of M1-MSCs was assayed by incubation with CD3/CD28-activated CFSE-labeled T lymphocytes for 5 days. Inhibition of T cell proliferation was stronger with M1-MSCs than with MSCs alone and M2-MSCs (M1-MSC IS, 64.6% ± 8.44%; MSC IS, 28.95% ± 6.59%; M2-MSC IS, 30.11% ± 6.65%) (Figure 2A). In contrast, M1- or M2-MSCs inhibited B lymphocyte proliferation to the same extent as unprimed MSCs (Figure S4); therefore, M1MФ specifically modified the effect of MSCs on T cell proliferation.
Figure 2.

Interaction with M1MФ Increased Immunosuppressive Properties of MSCs by Upregulating PGE2 Secretion and IDO Activation
(A) MSCs were cultivated alone or with M1MФ or M2MФ for 24 hr. After magnetic separation, immunosuppression capacity of MΦ-primed MSCs was assayed. Data are mean percentage immunosuppression ± SEM (n = 10 independent experiments). ∗∗p < 0.01.
(B) Percentage of Th1 (IFN-γ+) and Th2 (IL-4+) T cells induced after co-culture with MSCs unprimed or primed for 24 hr with M1MФ or M2MФ. Data are mean percentage of positive cells ± SEM (n = 3 independent experiments).
(C) MSCs were co-cultured (CC) with MΦ or cultivated in a Transwell system (TW) for 24 hr. After magnetic separation, immunosuppression properties of MSCs were assayed as described. Data are mean percentage immunosuppression ± SEM (n = 3 independent experiments). ∗p < 0.05; ns, not significant.
(D and E) MSCs were co-cultured (CC) or cultivated in a TW system with M1MФ or M2MФ for 24 hr. After sorting, MSCs or MΦ-primed MSCs were plated for 24 hr and supernatants were harvested. (D) L-Kynurenin and tryptophan concentration were assayed by ELISA and L-kynurenin/tryptophan ratio was determined to evaluate IDO enzymatic activity. (E) PGE2 secretion was measured to evaluate COX2 enzymatic activity. Data are mean ± SEM kynurenin/tryptophan ratio (n = 4 independent experiments) and PGE2 concentration (n = 5 independent experiments). ∗p < 0.05, ∗∗p < 0.01, ∗∗∗p < 0.001; ns, not significant.
MSCs can modify the balance between pro-inflammatory Th1 cells (producers of IFN-γ) and anti-inflammatory Th2 T lymphocytes (producers of IL-4) after CD3/CD28 T cell activation (Duffy et al., 2011a, Duffy et al., 2011b). As expected, CD3/CD28-stimulated T cells produced more IFN-γ and less IL-4 content compared with unstimulated T cells (15.32% of IL-4+ cells, 24.96% of IFN-γ+ cells), whereas unprimed MSCs showed decreased IFN-γ+ Th1 cell generation and increased proportion of IL-4+ Th2 cells (32.16% of IL-4+ cells, 15.31% of IFN-γ+ cells). M1- or M2-MSCs had a similar effect as unprimed MSCs on the T cell phenotype (Figure 2B).
To determine the role of cell-to-cell interaction in the effect of macrophage co-culture on MSC function, we compared the immunosuppressive capacities of MSCs after co-culture with macrophages in a Transwell contact-free system (TW) or co-culture system (CC). Culture of MSCs with M1MФ with the TW system abolished the increased immunosuppressive capacity induced by M1MФ (TW, 17.59% ± 17% versus CC, 51.39% ± 11.2%) (Figure 2C). The immunosuppressive properties of M2-MSCs were not modified by the TW system (TW, 11.48% ± 4.52% versus CC, 8.923% ± 2.1%). Thus, the effect of M1MФ on the MSC immunosuppressive function depended on the contact between both cell types.
We determined whether soluble factors, known to be involved in inhibition of T cell proliferation, could play a role in our system. MSCs were cultivated 24 hr with M1MФ or M2MФ. After magnetic separation, primed MSCs were cultivated for 24 hr, after which we measured IDO activity (L-kynurenin/tryptophan ratio) and PGE2 content. Contact between M1MФ and MSCs was required to increase IDO activity (Figure 2D) but was not essential for PGE2 secretion (Figure 2E).
All of these results demonstrate that the M1MФ priming effect on MSCs is contact dependent and is specific to immunomodulation of the T cell compartment.
CD54 Is Upregulated and Polarized at the M1MФ-MSC Interface
The effect of M1MФ on MSC function depends on the direct interaction between the two cell types, so we evaluated the expression of adhesion molecules at the MSC surface after 24 hr co-culture with M1MФ or M2MФ. Co-culture of MSCs with M1MФ strongly increased CD54 level at the MSC surface (mean fluorescence intensity [MFI]: M1-MSCs, 566.9 versus MSCs, 44.0); this increase was contact dependent and was specifically induced by M1MФ (MFI of M1-MSC: CC, 566.9 versus TW, 81.66; M2-MSC: CC, 91.01 versus TW, 21.37) (Figures 3A and 3B). Moreover, the effect was specific to CD54, because the expression of other adhesion molecules at the MSC surface, such as CD106, CD200, CD56, and CD90, was not modulated by MΦ priming (Figure 3B).
Figure 3.

M1MФ-MSC Interaction Specifically Increased CD54 Expression on MSCs
Expression of CD54 (A), and CD106, CD200, CD56, and CD90 (B) on MSCs after 24 hr of co-culture (CC) or TW system assay with or without M1MФ or M2MФ. Data in the figure and table are mean fluorescence intensity ± SEM (n = 4 independent experiments). ∗p < 0.05, ∗∗p < 0.01, ∗∗∗p < 0.001.
To localize CD54 during MSC and MФ interaction, we used a multispectral cytometric technology (ImageStreamX) that enables the capture of high-resolution images of cells. We selected focus cells based on the “gradient root-mean-square (RMS)” feature, gated on the CD45-CD90 doublet-positive cells, and selected the doublet-like cells based on an area-versus-aspect ratio plot (Figure 4A). The interface feature was used to define the interaction between the two generated masks based on CD90 (MSC) and CD45 expression (MФ) (Figure 4B). Flow microscopy analysis confirmed the increased CD54 expression on MSCs after co-culture with M1MФ (Figures 4C [top] and 4D). Furthermore, CD54 polarized at the M1MФ-MSC contact area (Figures 4C and 4E). Interaction between M2MФ and MSCs also induced accumulation of CD54, but to a lesser extent than with the M1MФ-MSC interaction (Figures 4C [bottom] and 4E).
Figure 4.

Polarization of CD54 at the Contact Area between MSC and M1MФ
MSCs were co-cultured with M1MФ or M2MФ for 24 hr, then cells were detached and stained with antibodies for CD90-FITC (green), CD54-PE (yellow), and CD45-APC-Vio770 (pink) and analyzed using ImageStreamX.
(A) Strategy for collection and analysis of MSC-MФ interaction. Focused events were selected by plotting the gradient RMS feature of channel 1. Furthermore, we gated on CD45 (MФ; channel 6)-CD90 (MSC; channel 2) doublet-positive cells and selected the doublet cells based on an area-versus-aspect ratio plot.
(B) Example of the interface mask defining the region where CD54 intensity was measured. MФ and MSCs were defined by using “morphology” masks based on CD90 (MSC) and CD45 (MФ) markers, and the interface feature was used to define the interaction between the two generated masks (CD90 and CD45).
(C–E) Examples of CD54 localization at the M1MФ-MSC and M2MФ-MSC interface (C). CD54 fluorescence intensity on the MSC cell surface (D) and at the interface between MФ and MSCs (E). Data are mean fluorescence intensity ± SEM (n = 4 independent experiments).
M1MФ-MSC Contact Did Not Induce Cytoskeletal Rearrangement but Triggered Ca2+ Signaling in MSCs
CD54 is a key molecule involved in the immunologic synapse formation, which is characterized by the reorganization of the cytoskeleton toward the target cell (Grakoui et al., 1999). Therefore, we investigated whether the M1MФ-MSC interaction was associated with a rearranged cytoskeleton. Confocal microscopy highlighted strong interactions between M1MФ and MSCs (Figure 5). However, the tubulin cytoskeleton seemed to be random, without polarization of the microtubule-organizing center in both cell types (Figure 5A). Similarly, the actin cytoskeleton did not polarize toward MSCs or macrophages during their interaction (Figure 5B). Similar data were obtained with the M2MФ-MSC interaction (Figure 5C).
Figure 5.

M1MФ Interacted with MSCs but Did Not Induce Cytoskeletal Polarization
(A) MSCs were cultivated with M1MФ for 15 min and cells were fixed and labeled with anti-tubulin antibody (green). Secondary antibodies were used as a negative control.
(B) M1MФ-MSC conjugates stained with antibodies for actin (green) and tubulin (blue) (top). M1MФ-MSC conjugate stained with antibodies for tubulin (green) and CD54 (blue) (bottom). Images from bright-field (DIC) and overlapped staining (Merge) are shown. MФ = M1MΦ.
(C) M2MФ-MSC conjugates stained with antibodies for actin (green) and tubulin (blue). Images are representative of three independent experiments.
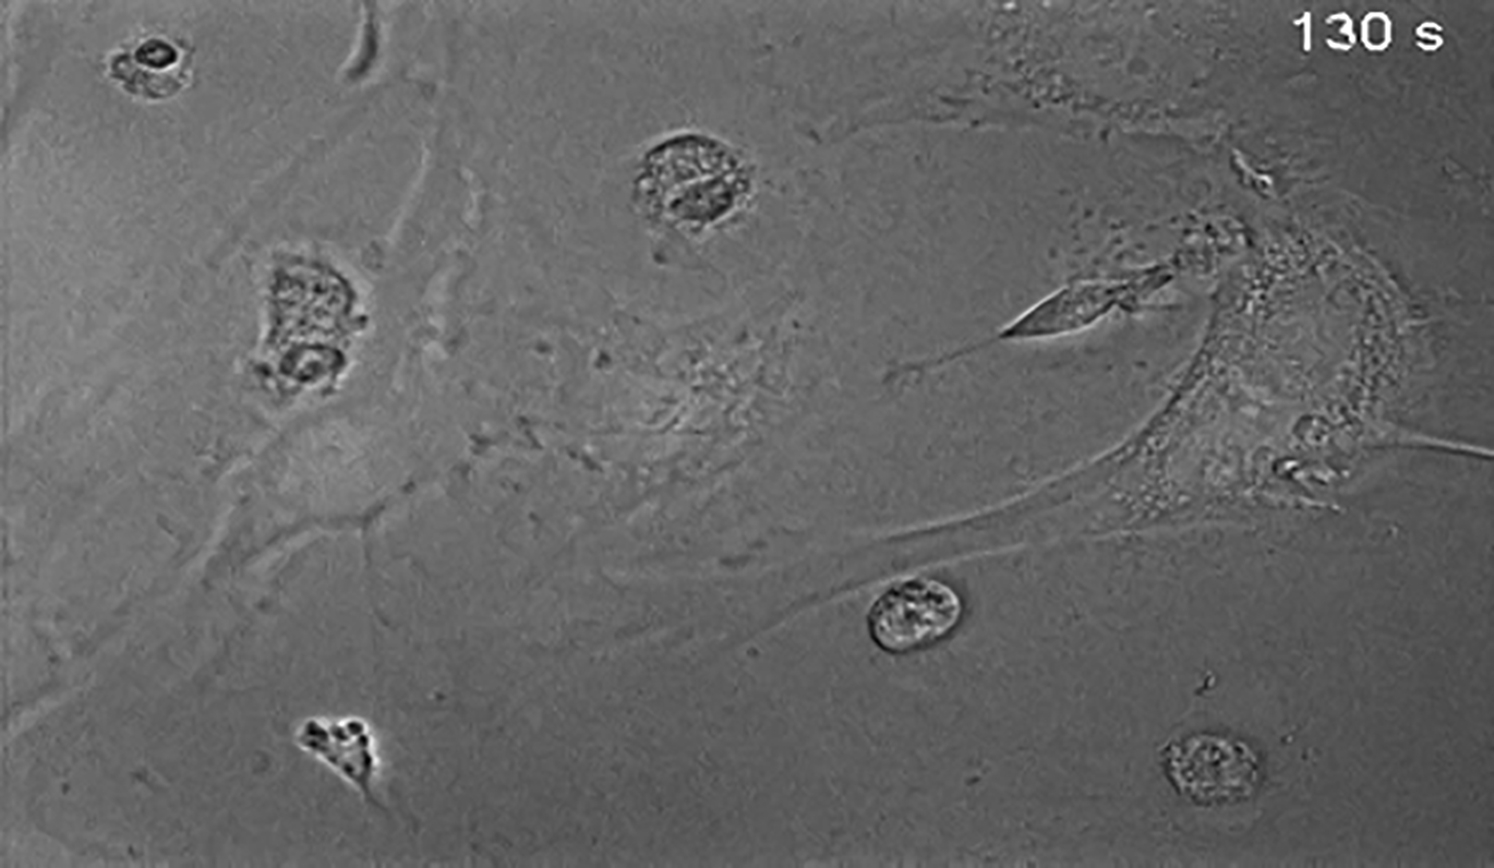
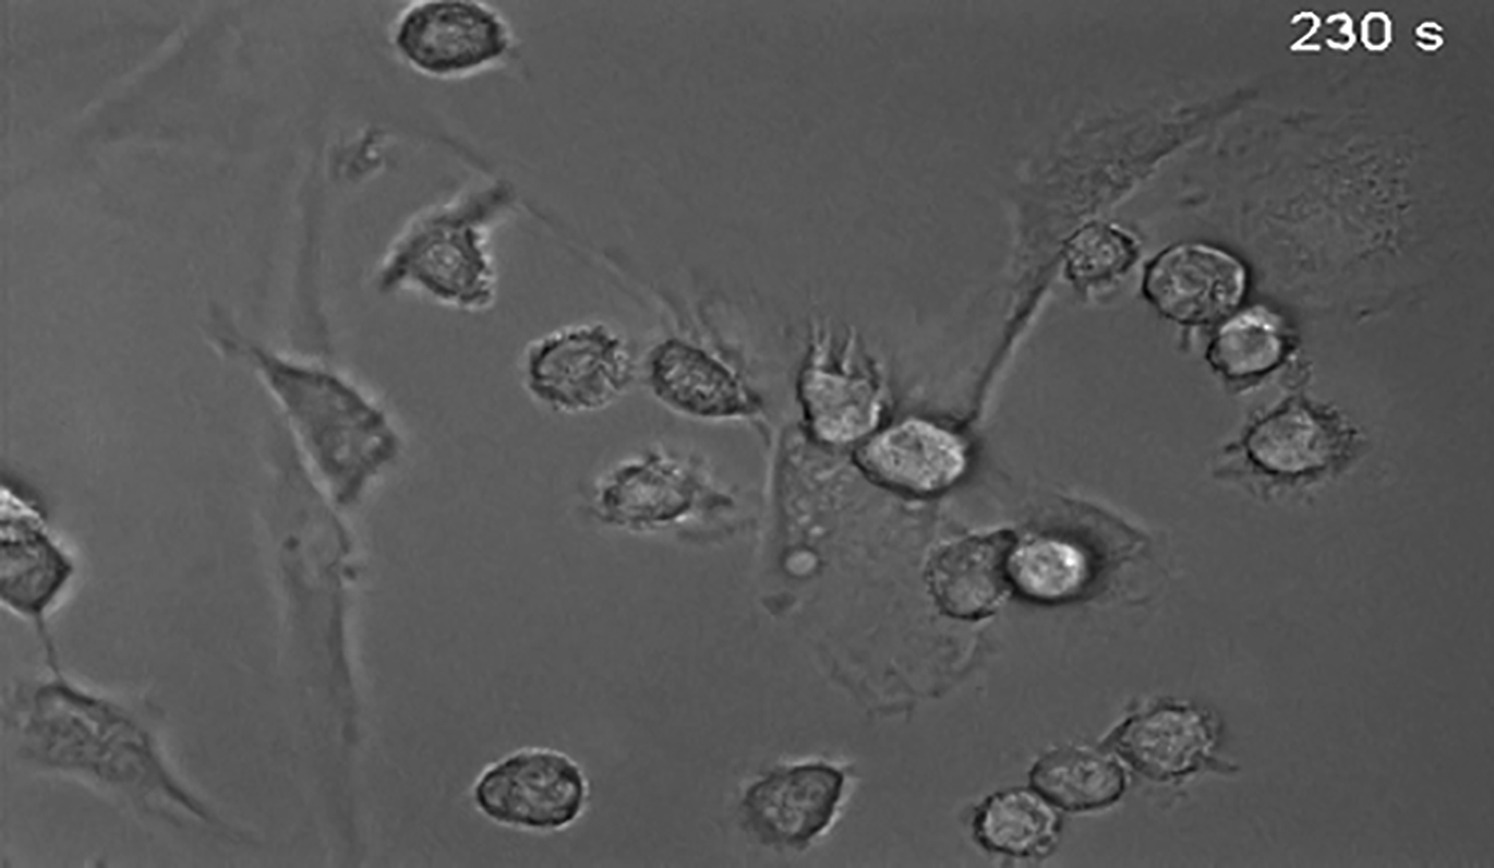
Even in the absence of cytoskeletal rearrangement, the interaction of MSCs with M1MФ triggered intracellular calcium ([Ca2+]i) signaling in MSCs (Figure 6). When MSCs were cultivated alone (Figures 6A and 6D; Movie S1) or with M2MФ (Figures 6C and 6D; Movie S3), [Ca2+]i content was not modified, despite the cell-to-cell interaction, whereas contact between M1MФ and MSCs significantly increased the basal and maximum values of [Ca2+]i mobilization in MSCs (Figures 6B and 6D; Movie S2). In addition, the effect on [Ca2+]i mobilization in MSCs was macrophage specific because interaction with T lymphocytes did not modulate [Ca2+]i in MSCs (Movie S4).
Figure 6.

M1MФ Interacting with MSCs Increased Intracellular Ca2+ Mobilization in MSCs
MSCs were cultivated with or without M1MФ or M2MФ for 24 hr. Cells were labeled with Fura-2-AM, and 340-/380-nm fluorescence signal ratio was recorded. All snapshots represent the 340/380 ratio intensity by a pseudocolor scale. In the first image of each snapshot, MSCs are indicated with white dots and macrophages are highlighted by an orange line. The calcium flux is indicated with the arrow.
(A–C) Snapshot sequence of Movies S1 (A), S2 (B), and S3 (C).
(D) The bars represent the mean minimum and maximal intensity of 340/380 ratio ± SEM (n = 5 independent experiments). ∗∗p < 0.01, ∗∗∗p < 0.001.
Altogether, our data demonstrate that interaction with pro-inflammatory macrophages did not induce cytoskeletal rearrangement of MSCs but modified [Ca2+]i mobilization and activated an intracellular signaling cascade in MSCs.
CD54 Is Essential for Modulating the MSC Function by Innate Inflammatory Cells
As described, CD54 crosslinking induced [Ca2+]i signaling (Etienne-Manneville et al., 2000), and in our system CD54 was upregulated in M1-MSCs and accumulated at the M1MΦ-MSC interface. Therefore, to study the functional effect of CD54 in the M1MΦ-MSC interaction, we treated MSCs with neutralizing anti-CD54 or control antibodies (immunoglobulin G [IgG]) for 1 hr and co-cultivated them with polarized macrophages for 4 hr before [Ca2+]i mobilization assays. Blocking CD54 at the MSC surface inhibited the increased [Ca2+]i mobilization induced by contact with M1MФ but had no effect on calcium signaling for MSCs alone or MSCs interacting with M2MФ (Figure 7A and Movie S5). Thus, CD54 is a key molecule involved in the signal induced by the M1MФ-MSC interaction.
Figure 7.

CD54 Is Essential in Modulating the MSC Function with M1MФ Interaction
(A) CD54 is essential to the M1MФ-induced Ca2+ signaling in MSCs. MSCs were pretreated with isotype control (IgG) or anti-CD54 antibody and cultivated for 4 hr with or without M1MФ or M2MФ. Cells were labeled with Fura-2-AM, and the 340/380 ratio was recorded. Data are mean minimum and maximal intensity of 340/380 ratio ± SEM (n = 3 independent experiments). ∗∗p < 0.01, ∗∗∗p < 0.001.
(B and C) CD54 is required for the effect of M1MФ on the immunosuppressive activity of MSCs. MSCs were pretreated with control antibody (IgG) or anti-CD54 antibody, and cultivated for 24 hr with or without M1MФ or M2MФ.
(B) After separation, the immunosuppression capacity of MΦ-primed MSCs was assayed. Data are mean percentage immunosuppression ± SEM (n = 3 independent experiments). ∗p < 0.05.
(C) ELISA of kynurenin and tryptophan (IDO enzymatic activity) in MSCs with or without IFN-γ treatment for 24 hr after magnetic separation. Data are mean kynurenin/tryptophan ratio ± SEM (n = 4 independent experiments). ∗p < 0.05.
Next, we wondered whether CD54 is involved in the effect of M1MФ on modulating the immunosuppressive capacities of MSCs. MSCs pretreated with control antibodies or anti-CD54 antibody were co-cultivated with polarized macrophages, and after magnetic sorting the immunosuppressive capacity of unprimed or macrophage-primed MSCs was evaluated. Anti-CD54 antibody did not affect the immunosuppressive capacities of MSCs cultured alone or with M2MФ. As expected, the immunosuppressive capacity was stronger for MSCs co-cultivated with M1MФ than for MSCs cultured alone or with M2MФ after IgG pretreatment. Anti-CD54 antibody prevented the increased immunosuppressive capacities induced by the M1MФ-MSC interaction, and M1-MSCs reverted to having similar immunosuppressive properties as basal MSCs (Figure 7B). Therefore, the contact, via CD54, is essential for the effect of pro-inflammatory MΦ on the immunosuppressive properties of MSCs.
Moreover, CD54 was essential for the increased IDO activity in M1-MSCs (Figure 7C). Indeed, blocking CD54 during the M1MФ-MSC interaction inhibited IDO activation, with no impact on MSCs alone or M2-MSCs (Figure 7C). The effect of blocking CD54 was significant when M1-MSCs were stimulated with IFN-γ. Thus, IDO production depends on the contact, via CD54, between MSC and M1MΦ.
Taken together, our results demonstrate that pro-inflammatory MΦ interact with MSCs via CD54 to induce calcium signaling and increase the immunosuppressive capacities of MSCs via IDO activation.
Discussion
We describe herein a functional crosstalk between M1MΦ and MSCs. We characterized CD54 as the mediating protein involved in the contact between M1MФ and MSCs and demonstrated its essential role in M1MΦ regulating MSC immunosuppressive properties. Our data highlight the role of MSCs as a sensor of the inflammatory environment via a mechanism that involves direct interaction between MSCs and innate immune cells. Recent findings demonstrated that MSCs have a tight interaction with innate immune cells. Indeed, MSCs in the microenvironment modulate the inflammatory response via control of macrophages and interplay that is essential for tissue repair and regeneration. Macrophages, key elements in initiation and control of inflammation (Mantovani et al., 2013), are dynamic cells that can switch their functions and phenotypes under the effect of the local microenvironment into a full spectrum of activation from classically a pro-inflammatory (M1MФ) to alternatively anti-inflammatory state (M2MФ) (Gordon et al., 2014, Mosser and Edwards, 2008). MSCs change M1MФ to M2-like macrophages that are characterized by increased anti-inflammatory cytokine secretion and greater phagocytosis capacities (Maggini et al., 2010). Moreover, MSCs can reprogram macrophages and monocytes in vivo, thereby modifying their secretory profile and decreasing general inflammation (Francois et al., 2012, Nemeth et al., 2009).
MSCs are sensors of the microenvironment and acquire abilities depending on the inflammatory state of their environment (Bernardo and Fibbe, 2013). Previous studies linked the effect of macrophages on MSCs to a paracrine mechanism. Indeed, M1MФ, via cytokine secretion, inhibit the proliferation and migration of human MSCs and modify their cytokine secretion profile (Freytes et al., 2013). Moreover, MSCs express soluble factors such as IDO and adhesion molecules such as CD54, and become more immunosuppressive in inflammatory environments (Ren et al., 2010). However, we found that innate immune cells modulated the MSC function in a contact-dependent manner. Indeed, direct contact with M1MФ, via CD54, was required to increase the immunosuppressive abilities of MSCs. M1MФ increased only CD54 expression on MSCs, whereas pro-inflammatory cytokines increase both CD54 and CD106 expression (Ren et al., 2010). The differential expression of CD54 and CD106 on MSCs after interaction with M1MФ confirms that the effect of M1MФ is contact dependent and is not linked to cytokine secretion. The importance of the MSC-macrophage physical crosstalk was previously highlighted in BM. In fact, a subpopulation of macrophages modulated the MSC phenotype to maintain a hematopoietic stem cell niche (Chow et al., 2011). In the secondary lymphoid organs, MSCs structure and organize lymphoid organs and also determine the future adaptive immune response by modulating hematopoietic cells. Moreover, a tight interaction between stromal cells and dendritic cells is associated with exchange of protein membranes (Roozendaal and Mebius, 2011). In this work, we clearly demonstrated that pro-inflammatory M1MΦ closely interact with stromal cells and modify their relationship with adaptive immune cells.
An important finding of our study is that an “unconventional synapse” is formed between macrophages and MSCs associated with polarization of CD54 at the contact area. The “conventional” immunological synapse between two immune cells is a polarized, highly organized molecular structure that plays an essential role in communication between immune cells. As in our system, CD54 plays an important role in the formation of functional immune synapses. CD54, also known as intercellular adhesion molecule 1, is a highly glycosylated immunoglobulin superfamily member that binds the leukocyte integrins “leukocyte function antigen 1” (LFA-1) or CD54 itself. CD54 is constitutively expressed on leukocytes, epithelial and resting endothelial cells, or MSCs, and is upregulated in response to inflammatory mediators (Roebuck and Finnegan, 1999). In our system, inhibition of LFA-1 on the macrophage surface did not modify the MSC function (data not shown); therefore, MSCs could interact with macrophages via a homotypic CD54-CD54 interaction independent of LFA-1.
CD54 has a crucial role in conventional immunological synapse formation by stabilizing the cell-to-cell conjugate and sustaining signaling. Indeed, at the contact between T cells and antigen-presenting cells, the immunological synapse is formed by the concentration of the T cell receptors and major histocompatibility II complexes in the center of the structure, whereas adhesion receptors such as CD54 segregate to form an external ring, which stabilizes the structure and leads to a strong cell interaction that optimizes intracellular communication (Grakoui et al., 1999, Stinchcombe et al., 2001). Our data show greater expression and enrichment of CD54 in the contact area between MSCs and M1MΦ. However, key events in the immunological synapse are the orientation of the cytoskeleton toward the target cell and the polarization of several organelles such as the centrosome, Golgi apparatus, and ER. In our model, the microtubule-organizing center as well as the actin cytoskeleton did not polarize toward MSCs or macrophages during cell interaction. However, the M1MФ-MSC interaction induced calcium signaling in both cells, which confirms the idea of an “unconventional” but functional synapse between stromal and innate immune cells. Moreover, intracellular and extracellular communication between MSCs and macrophages were highlighted by organelle exchange such as mitochondrial and exosome transfer between both cells (Ekstrom et al., 2013, Phinney et al., 2015).
Only pro-inflammatory macrophages (M1MФ) formed a functional synapse with MSCs, which suggests that the MSC response depends on the macrophage phenotype. The link between the macrophage phenotype and functional synapse was demonstrated in previous work. For instance, F-actin clusters were detected at the immunological synapse formed between natural killer cells and LPS-activated but not LPS-inactivated macrophages (Nedvetzki et al., 2007). Autologous or allogenic MSCs decrease T cell proliferation (Di Nicola et al., 2002, Krampera et al., 2003) and inhibit the proliferation of CD8+ T cell-mediated cytotoxicity (Rasmusson et al., 2003). Moreover, MSCs stimulate the proliferation of regulatory T cells (Maccario et al., 2005) and shift the Th1/Th2 balance toward Th2 cells. We demonstrate that M1MФ enhanced the immunosuppressive capacities of MSCs but did not change the Th1/Th2 ratio. MSCs inhibited in vitro T lymphocyte proliferation by the production and secretion of several immunomodulatory factors such as PGE2 (Spaggiari et al., 2008), IDO (Ren et al., 2009), heme oxygenase (Mougiakakos et al., 2011), or human leukocyte antigen G5 (HLA G5) (Selmani et al., 2008). IDO and COX2 play a role in increasing the immunosuppressive capacities of MSCs by M1MΦ, with no involvement of TSG6, HLA-G5, and HMOX-1.
Finally, we demonstrated that human MSCs showed a completely different behavior after contact with inflammatory cells. Increasingly, clinical trials are using MSCs for treatment of autoimmune and inflammatory pathologies (Le Blanc and Mougiakakos, 2012). One of the major challenges of this cell therapy is to define the perfect timing for injection. Indeed, Polchert et al. (2008) revealed that injection of MSCs was ineffective during the earlier and later stages of graft-versus-host disease. In the same way, MSC treatment was effective in multiple sclerosis only when cells were injected during the peak of inflammation and not during the chronic disease phase (Mohyeddin Bonab et al., 2007). Our work confirms that injection of MSCs during the inflammatory phase optimizes the efficiency of MSCs in the treatment of inflammatory pathologies (Kern et al., 2006).
The second challenge for MSC-based cell therapy is the cell source. Indeed, we need to determine whether MSCs from different tissues have the same behavior after contact with pro-inflammatory immune cells. These findings will help define the optimal timing of injection and the optimal cell source for successful treatment of each immune disorder.
After injection in the circulation and in tissues, MSCs can interact with all types of immune cells. Indeed, Bazhanov et al. (2016) demonstrated that human MSCs formed aggregates with macrophages and B lymphocytes when injected in the mouse peritoneum. In our study, we specifically characterized the molecular mechanisms involved in the crosstalk between MSCs and MФ in an inflammatory context.
Altogether, our data demonstrate the existence of an unconventional but functional CD54-mediated interaction between pro-inflammatory macrophages (M1MФ) and MSCs. This crosstalk modulates the immunosuppressive functions of MSCs and opens important perspectives in MSC-based cell therapy for autoimmune and inflammatory diseases.
Experimental Procedures
Isolation of Monocytes and Differentiation into Pro- or Anti-inflammatory Macrophages
Human peripheral blood mononuclear cells (PBMCs) were obtained from blood-donor buffy coats (Etablissement Français du Sang Pyrénéees-Méditerranée [EFS]) after density gradient centrifugation. Human monocytes were isolated from PBMCs using “monocyte isolation kit” (Miltenyi). Monocytes were plated in RPMI supplemented with 2 mM L-glutamine, 100 U/mL penicillin, 100 U/mL streptomycin, 10% fetal calf serum (Hyclone, Perbio) + 100 ng/mL macrophage colony-stimulating factor (Peprotech) for 7 days, then monocyte-differentiated MΦ were polarized for 24 hr into pro-inflammatory M1MФ using IFN-γ (20 ng/mL; Peprotech) + LPS (1 μg/mL; InvivoGen) or anti-inflammatory M2MФ using IL-4 (20 ng/mL; Peprotech).
Isolation of Bone Marrow Mesenchymal Stem Cells
Femur head or iliac-crest aspirations were harvested from patients who provided prior written informed consent according to the ethics committees of Toulouse and Tours University Hospitals. After enzymatic digestion, nucleated bone marrow cells were seeded at 50,000 cells/cm2 and MSCs were isolated by adherence. Cells were amplified in α-minimum essential medium supplemented with 2 mM L-glutamine, 100 U/mL penicillin, 100 U/mL streptomycin, and 10% fetal calf serum (complete medium). Medium was renewed twice a week, and after 21 days of culture, MSCs (passage P0) were detached with 0.5% trypsin (Life Technologies) and seeded at 2,000 cells/cm2. MSCs at confluence (passage P1) were detached and used for experiments.
Co-culture of Polarized Macrophages and MSCs
After 24 hr of differentiation, MΦ were washed three times with PBS. MSCs were added to the culture at a ratio of MSCs to MΦ of 1:2 in complete medium. MSCs were cultivated alone as a control. After 24 hr of co-culture, cells were harvested and MSCs and MΦ were magnetically separated using “CD45 microbead kit” on the AutoMACS pro separator (Miltenyi). Purity of the negative fraction, containing MSCs, was evaluated by fluorescence-activated cell sorting (FACS). MΦ were co-cultured with MSCs by the Transwell system. MΦ were plated in 6-well plates and MSCs were seeded on polyethylene terephthalate cell-culture inserts (Becton Dickinson, pore size 0.4 μm) for 24 hr. An amount of 10 μg/mL anti-CD54 blocking antibody (R&D Systems; BBA3) or IgG1 isotype control (Dako, X093101-2) was added during the MSC-MΦ co-culture for 24 hr.
Microarray Transcriptome Hybridization
After MSC-MΦ separation, total RNA was extracted from MSCs and primed MSCs using the RNeasy micro kit (Qiagen) and quantified by use of Nanodrop ND-2000. RNA quality was assayed by the Experion RNA Stdsens analysis kit (Bio-Rad). cDNA was synthesized and amplified using the Ovation PicoSL WTA System (NuGEN). An amount of 25 ng total RNA was reverse transcribed using a primer mix containing both polyT and random sequences for whole-transcriptome coverage, followed by second-strand cDNA synthesis with the Ribo-SPIA technology. The amplified SPIA cDNA was further purified with use of Agencourt RNAClean Beads.
SPIA cDNA was hybridized to a human gene chip (Human Gene 1.1 ST Array Strip; Affymetrix). Array hybridization, washing, and staining were performed as described by the manufacturer (GeneAtlas Hybridization, Wash, and Stain Kit for WT Array Strips; Affymetrix) using the GeneAtlas System. Arrays were scanned on the GeneAtlas Imaging Station (Affymetrix) and analyzed using GeneChip Command Console software (Affymetrix). CEL files were imported into the Partek Genomic Suite (Partek) for normalization and expression comparison. Gene networks representing key genes were identified by using Ingenuity pathways analysis.
Real-Time PCR
MSC and MΦ were co-cultivated for 24 hr and cells were magnetically separated using the “CD45 microbead kit”. MSCs or primed MSCs were plated for 24 hr, then total RNA was extracted using the “RNeasy micro kit” (Qiagen) and was reverse transcribed with the “high-capacity cDNA reverse transcription kit” (Applied Biosystems). Real-time PCR amplification was performed on a CFX96 thermocycler (Bio-Rad). The following primers (Eurogentec) were used: IDO, forward 5′-GCC CTT CAA GTG TTT CAC CAA-3′ and reverse 5′-CCA GCC AGA CAA ATA TAT GCG-3′; COX2, forward 5′-CTG CTC AAC ACC GGA ATT TT-3′ and reverse 5′-GTG CAG TGT GTT TGG AGT GG-3′; HMOX1, forward 5′-ATG ACA CCA AGG ACC AGA CC-3′ and reverse 5′-GTG TAA GGA CCC ATC GGA GA-3′; and TSG6, forward 5′-GTA CCA CAG AGA AGC ACG GT-3′ and reverse 5′-GGC CGC CTT CAA ATT CAC AC-3′. Gene expression was normalized relative to NUNS5 expression (forward 5′-AGA CCA GTC ACT TGG CTG CTG CTC T-3′ and reverse 5′-AGC CAG TTC ACA GCA AGA CAC G-3′).
Immunophenotype of MSCs after Co-culture with Macrophages
At 24 hr after co-culture, cells were incubated in blocking buffer (running buffer + 10% FcR block reagent, Miltenyi) for 20 min at 4°C. Cells were then incubated with the antibodies anti-CD200-APC (Miltenyi, 130-096-816), anti-CD45-APC-Vio770 (Miltenyi, 130-096-609), anti-CD90-FITC (BD, 555595), anti-CD54-PE (BD, 555511), anti-CD106-PE (BD, 555647), and anti-CD56-PeCy5 (BD, 555517). Fluorescence was analyzed by the FACS Canto II system with Diva software (BD).
Immunosuppression Assay
T Lymphocyte Immunosuppression
After 24 hr of culture with or without M1 or M2-MΦ, MSCs were magnetically sorted with use of the “CD45 microbead kit” and seeded at 105/well in 48-well plates. Human T cells were purified after PBMC isolation from buffy coat (EFS) using the “Pan T cell isolation kit” (Miltenyi) and labeled with CFSE (Life Technologies). A total of 105 labeled T cells were added to MSCs and stimulated with anti-CD3/CD28 beads (Life Technologies). After 5 days, the co-cultures were stopped and cells were stained with anti-CD3-APC-Vio770 (Miltenyi, 130-096-610) and anti-CD45-VioBlue antibodies (Miltenyi, 130-092-880). Data were collected on a Canto II cytometer and analyzed using Diva software (BD). The percentage suppression of T cell proliferation with MSCs was calculated as (1 − [proliferation of T cells co-cultured with MSCs/proliferation of stimulated T cells alone]) × 100.
IDO Activity Assay
IDO catalyzes the tryptophan and generates L-kynurenine as a metabolite. L-Kynurenine/tryptophan ratio was measured to evaluate IDO enzymatic activity. After 24 hr of co-culture, cells were harvested and MSCs were magnetically separated from MΦ as previously described. MSCs or primed MSCs were cultivated with or without IFN-γ for 24 hr. Supernatants were harvested and levels of L-kynurenine and tryptophan were determined by ELISA (Immundiagnostik).
PGE2 Content Measurement
Separated MSCs or primed MSCs were cultivated with or without IFN-γ for 24 hr. PGE2 content in supernatants was determined by ELISA (Abcam).
[Ca2+]i Analysis in Single MSCs
MΦ were differentiated into M1MФ or M2MФ on μ-slide chambers (Ibidi, Biovalley). MSCs were added to polarize MΦ and labeled with Fura-2-AM (Molecular Probes). Fluorescence was quantified between 10 and 30 min on a Zeiss Axiovert 200 M inverted microscope equipped with a CCD camera (i-PentaMAX), an arc xenon lamp, and a computer-controlled monochromator (TILL Photonics) at 37°C and 5% CO2. Cells were consecutively excited with 340- and 380-nm wavelength at intervals of 10 s by means of the monochromator, and wavelength emission at 510 nm was collected with the CCD camera. The camera output was analyzed using the custom calcium-imaging software, MetaFluor, provided by Universal Imaging. Movies, and snapshots were obtained by MetaFluor and Fiji software.
Imaging Flow Microscopy and Measurement of MSC-Macrophage Interaction
MSCs and MΦ were co-cultivated for 24 hr and detached. Cells were incubated in blocking buffer (running buffer + 10% FcR block reagent) for 20 min at 4°C, then incubated for 30 min at 4°C with the antibodies anti-CD90-FITC, anti-CD54-PE, and anti-CD45-APC-Vio770. Cells were acquired on ImageStreamX (Amnis). Images were captured and analyzed using INSPIRE acquisition software (Amnis v.6.0). All acquisitions were performed at 40× magnification. We collected 50,000 events for each sample. The gating strategy for analysis was first, selecting focus cells based on the “gradient RMS” feature, then gating on the CD45 (channel 6)-CD90 (channel 2) doublet-positive cells. Finally, we selected the doublet-like cells based on an area-versus-aspect ratio plot. For measurement of MSC-MΦ interaction, MΦ and MSCs were defined by using “morphology” masks based on CD90 (MSC) and CD45 (MΦ) markers. The interface feature was used to define the interaction between the two generated masks (CD90 and CD45). Fluorescence intensity of CD54 (channel 3) on the MSC mask as well as the defined interface was determined using Ideas Software (Amnis V.6.0).
Intracellular Staining for Confocal Microscopy
Monocytes were plated on a μ-slide chamber and differentiated on M1MФ or M2MФ for 24 hr, then macrophages were washed and 2.5 × 10⁴ MSCs added to polarized macrophages for 15 min in complete medium. Cells were fixed in PBS/3% paraformaldehyde, blocked, and permeabilized with PBS/saponin/BSA/HEPES. Cells were then stained with anti-human CD54 monoclonal antibody (BD, 555510) and anti-α-tubulin monoclonal antibody (Sigma, T5192) followed by Alexa Fluor 488-labeled goat anti-rabbit isotype-specific antibody (Thermo Fisher, A-11008) or Alexa Fluor 647-labeled goat anti-mouse isotype-specific (Thermo Fisher, A-21240) or Alexa 488-labeled phalloidin (Thermo Fisher, A-12379). Secondary antibodies alone were used as negative control. The fluorescence of the samples was analyzed under an LSM 710 confocal microscope (Zeiss) over a 63× Plan-Apochromat objective (1.4 oil). Images were created using Fiji software.
Author Contributions
N.E., L.S., and A.V. conceived and designed the experiments; N.E., A.B., E.A., and A.V. performed the experiments; N.E., E.A., L.S. and A.V. analyzed the data; N.E. and A.V. wrote the paper. L.S. revised the paper.
Acknowledgments
We thank Sophie Dupuis from the EcellFrance platform, Toulouse, Sophie Allart and the Plateau technique de cytométrie et de microscopie, INSERM UMR 1043. We thank Eric Espinosa for kindly providing T cells, and Sabina Müller and Salvatore Valitutti for confocal microscopy technical assistance and discussion. We thank Marie-Laure Renoud for technical support. This work was supported by the APR 2012 from the Etablissement Français du Sang Pyrénéees-Méditerranée (2013-05-Varin-PM). The funders had no role in the study design or the preparation of the manuscript.
Published: March 16, 2017
Footnotes
Supplemental Information includes Supplemental Experimental Procedures, four figures, and five movies and can be found with this article online at http://dx.doi.org/10.1016/j.stemcr.2017.02.008.
Contributor Information
Luc Sensebé, Email: luc.sensebe@efs.sante.fr.
Audrey Varin, Email: audrey.varin@efs.sante.fr.
Accession Numbers
The accession number of the microarray data is GEO: GSE93970 (https://www.ncbi.nlm.nih.gov/geo/query/acc.cgi?acc=GSE93970).
Supplemental Information
References
- Anton K., Banerjee D., Glod J. Macrophage-associated mesenchymal stem cells assume an activated, migratory, pro-inflammatory phenotype with increased IL-6 and CXCL10 secretion. PLoS One. 2012;7:e35036. doi: 10.1371/journal.pone.0035036. [DOI] [PMC free article] [PubMed] [Google Scholar]
- Bazhanov N., Ylostalo J.H., Bartosh T.J., Tiblow A., Mohammadipoor A., Foskett A., Prockop D.J. Intraperitoneally infused human mesenchymal stem cells form aggregates with mouse immune cells and attach to peritoneal organs. Stem Cell Res. Ther. 2016;7:27. doi: 10.1186/s13287-016-0284-5. [DOI] [PMC free article] [PubMed] [Google Scholar]
- Bernardo M.E., Fibbe W.E. Mesenchymal stromal cells: sensors and switchers of inflammation. Cell Stem Cell. 2013;13:392–402. doi: 10.1016/j.stem.2013.09.006. [DOI] [PubMed] [Google Scholar]
- Chow A., Lucas D., Hidalgo A., Mendez-Ferrer S., Hashimoto D., Scheiermann C., Battista M., Leboeuf M., Prophete C., van Rooijen N. Bone marrow CD169+ macrophages promote the retention of hematopoietic stem and progenitor cells in the mesenchymal stem cell niche. J. Exp. Med. 2011;208:261–271. doi: 10.1084/jem.20101688. [DOI] [PMC free article] [PubMed] [Google Scholar]
- Crisan M., Yap S., Casteilla L., Chen C.W., Corselli M., Park T.S., Andriolo G., Sun B., Zheng B., Zhang L. A perivascular origin for mesenchymal stem cells in multiple human organs. Cell Stem Cell. 2008;3:301–313. doi: 10.1016/j.stem.2008.07.003. [DOI] [PubMed] [Google Scholar]
- Di Nicola M., Carlo-Stella C., Magni M., Milanesi M., Longoni P.D., Matteucci P., Grisanti S., Gianni A.M. Human bone marrow stromal cells suppress T-lymphocyte proliferation induced by cellular or nonspecific mitogenic stimuli. Blood. 2002;99:3838–3843. doi: 10.1182/blood.v99.10.3838. [DOI] [PubMed] [Google Scholar]
- Di Trapani M., Bassi G., Ricciardi M., Fontana E., Bifari F., Pacelli L., Giacomello L., Pozzobon M., Feron F., De Coppi P. Comparative study of immune regulatory properties of stem cells derived from different tissues. Stem Cells Dev. 2013;22:2990–3002. doi: 10.1089/scd.2013.0204. [DOI] [PMC free article] [PubMed] [Google Scholar]
- Duffy M.M., Pindjakova J., Hanley S.A., McCarthy C., Weidhofer G.A., Sweeney E.M., English K., Shaw G., Murphy J.M., Barry F.P. Mesenchymal stem cell inhibition of T-helper 17 cell- differentiation is triggered by cell-cell contact and mediated by prostaglandin E2 via the EP4 receptor. Eur. J. Immunol. 2011;41:2840–2851. doi: 10.1002/eji.201141499. [DOI] [PubMed] [Google Scholar]
- Duffy M.M., Ritter T., Ceredig R., Griffin M.D. Mesenchymal stem cell effects on T-cell effector pathways. Stem Cell Res. Ther. 2011;2:34. doi: 10.1186/scrt75. [DOI] [PMC free article] [PubMed] [Google Scholar]
- Ekstrom K., Omar O., Graneli C., Wang X., Vazirisani F., Thomsen P. Monocyte exosomes stimulate the osteogenic gene expression of mesenchymal stem cells. PLoS One. 2013;8:e75227. doi: 10.1371/journal.pone.0075227. [DOI] [PMC free article] [PubMed] [Google Scholar]
- Etienne-Manneville S., Manneville J.B., Adamson P., Wilbourn B., Greenwood J., Couraud P.O. ICAM-1-coupled cytoskeletal rearrangements and transendothelial lymphocyte migration involve intracellular calcium signaling in brain endothelial cell lines. J. Immunol. 2000;165:3375–3383. doi: 10.4049/jimmunol.165.6.3375. [DOI] [PubMed] [Google Scholar]
- Francois M., Romieu-Mourez R., Li M., Galipeau J. Human MSC suppression correlates with cytokine induction of indoleamine 2,3-dioxygenase and bystander M2 macrophage differentiation. Mol. Ther. 2012;20:187–195. doi: 10.1038/mt.2011.189. [DOI] [PubMed] [Google Scholar]
- Freytes D.O., Kang J.W., Marcos-Campos I., Vunjak-Novakovic G. Macrophages modulate the viability and growth of human mesenchymal stem cells. J. Cell. Biochem. 2013;114:220–229. doi: 10.1002/jcb.24357. [DOI] [PubMed] [Google Scholar]
- Friedenstein A.J., Gorskaja J.F., Kulagina N.N. Fibroblast precursors in normal and irradiated mouse hematopoietic organs. Exp. Hematol. 1976;4:267–274. [PubMed] [Google Scholar]
- Frumento G., Rotondo R., Tonetti M., Damonte G., Benatti U., Ferrara G.B. Tryptophan-derived catabolites are responsible for inhibition of T and natural killer cell proliferation induced by indoleamine 2,3-dioxygenase. J. Exp. Med. 2002;196:459–468. doi: 10.1084/jem.20020121. [DOI] [PMC free article] [PubMed] [Google Scholar]
- Gao F., Chiu S.M., Motan D.A., Zhang Z., Chen L., Ji H.L., Tse H.F., Fu Q.L., Lian Q. Mesenchymal stem cells and immunomodulation: current status and future prospects. Cell Death Dis. 2016;7:e2062. doi: 10.1038/cddis.2015.327. [DOI] [PMC free article] [PubMed] [Google Scholar]
- Garcia-Gomez A., Sanchez-Guijo F., Del Canizo M.C., San Miguel J.F., Garayoa M. Multiple myeloma mesenchymal stromal cells: contribution to myeloma bone disease and therapeutics. World J. Stem Cells. 2014;6:322–343. doi: 10.4252/wjsc.v6.i3.322. [DOI] [PMC free article] [PubMed] [Google Scholar]
- Gordon S. Alternative activation of macrophages. Nat. Rev. Immunol. 2003;3:23–35. doi: 10.1038/nri978. [DOI] [PubMed] [Google Scholar]
- Gordon S., Pluddemann A., Martinez Estrada F. Macrophage heterogeneity in tissues: phenotypic diversity and functions. Immunol. Rev. 2014;262:36–55. doi: 10.1111/imr.12223. [DOI] [PMC free article] [PubMed] [Google Scholar]
- Grakoui A., Bromley S.K., Sumen C., Davis M.M., Shaw A.S., Allen P.M., Dustin M.L. The immunological synapse: a molecular machine controlling T cell activation. Science. 1999;285:221–227. doi: 10.1126/science.285.5425.221. [DOI] [PubMed] [Google Scholar]
- Horwitz E.M., Prockop D.J., Fitzpatrick L.A., Koo W.W., Gordon P.L., Neel M., Sussman M., Orchard P., Marx J.C., Pyeritz R.E. Transplantability and therapeutic effects of bone marrow-derived mesenchymal cells in children with osteogenesis imperfecta. Nat. Med. 1999;5:309–313. doi: 10.1038/6529. [DOI] [PubMed] [Google Scholar]
- Im G.I., Shin Y.W., Lee K.B. Do adipose tissue-derived mesenchymal stem cells have the same osteogenic and chondrogenic potential as bone marrow-derived cells? Osteoarthritis Cartilage. 2005;13:845–853. doi: 10.1016/j.joca.2005.05.005. [DOI] [PubMed] [Google Scholar]
- Kern S., Eichler H., Stoeve J., Kluter H., Bieback K. Comparative analysis of mesenchymal stem cells from bone marrow, umbilical cord blood, or adipose tissue. Stem Cells. 2006;24:1294–1301. doi: 10.1634/stemcells.2005-0342. [DOI] [PubMed] [Google Scholar]
- Krampera M., Glennie S., Dyson J., Scott D., Laylor R., Simpson E., Dazzi F. Bone marrow mesenchymal stem cells inhibit the response of naive and memory antigen-specific T cells to their cognate peptide. Blood. 2003;101:3722–3729. doi: 10.1182/blood-2002-07-2104. [DOI] [PubMed] [Google Scholar]
- Le Blanc K., Mougiakakos D. Multipotent mesenchymal stromal cells and the innate immune system. Nat. Rev. Immunol. 2012;12:383–396. doi: 10.1038/nri3209. [DOI] [PubMed] [Google Scholar]
- Le Blanc K., Rasmusson I., Sundberg B., Gotherstrom C., Hassan M., Uzunel M., Ringden O. Treatment of severe acute graft-versus-host disease with third party haploidentical mesenchymal stem cells. Lancet. 2004;363:1439–1441. doi: 10.1016/S0140-6736(04)16104-7. [DOI] [PubMed] [Google Scholar]
- Maccario R., Podesta M., Moretta A., Cometa A., Comoli P., Montagna D., Daudt L., Ibatici A., Piaggio G., Pozzi S. Interaction of human mesenchymal stem cells with cells involved in alloantigen-specific immune response favors the differentiation of CD4+ T-cell subsets expressing a regulatory/suppressive phenotype. Haematologica. 2005;90:516–525. [PubMed] [Google Scholar]
- Maggini J., Mirkin G., Bognanni I., Holmberg J., Piazzon I.M., Nepomnaschy I., Costa H., Canones C., Raiden S., Vermeulen M. Mouse bone marrow-derived mesenchymal stromal cells turn activated macrophages into a regulatory-like profile. PLoS One. 2010;5:e9252. doi: 10.1371/journal.pone.0009252. [DOI] [PMC free article] [PubMed] [Google Scholar]
- Mantovani A., Biswas S.K., Galdiero M.R., Sica A., Locati M. Macrophage plasticity and polarization in tissue repair and remodelling. J. Pathol. 2013;229:176–185. doi: 10.1002/path.4133. [DOI] [PubMed] [Google Scholar]
- Mohyeddin Bonab M., Yazdanbakhsh S., Lotfi J., Alimoghaddom K., Talebian F., Hooshmand F., Ghavamzadeh A., Nikbin B. Does mesenchymal stem cell therapy help multiple sclerosis patients? Report of a pilot study. Iran J. Immunol. 2007;4:50–57. [PubMed] [Google Scholar]
- Mosser D.M., Edwards J.P. Exploring the full spectrum of macrophage activation. Nat. Rev. Immunol. 2008;8:958–969. doi: 10.1038/nri2448. [DOI] [PMC free article] [PubMed] [Google Scholar]
- Mougiakakos D., Jitschin R., Johansson C.C., Okita R., Kiessling R., Le Blanc K. The impact of inflammatory licensing on heme oxygenase-1-mediated induction of regulatory T cells by human mesenchymal stem cells. Blood. 2011;117:4826–4835. doi: 10.1182/blood-2010-12-324038. [DOI] [PubMed] [Google Scholar]
- Nedvetzki S., Sowinski S., Eagle R.A., Harris J., Vely F., Pende D., Trowsdale J., Vivier E., Gordon S., Davis D.M. Reciprocal regulation of human natural killer cells and macrophages associated with distinct immune synapses. Blood. 2007;109:3776–3785. doi: 10.1182/blood-2006-10-052977. [DOI] [PubMed] [Google Scholar]
- Nemeth K., Leelahavanichkul A., Yuen P.S., Mayer B., Parmelee A., Doi K., Robey P.G., Leelahavanichkul K., Koller B.H., Brown J.M. Bone marrow stromal cells attenuate sepsis via prostaglandin E(2)-dependent reprogramming of host macrophages to increase their interleukin-10 production. Nat. Med. 2009;15:42–49. doi: 10.1038/nm.1905. [DOI] [PMC free article] [PubMed] [Google Scholar]
- Phinney D.G., Di Giuseppe M., Njah J., Sala E., Shiva S., St Croix C.M., Stolz D.B., Watkins S.C., Di Y.P., Leikauf G.D. Mesenchymal stem cells use extracellular vesicles to outsource mitophagy and shuttle microRNAs. Nat. Commun. 2015;6:8472. doi: 10.1038/ncomms9472. [DOI] [PMC free article] [PubMed] [Google Scholar]
- Pittenger M.F., Mackay A.M., Beck S.C., Jaiswal R.K., Douglas R., Mosca J.D., Moorman M.A., Simonetti D.W., Craig S., Marshak D.R. Multilineage potential of adult human mesenchymal stem cells. Science. 1999;284:143–147. doi: 10.1126/science.284.5411.143. [DOI] [PubMed] [Google Scholar]
- Polchert D., Sobinsky J., Douglas G., Kidd M., Moadsiri A., Reina E., Genrich K., Mehrotra S., Setty S., Smith B. IFN-gamma activation of mesenchymal stem cells for treatment and prevention of graft versus host disease. Eur. J. Immunol. 2008;38:1745–1755. doi: 10.1002/eji.200738129. [DOI] [PMC free article] [PubMed] [Google Scholar]
- Prockop D.J. Concise review: two negative feedback loops place mesenchymal stem/stromal cells at the center of early regulators of inflammation. Stem Cells. 2013;31:2042–2046. doi: 10.1002/stem.1400. [DOI] [PubMed] [Google Scholar]
- Quarto R., Mastrogiacomo M., Cancedda R., Kutepov S.M., Mukhachev V., Lavroukov A., Kon E., Marcacci M. Repair of large bone defects with the use of autologous bone marrow stromal cells. N. Engl. J. Med. 2001;344:385–386. doi: 10.1056/NEJM200102013440516. [DOI] [PubMed] [Google Scholar]
- Rasmusson I., Ringden O., Sundberg B., Le Blanc K. Mesenchymal stem cells inhibit the formation of cytotoxic T lymphocytes, but not activated cytotoxic T lymphocytes or natural killer cells. Transplantation. 2003;76:1208–1213. doi: 10.1097/01.TP.0000082540.43730.80. [DOI] [PubMed] [Google Scholar]
- Ren G., Zhang L., Zhao X., Xu G., Zhang Y., Roberts A.I., Zhao R.C., Shi Y. Mesenchymal stem cell-mediated immunosuppression occurs via concerted action of chemokines and nitric oxide. Cell Stem Cell. 2008;2:141–150. doi: 10.1016/j.stem.2007.11.014. [DOI] [PubMed] [Google Scholar]
- Ren G., Su J., Zhang L., Zhao X., Ling W., L'Huillie A., Zhang J., Lu Y., Roberts A.I., Ji W. Species variation in the mechanisms of mesenchymal stem cell-mediated immunosuppression. Stem Cells. 2009;27:1954–1962. doi: 10.1002/stem.118. [DOI] [PubMed] [Google Scholar]
- Ren G., Zhao X., Zhang L., Zhang J., L'Huillier A., Ling W., Roberts A.I., Le A.D., Shi S., Shao C. Inflammatory cytokine-induced intercellular adhesion molecule-1 and vascular cell adhesion molecule-1 in mesenchymal stem cells are critical for immunosuppression. J. Immunol. 2010;184:2321–2328. doi: 10.4049/jimmunol.0902023. [DOI] [PMC free article] [PubMed] [Google Scholar]
- Roebuck K.A., Finnegan A. Regulation of intercellular adhesion molecule-1 (CD54) gene expression. J. Leukoc. Biol. 1999;66:876–888. doi: 10.1002/jlb.66.6.876. [DOI] [PubMed] [Google Scholar]
- Roozendaal R., Mebius R.E. Stromal cell-immune cell interactions. Annu. Rev. Immunol. 2011;29:23–43. doi: 10.1146/annurev-immunol-031210-101357. [DOI] [PubMed] [Google Scholar]
- Selmani Z., Naji A., Zidi I., Favier B., Gaiffe E., Obert L., Borg C., Saas P., Tiberghien P., Rouas-Freiss N. Human leukocyte antigen-G5 secretion by human mesenchymal stem cells is required to suppress T lymphocyte and natural killer function and to induce CD4+CD25highFOXP3+ regulatory T cells. Stem Cells. 2008;26:212–222. doi: 10.1634/stemcells.2007-0554. [DOI] [PubMed] [Google Scholar]
- Spaggiari G.M., Capobianco A., Abdelrazik H., Becchetti F., Mingari M.C., Moretta L. Mesenchymal stem cells inhibit natural killer-cell proliferation, cytotoxicity, and cytokine production: role of indoleamine 2,3-dioxygenase and prostaglandin E2. Blood. 2008;111:1327–1333. doi: 10.1182/blood-2007-02-074997. [DOI] [PubMed] [Google Scholar]
- Spaggiari G.M., Abdelrazik H., Becchetti F., Moretta L. MSCs inhibit monocyte-derived DC maturation and function by selectively interfering with the generation of immature DCs: central role of MSC-derived prostaglandin E2. Blood. 2009;113:6576–6583. doi: 10.1182/blood-2009-02-203943. [DOI] [PubMed] [Google Scholar]
- Stinchcombe J.C., Bossi G., Booth S., Griffiths G.M. The immunological synapse of CTL contains a secretory domain and membrane bridges. Immunity. 2001;15:751–761. doi: 10.1016/s1074-7613(01)00234-5. [DOI] [PubMed] [Google Scholar]
- Varin A., Pontikoglou C., Labat E., Deschaseaux F., Sensebe L. CD200R/CD200 inhibits osteoclastogenesis: new mechanism of osteoclast control by mesenchymal stem cells in human. PLoS One. 2013;8:e72831. doi: 10.1371/journal.pone.0072831. [DOI] [PMC free article] [PubMed] [Google Scholar]
- Waterman R.S., Tomchuck S.L., Henkle S.L., Betancourt A.M. A new mesenchymal stem cell (MSC) paradigm: polarization into a pro-inflammatory MSC1 or an Immunosuppressive MSC2 phenotype. PLoS One. 2010;5:e10088. doi: 10.1371/journal.pone.0010088. [DOI] [PMC free article] [PubMed] [Google Scholar]
- Wynn T.A., Vannella K.M. Macrophages in tissue repair, regeneration, and fibrosis. Immunity. 2016;44:450–462. doi: 10.1016/j.immuni.2016.02.015. [DOI] [PMC free article] [PubMed] [Google Scholar]
- Zuk P.A., Zhu M., Ashjian P., De Ugarte D.A., Huang J.I., Mizuno H., Alfonso Z.C., Fraser J.K., Benhaim P., Hedrick M.H. Human adipose tissue is a source of multipotent stem cells. Mol. Biol. Cell. 2002;13:4279–4295. doi: 10.1091/mbc.E02-02-0105. [DOI] [PMC free article] [PubMed] [Google Scholar]
Associated Data
This section collects any data citations, data availability statements, or supplementary materials included in this article.