

Abstract
How cells determine when to initiate DNA replication is poorly understood. Here we report that in Saccharomyces cerevisiae overexpression of the dosage-dependent cell cycle regulator genes DCR2 (YLR361C) and GID8 (DCR1/YMR135C) accelerates initiation of DNA replication. Cells lacking both GID8 and DCR2 delay initiation of DNA replication. Genetic analysis suggests that Gid8p functions upstream of Dcr2p to promote cell cycle progression. DCR2 is predicted to encode a gene product with phosphoesterase activity. Consistent with these predictions, a DCR2 allele carrying a His338 point mutation, which in known protein phosphatases prevents catalysis but allows substrate binding, antagonized the function of the wild-type DCR2 allele. Finally, we report genetic interactions involving GID8, DCR2, and CLN3 (which encodes a G1 cyclin) or SWI4 (which encodes a transcription factor of the G1/S transcription program). Our findings identify two gene products with a probable regulatory role in the timing of initiation of cell division.
Extensive studies have identified a large number of the components of the eukaryotic cell division machinery that bring about cell cycle transitions once cell division is initiated. However, very little is known about the factors that determine when the cell begins a new round of cell division. Tight coordination between cellular “growth” and cell division is thought to determine the timing of initiation of cell division, thus becoming rate limiting for cell proliferation (23, 25). In the yeast Saccharomyces cerevisiae various aspects of the cell's physiology are monitored at a point called START in the late G1 phase of the cell cycle (25), prior to DNA synthesis (in S phase). If cells pass through START, they initiate DNA replication and they are committed to complete cell division. START completion is also followed by the appearance of a bud on the cell surface, which will eventually give rise to the daughter cell (25).
Protein complexes of G1 cyclins (Cln1-3p) with the Cdc28p cyclin-dependent kinase catalyze passage through START, with the Cln3p/Cdc28p complex functioning first in activating a large G1/S transcriptional program (29, 31). A detailed molecular understanding of the factors and processes that trigger the Cln3p/Cdc28p-mediated START completion is still lacking. Past attempts to identify START regulatory genes have primarily relied on alterations of cell size (16, 24, 30, 35) or resistance to the antimitogenic properties of pheromone (6, 8, 26). We have recently described a different approach to identify gene products that alter the timing of START, which does not depend on cell size changes or the response to pheromone (1). Our method relied on the cell cycle-dependent surface localization of Flo1p, at the tip of the growing bud, after START completion. Cells that completed START faster than the wild type were selected by the appearance of Flo1p on the surface of a newly formed bud. Using this approach we identified DCR2 (YLR361C) and GID8 (DCR1/YMR135C), among others. DCR2 has not been studied previously. In a recent genome-wide study Gid8p was implicated in the glucose-induced degradation of fructose-1,6-biphosphatase and negative regulation of gluconeogenesis (27).
In this study we report that increased dosage of GID8 or DCR2 alters cell cycle progression, while loss of GID8 and DCR2 delays START. We present evidence that Gid8p may function upstream of Dcr2p to positively control the timing of START. Finally, we report that Dcr2p may function as a phosphoesterase and that this function may be important for START completion.
MATERIALS AND METHODS
Media, strains, and plasmids.
Media were prepared as described by Kaiser et al. (17), with the necessary biosynthetic requirements. All yeast molecular biology techniques were performed as described by Kaiser et al. (17), unless otherwise indicated. The strains used in this study are listed on Table 1. One-step gene replacements utilizing the his3MX and kanMX cassettes were done as described by Longtine et al. (19). For other gene replacements, URA3 was amplified by PCR with specific oligonucleotide primers carrying at their 5′ ends sequences that corresponded to flanking chromosomal sequences upstream and downstream of the open reading frame (ORF) that was replaced. The PCR products generated in this manner were then used directly in integrative transformations. The genotypes of all the strains were verified by PCR as described previously (12). The diploid strain coexpressing Gid8p-hemagglutinin (HA) and Dcr2p-Myc (SCMSP115) was obtained from a cross of DCR2-HA (SCMSP89) and GID8-MYC (SCMSP106) strains. The Cln3p-PrA strain (VAY27-1A) and its otherwise isogenic untagged counterpart (VAY27-1C) were gifts from F. Cross (7). To generate the strains shown on Fig. 8 and Table 4, we crossed a gid8 dcr2 strain (SCMSP112) with strains lacking CLN3 (10366), BCK2 (16163), or SWI4 (16109). The resulting diploids were sporulated, and the segregants were obtained by random spore analysis and tetrad dissection (17). The phenotypes reported for each strain were obtained after examining several independent transformants or segregants for the strain in question.
TABLE 1.
Strains used in this study
| Strain | Relevant genotype | Source |
|---|---|---|
| BY4741 | MATahis3Δ leu2Δ met15Δ ura3Δ | Res. Geneticsa |
| BY4742 | MATα his3Δ leu2Δ met15Δ ura3Δ | Res. Genetics |
| BY4743 | BY4741/BY4742 | Res. Genetics |
| VAY27-1C | MATaade2 trp1 leu2 his3 ura3 can1 | F. Cross |
| VAY27-1A | CLN3-PrA::HIS3 (VAY27-1C otherwise) | F. Cross |
| SCMSP75 | PGAL-GID8::his3MX/GID8+ (BY4743 otherwise) | This study |
| SCMSP76 | PGAL-DCR2::his3MX/DCR2+ (BY4743 otherwise) | This study |
| RPY3 | PGAL-DCR2::his3MX (BY4741 otherwise) | This study |
| SCMSP112 | gid8Δ::URA3 dcr2Δ::his3MX (BY4741 otherwise) | This study |
| 6576 | gid8Δ::kanMX (BY4741 otherwise) | Res. Genetics |
| RPY1 | dcr2Δ::his3MX (BY4741 otherwise) | This study |
| SCMSP89 | DCR2-3HA::kanMX (BY4742 otherwise) | This study |
| SCMSP107 | DCR2-13MYC::his3MX (BY4741 otherwise) | This study |
| SCMSP101 | GID8-3HA::kanMX (BY4742 otherwise) | This study |
| SCMSP106 | GID8-13MYC::his3MX (BY4741 otherwise) | This study |
| SCMSP115 | GID8-3HA::kanMX/GID8 DCR2-13MYC::his3MX/DCR2 (BY4743 otherwise) | This study |
| SCMSP116 | gid8Δ::URA3 (BY4741 otherwise) | This study |
| SCMSP131 | cln3Δ::kanMX gid8Δ::URA3 dcr2Δ::his3MX (BY4741 otherwise) | This study |
| SCMSP123 | cln3Δ::kanMX gid8Δ::URA3 (BY4741 otherwise) | This study |
| SCMSP124 | swi4Δ::kanMX gid8Δ::URA3 (BY4741 otherwise) | This study |
| SCMSP137 | swi4Δ::kanMX gid8Δ::URA3 dcr2Δ::his3MX (BY4741 otherwise) | This study |
| SCMSP134 | bck2Δ::kanMX gid8Δ::URA3 (BY4741 otherwise) | This study |
| SCMSP136 | bck2Δ::kanMX gid8Δ::URA3 dcr2Δ::his3MX (BY4741 otherwise) | This study |
| SCMSP127 | cln3Δ::kanMX dcr2Δ::his3MX (BY4741 otherwise) | This study |
| SCMSP135 | bck2Δ::kanMX dcr2Δ::his3MX (BY4741 otherwise) | This study |
| SCMSP128 | swi4Δ::kanMX dcr2Δ::his3MX (BY4741 otherwise) | This study |
| YSC1178-7501699 | SIC1-TAP::his3MX (BY4741 otherwise) | Open Biosystems |
| 10366 | cln3Δ::kanMX (BY4742 otherwise) | Res. Genetics |
| 16163 | bck2Δ::kanMX (BY4742 otherwise) | Res. Genetics |
| 16109 | swi4Δ::kanMX (BY4742 otherwise) | Res. Genetics |
| 36189 | bub2Δ::kanMX/bub2Δ::kanMX (BY4743 otherwise) | Res. Genetics |
| 31392 | mad2Δ::kanMX/mad2Δ::kanMX (BY4743 otherwise) | Res. Genetics |
| 36781 | mad3Δ::kanMX/mad3Δ::kanMX (BY4743 otherwise) | Res. Genetics |
Res. Genetics, Research Genetics.
FIG. 8.

Functional interactions with other START regulators. (A) The steady-state levels of Cln3p-PrA are shown on an immunoblot, from cells carrying the indicated plasmids (in the VAY27-1A background) and the untagged control strain (VAY27-1C). The corresponding levels of Pgk1p are shown as a loading control. (B) Relative budding indices (BI) of CLN3+/CLN3+ and cln3Δ/cln3Δ cells (in the BY4743) background) carrying the indicated plasmids. The averages and standard deviations from at least eight independent transformants in each case are shown. The probability associated with a Student's t test when the indicated samples were compared is shown. (C) Growth of the indicated strains was evaluated by spotting 10-fold serial dilutions of the cultures on solid rich media (yeast extract-peptone-dextrose [YPD]). The plates were incubated at 30°C and photographed after 2 (YPD) or 4 to 5 (YPD plus 1.2 M NaCl) days.
TABLE 4.
Proliferation parameters of CLN3, BCK2, SWI4, GID8, and DCR2 mutantsa
| Strain | gb | Cell size (μm3) |
|---|---|---|
| WTc | 1 ± 0.02 | 36.6 ± 1.6 |
| gid8Δ | 1.01 ± 0.01 | 37.1 ± 1.6 |
| dcr2Δ | 1.01 ± 0.02 | 37.0 ± 1.6 |
| gid8Δ dcr2Δ | 1 ± 0.03 | 42.0 ± 1.6 |
| bck2Δ | 1 ± 0.02 | 45.6 ± 1.7 |
| bck2Δ gid8Δ dcr2Δ | 1 ± 0.02 | 49.5 ± 1.7 |
| cln3Δ | 1.05 ± 0.03 | 49.2 ± 1.7 |
| cln3Δ gid8Δ dcr2Δ | 1.05 ± 0.02 | 54.3 ± 1.8 |
| swi4Δ | 1.08 ± 0.01 | 48.4 ± 1.7 |
| swi4Δ gid8Δ dcr2Δ | 1.07 ± 0.01 | 56.8 ± 1.9 |
Cell numbers and cell sizes were obtained with a Coulter counter as described in Materials and Methods. The average and standard deviation from three independent liquid cultures in rich yeast extract-peptone-dextrose media are shown in each case. All the strains were in the haploid BY4741 background.
The generation times (g) of the strains shown are relative to that of wild type, which was 94 ± 1.9 min.
WT, wild type.
The CLN3-2D-CEN plasmid p205 (see Fig. 1) and the PGAL-CLN3 low-copy-number plasmid pW16 (see Fig. 2) were gifts from F. Cross (5). The high-copy-number plasmids described in this report were isolated from a yeast genomic DNA library (4) as we previously described (1). Standard molecular biology techniques (28) with reagents from New England Biolabs (Beverly, Mass.) were used to characterize the plasmids isolated from our enrichment procedure (1). The plasmid inserts were sequenced with vector-specific primers from both ends. Sequencing was performed at the Texas A&M University Genome Technologies Laboratory. We then digested the plasmids with the restriction endonucleases indicated in Table 2. The products were gel purified by DNA agarose gel electrophoresis to remove the small DNA fragments released from the digestion reaction. The purified products were then treated with T4 DNA polymerase to generate blunt ends and religated to produce the plasmid derivatives indicated in Table 2. These plasmid derivatives were then transformed into the BY4743 strain, and the budding indices of the transformants were evaluated (see Table 2).
FIG. 1.

Gid8p and Dcr2p affect cell cycle progression. (A) Synchronous cultures of BY4743 cells carrying the empty vector-2μ, GID8-2μ, or DCR2-2μ were obtained by elutriation. At the indicated time points the DNA content was evaluated by flow cytometry. Cell numbers are plotted on the y axis, and the x axis indicates fluorescence intensity. Cell cycle progression was also monitored by determining the percentage of unbudded cells (%UB). Cell size was measured with a Channelyzer. (B) Cells carrying the indicated plasmids and a TAP-tagged copy of SIC1 were arrested with nocodazole for 4 h and then released into drug-free fresh SC-glucose-containing media at 30°C. Aliquots of the culture at the indicated times were then processed for immunoblotting against Sic1p fused to the tandem affinity purification (TAP) epitope, as described in Materials and Methods. The blots were also stained with Ponceau S to indicate protein loading. (C) The cell sizes for asynchronous cultures of diploid BY4743 cells in SC-glucose media at 30°C carrying the indicated plasmids are shown. For these samples, the geometric means and standard deviations for vector-2μ, GID8-2μ, and DCR2-2μ transformants were 76 ± 2, 74 ± 2, and 78 ± 2, respectively. (D) Sensitivity to α-factor of haploid BY4741 cells carrying the indicated plasmids was evaluated by spotting 10-fold serial dilutions of the corresponding cultures on solid media containing increasing concentrations of α-factor. The plates were incubated at 30°C and photographed after 2 days.
FIG. 2.

Overexpression of GID8 and DCR2 accelerates completion of START. (A) Wild-type diploid cells (WT), heterozygous for PGAL-GID8+/GID8+ (GAL-GID8) or PGAL-DCR2+/DCR2 (GAL-DCR2) or carrying a PGAL-CLN3-CEN plasmid (GAL-CLN3), were grown and elutriated in raffinose-containing media to obtain a synchronous early G1 population of cells in each case. Galactose was then added, and progression through the cell cycle was evaluated as for Fig. 1. All the strains were in the BY4743 background. (B) The percentages of cells in G1 from the flow cytometry panels in panel A were calculated from the DNA histograms with the ModFit software (Verity Software House, Topsham, Maine).
TABLE 2.
Schematic representation of plasmids and their derivativesa
 |
Genomic fragment present in each plasmid. The ORF within each insert is drawn to scale, but the scale is not the same between different inserts. Translation from the “Watson” (or “Crick”) strand is indicated by the placement of the ORF above (or below) the line that denotes the chromosomal insert. The number of the chromosome from which the insert is derived is indicated. The numbers on either sides of the full insert denote their respective chromosomal positions.
The relative budding index (BI) associated with each plasmid with respect to that for the empty vector. All the measurements were performed in SC-glucose media at 30°C. The average and standard deviation from at least 18 different transformants (all in the BY4743 background) in each case are shown.
To construct the DCR2-H338A point mutant allele (see Fig. 6), we used two complementary oligonucleotides that encoded the desired H338A substitution: DCR2-H338A-FWD (5′-TTCCGTGGGCAATGGTATGGGGAAATGCCGACGACGAGGGAAGCTTAACGCGCTGGCAG-3′) and DCR2-H338A-REV (5′-TGCCAGCGCGTTAAGCTTCCCTCGTCGTCGGCATTTCCCCATACCATTGCCCACGGAA-3′). These were then used in two separate PCRs with plasmid 2-6 (ΔXhoI-SmaI) as the template and primers corresponding to sequences flanking the DCR2 ORF downstream (5′-CTGATGTCGCAGGACGAGTC-3′; used with the DCR2-H338A-FWD primer) and upstream (5′-TAACTTGTATAAAGCTGCGC-3′; used with the DCR2-H338A-REV primer). The two PCR products were then purified after agarose gel electrophoresis and used in a third overlap extension PCR (14) with the outside flanking primers. The product of this reaction was isolated and cotransformed into yeast cells together with plasmid 2-6 (ΔXhoI-SmaI), which was previously linearized by KpnI and SacI digestion (cutting at positions +34 and +712 of the DCR2 ORF, respectively). The gap-repaired plasmid derivative was then recovered from yeast transformants by standard methods (17). The chromosomal insert spanning DCR2 (DCR2 is on chromosome XII from position 849123 to 847387) was then sequenced from position 849643 to 846970 to verify the introduced H338A mutation and the absence of any other mutations. This plasmid was called DCR2-H338A, and it was used in the experiments shown in Fig. 6 and 7.
FIG. 6.

Dcr2p might function as a phosphoesterase. (A) DCR2 is predicted to encode a polypeptide with a metallophosphoesterase (metallophos) domain. Numbers indicate amino acid positions of the predicted Dcr2p polypeptide. (B) Relative phosphatase specific activity from crude cell extracts (means ± standard deviations; n ≥ 3) from haploid cells. Where indicated, the strains were transformed with a high-copy-number plasmid carrying DCR2 (DCR2-2μ, DCR2-H338A (DCR2-H338A-2μ), or the empty high-copy-number vector (vector-2μ). (C) Relative budding indices (BI) of DCR2+ and PGAL-DCR2+ cells (in the BY4741 background) carrying the indicated plasmids. The averages and standard deviations from at least eight independent transformants in each case are indicated. (D) Relative budding indices of GID8+/GID8+ and PGAL-GID8+/GID8+ cells (in the BY4743 background) carrying the indicated plasmids. The averages and standard deviations from at least eight independent transformants in each case are indicated.
FIG. 7.
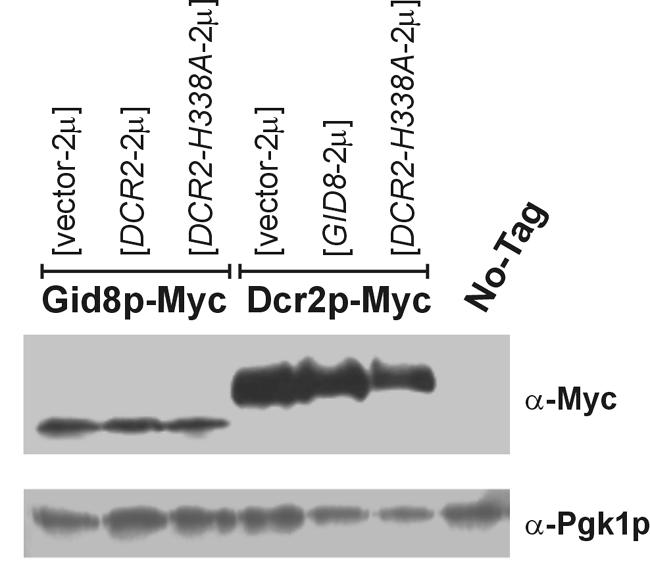
Steady state levels of Myc-tagged Gid8p and Dcr2p in cells carrying the indicated high-copy-number plasmids or the untagged control strain are shown on an immunoblot produced with an anti-Myc antibody. The corresponding levels of Pgk1p are shown as a loading control. All the cells were in the haploid BY4741 background.
Cell synchronization.
For the elutriations shown in Fig. 1, the cells were collected at a pump speed of 62 ml/min and rotor speed of 2,400 rpm, by using a Beckman J6 M/E centrifugal elutriator, and cultured in synthetic complete (SC) glucose-containing media at 30°C. For the experiments shown in Fig. 2, the cells were grown and elutriated in SC-raffinose media at a pump speed of 33 ml/min and rotor speed of 2,400 rpm. After elutriation, galactose (at 2%, wt/vol) was used to induce expression of the gene under GAL control at time 0, as indicated in the figure. For the experiments shown in Fig. 4, the cells were cultured in SC glucose-containing media and collected at a pump speed of 40 ml/min and rotor speed of 2,400 rpm.
FIG. 4.

Loss of GID8 and DCR2 delays completion of START. (A) Wild-type (WT) haploid cells and gid8Δ, dcr2Δ, and gid8Δ dcr2Δ cells were grown and elutriated in SC-glucose-containing media. All the strains were in the BY4741 background. At the indicated time points the DNA content was evaluated by flow cytometry. Cell numbers are plotted on the y axis, and the x axis indicates fluorescence. Cell size was measured with a Channelyzer. The percentage of G1 cells was calculated from the DNA histograms with ModFit software (Verity Software House). (B) Cell cycle progression was also monitored by determining the percentage of budded cells, from the samples shown in panel A.
For the arrest-and-release experiment shown in Fig. 1, the cells were cultured in SC glucose-containing media at 30°C and incubated with nocodazole (Sigma, St. Louis, Mo.) at 15 μg/ml for 4 h. They were then resuspended in drug-free media, and aliquots of the culture were collected for further analysis.
Budding index, DNA content, cell size, and doubling time measurements.
The percentage of budded cells (budding index) was evaluated as described previously (34). DNA content was evaluated by flow cytometry as described previously (3). The mean cell volume of live unfixed samples was measured with a Beckman Coulter Z2 Channelyzer. The data were analyzed with the manufacturer's AccuComp software. The geometric mean is indicated in each case. For population doubling (generation) time measurements we used the Channelyzer to obtain cell numbers (N) at multiple time points (t) during the exponential growth of the culture. From the slope of the line obtained after plotting ln N versus t, we got the specific growth rate constant of the culture (k). The culture's doubling time (g) was then calculated from the formula g = ln 2/k.
Other techniques.
Immunoprecipitations for HA- and Myc-tagged proteins were performed with kits from Pierce (Rockford, Ill.), according to the manufacturer's instructions. For immunoblotting, anti-HA (rabbit polyclonal) and anti-Myc (mouse monoclonal) antibodies were obtained from Abcam (Cambridge, Mass.) and used at a 1:5,000 dilution. The anti-Pgk1p antibody was from Molecular Probes (Eugene, Oreg.) and used at a 1:2,000 dilution. Protein A fusion proteins were detected with the peroxidase-antiperoxidase soluble-complex reagent from Sigma, used at a 1:1,000 dilution. The horseradish peroxidase-conjugated secondary antibodies used for immunoblotting were from Abcam, and they were used at a 1:10,000 dilution. The blots were processed with reagents from Pierce.
For fluorescence microscopy, unless otherwise indicated, we followed the protocols of the Botstein laboratory, as described at http://genome-www.stanford.edu/group/botlab/protocols.html/. DAPI (4′,6′-diamidino-2-phenylindole) was from Molecular Probes. All the secondary antibodies used in immunofluorescence were from Jackson ImmunoResearch (West Grove, Pa.). The samples were examined with a Nikon Eclipse TS100 inverted fluorescence microscope.
For the phosphatase assays reported in Fig. 6, crude cell extracts were mixed with an equal volume of assay buffer containing 200 mM Tris-HCl (pH 7.8), 2 mM MgCl2, 20 mM dithiothreitol, and 40 mM 4-nitrophenylphosphate, prepared fresh each time. The protein concentration of the crude cell extract in the supernatant was determined by the Bradford assay with reagents from Sigma, according to the manufacturer's instructions. To obtain the enzymatic rates, the absorbance was measured at 405 nm every 5 s for 1 min with a Beckman DU 530 spectrophotometer.
RESULTS
GID8 and DCR2 alter cell cycle progression when overexpressed.
We identified plasmids 5-18 and 2-6 in a screen for cell cycle regulators (1). Both plasmids significantly increased the fraction of budded cells (budding index) without altering the overall generation time in asynchronous cultures (Tables 2 and 3). Within the chromosomal insert of plasmid 5-18 there are the full-length ORFs of REC114, YMR134W, and YMR135C. Plasmid 2-6 carries VPS38, YLR361C, and YLR361C-A.
TABLE 3.
Genetic interactions between GID8 and DCR2
| Straina | Budding index (n; P)b |
|---|---|
| GID8+DCR2+ (vector-2μ) | 1 ± 0.12 (19; 1) |
| GID8+DCR2+ (GID8-2μ) | 1.29 ± 0.10 (18; 3 × 10⁻¹⁰) |
| GID8+DCR2+ (DCR2-2μ) | 1.14 ± 0.12 (20; 5 × 10⁻⁴) |
| GID8+dcr2Δ (GID8-2μ) | 1.05 ± 0.09 (18; 0.1) |
| gid8Δ DCR2+ (DCR2-2μ) | 1.11 ± 0.07 (19; 1 × 10⁻³) |
| gid8Δ DCR2+ (vector-2μ) | 1.03 ± 0.12 (20; 0.5) |
| GID8+dcr2Δ (vector-2μ) | 1.02 ± 0.08 (19; 0.5) |
| gid8Δ dcr2Δ (vector-2μ) | 1.01 ± 0.1 (32; 0.8) |
| GID8+DCR2+ (vector-2μ)* | 1 ± 0.05 (30) |
| GID8+DCR2+ (GID8-2μ)* | 1.17 ± 0.05 (30; 7 × 10⁻¹¹) |
| GID8+PGAL-DCR2 (vector-2μ)* | 1.23 ± 0.10 (30; 8 × 10⁻⁹) |
| GID8+PGAL-DCR2 (GID8-2μ)* | 1.22 ± 0.08 (30; 3 × 10⁻¹⁰) |
The cells (all in the BY4741 background) were grown in SC media, at 30°C, with glucose or galactose (*) as the carbon source. In these growth conditions, the generation times of all strains were indistinguishable from those of the wild type (94 ± 3 min in glucose-containing media and 165 ± 5 min in galactose-containing media).
The mean and standard deviation of the relative budding index, compared to those for the wild type, are shown in each case. The numbers of individual cultures evaluated (n) and the probabilities associated with Student's t test when the budding indices are compared to that for the wild type are shown in parentheses.
To identify the genes of interest, we disrupted individual ORFs by digestion with restriction endonucleases and religation and, in transformants carrying these plasmid derivatives, we looked for budding index values similar to that for the wild type. Removing a BamHI-BglII fragment from plasmid 5-18, which disrupts only YMR135C (Table 2), led to the loss of the high-budding-index phenotype of the cells carrying this plasmid derivative, implying that YMR135C was the gene of interest on plasmid 5-18. Likewise, digestion of plasmid 2-6 with BglII disrupted VPS38 and YLR361C, while digestion with KpnI and SalI disrupted YLR361C-A and YLR361C. In both cases the plasmid derivatives did not increase the budding index (Table 2), and, since the YLR361C ORF was the common ORF disrupted in these two cases, we concluded that it might be the gene of interest. We reserved the names DCR1 and DCR2 (dosage-dependent cell cycle regulators 1 and 2) for YMR135C and YLR361C, respectively, with the Saccharomyces Genome Database, according to their guidelines (http://www.yeastgenome.org/gene_guidelines.shtml). In the meantime, another group implicated YMR135C in proteasome-mediated degradation of fructose-1,6-biphosphatase and down regulation of gluconeogenesis and named it GID8 (27). Hereafter, we refer to plasmids 5-18 and 2-6 as GID8-2μ and DCR2-2μ, respectively. Based on reverse transcription-PCR experiments, cells carrying the high-copy-number plasmids overexpress GID8 about 10-fold and overexpress DCR2 about 2-fold (data not shown).
Next we examined the effect of GID8 and DCR2 overexpression on cell cycle progression in a synchronous population of cells obtained by elutriation (Fig. 1). Cells carrying GID8-2μ and DCR2-2μ had a shorter G1 based on budding index and DNA content measurements (Fig. 1A). For example, 45 min after elutriation 79% of wild-type cells were unbudded, compared to only 32% of cells overexpressing GID8 or DCR2 (Fig. 1A). GID8- and DCR2-overexpressing cells also appear to initiate DNA replication at a smaller size than wild-type cells (Fig. 1A; at 30 or 45 min after elutriation). These results suggest that synchronous cultures of cells containing GID8-2μ and DCR2-2μ complete START faster than wild-type cells, consistent with results obtained from asynchronous populations of cells where overexpression of these genes increased the budding index (Table 2 and results below).
We also monitored the levels of the Cdk inhibitor Sic1p in cultures released from a nocodazole arrest (Fig. 1B). In cells carrying GID8 or DCR2 on a high-copy-number plasmid, Sic1p disappeared sooner (∼15 min), indicative of a shortened G1 phase (Fig. 1B). Finally, asynchronous populations of GID8- and DCR2-overexpressing cells were neither smaller overall nor pheromone resistant (Fig. 1C and D), in contrast to CLN3-overexpressing cells, which are smaller and resistant to pheromone (6, 22).
Gid8p and Dcr2p affect cell cycle progression by regulating START.
GID8 and DCR2 overexpression may alter cell cycle progression either by directly shortening the G1 phase, which leads to a high budding index due to a compensatory expansion of subsequent cell cycle phases, or by simply delaying mitotic progression (34). A mitotic delay can lead to a shorter G1 phase in the next cell cycle, presumably because it allows the cells to grow and reach the critical size for initiation in the next division faster. This is usually accompanied by an increase in the doubling time and cell size of the culture (20), as we have recently shown for SIK1 overexpression (1), which we identified in the same screen that yielded GID8 and DCR2. However, GID8- and DCR2-overexpressing cells were not larger than wild-type cells (Fig. 1A and C), and they proliferated at the same rate as wild-type cells (94 ± 3, 91 ± 1, and 95 ± 3 min for vector-2μ, GID8-2μ, and DCR2-2μ transformants, respectively, at 30°C in SC-glucose media).
We then used heterozygous diploid cells where one copy of GID8 or DCR2 was under the control of a galactose-inducible promoter while the other was under the control of its native promoter. The cells were grown in raffinose-containing media before elutriation so that gene overexpression was not induced. Postelutriation, the cells were shifted to galactose-containing media to induce the GAL promoter and overexpress the gene of interest. Budding index as well as flow cytometry data indicated that, in the presence of galactose, the transition from the G1 to S phase was accelerated in PGAL-GID8 and PGAL-DCR2 strains (Fig. 2). The results obtained were similar to those when CLN3 was overexpressed in the same way, in cells carrying a low-copy-number PGAL-CLN3 plasmid (Fig. 2). Thus, we conclude that Gid8p and Dcr2p most likely affect cell cycle progression by regulating the completion of START.
If GID8 or DCR2 overexpression somehow adversely affects progression through mitosis, this might become apparent in cells lacking checkpoint genes (1). In that case, checkpoint mutant cells may not be able to properly delay cell cycle progression when GID8 or DCR2 is overexpressed, with potentially catastrophic consequences. Bub2p and Mad2,3p are involved in mitotic spindle checkpoint activation by two independent partially redundant pathways, in response to mistakes in spindle alignment (10, 18). However, GID8 or DCR2 overexpression did not alter the viability of bub2Δ, mad2Δ, or mad3Δ mutants (Fig. 3).
FIG. 3.
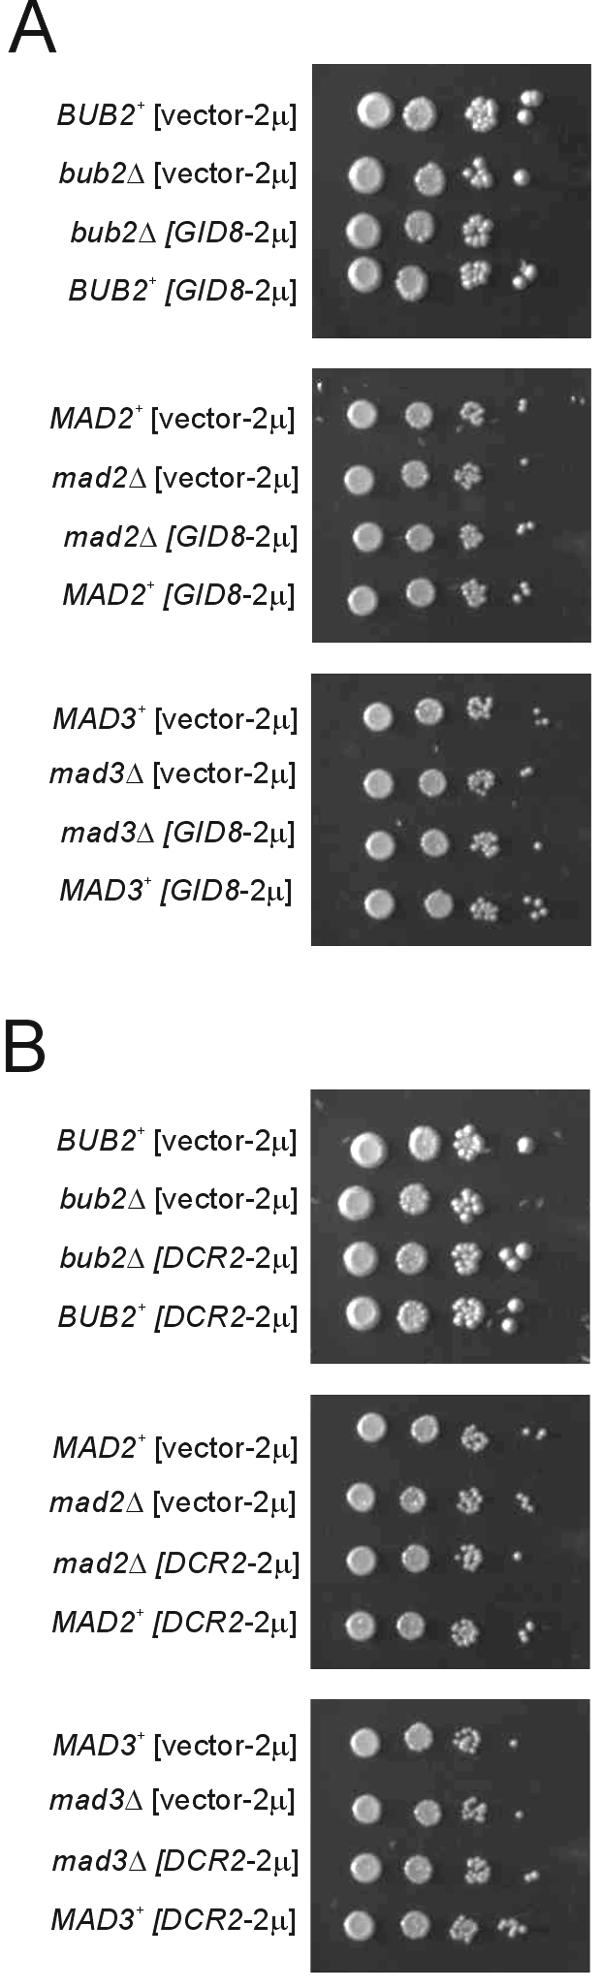
Overexpression of GID8 (A) or DCR2 (B) does not affect the viability of cells lacking mitotic checkpoint genes. Growth of bub2Δ/bub2Δ, mad2Δ/mad2Δ, and mad3Δ/mad3Δ strains (all in the BY4743 background) carrying the indicated plasmids was evaluated by spotting 10-fold serial dilutions of the cultures on solid media. The plates were incubated at 30°C and photographed after 2 days.
Although deletion of GID8 and DCR2, separately or in combination, had no effect on the budding index or the doubling time of the cells (Tables 3 and 4), we also examined cell cycle progression of the resulting loss-of-function mutants in synchronous cultures obtained by elutriation (Fig. 4). Combined loss of GID8 and DCR2 led to a small but significant delay (∼15 min) in the timing of initiation of DNA replication. These cells were also 10 to 15% larger than wild-type cells (Table 4). Loss of DCR2 did not significantly delay START, but cells lacking GID8 were delayed almost to the same extent as double gid8Δ dcr2Δ cells.
Overall, all our data thus far suggest that GID8 and DCR2 have a positive role in G1 and the timing of START.
Gid8p and Dcr2p functionally interact to regulate the G1/S transition.
We next examined if the GID8 and DCR2 gene products may function in a common pathway to regulate the completion of START. We overexpressed one gene product in the absence of the other to see if it resulted in the loss of the high-budding-index phenotype associated with the overexpression of the former gene product. Note that overexpression of Gid8p does not affect Dcr2p levels and vice versa (see Fig. 7). Interestingly, overexpression of GID8 did not increase the budding index of dcr2Δ cells (Table 3), indicating that Gid8p requires the function of Dcr2p to accelerate the G1/S transition. In contrast, Dcr2p does not depend on Gid8p to regulate START, since gid8Δ cells containing the DCR2-2μ plasmid still had a higher budding index than wild-type cells (Table 3). Simultaneous overexpression of both genes, by introducing the GID8-2μ plasmid in PGAL-DCR2 cells and then growing the cells in the presence of galactose, did not produce an additive effect (Table 3). Similar results (see Fig. 6) were also observed when GID8 was galactose induced and DCR2 was on a high-copy-number plasmid. The simplest interpretation of our data is that, to some extent, Gid8p may function in the same pathway with and upstream of Dcr2p to accelerate the G1/S transition. This conclusion is further supported by additional experiments that we describe below, based again on budding index measurements (see Fig. 6). However, from the cell cycle profiles (Fig. 4) and additional experiments we describe below (see Fig. 8), combined loss of Gid8p and Dcr2p had the strongest phenotypic consequences, arguing against an exclusive linear pathway for these two gene products.
Subcellular localization of Dcr2p.
Localization data for Gid8p are available from a genome-wide database (15) (Gid8p was present in both the nucleus and the cytoplasm), but there is no record for Dcr2p's subcellular localization in any database. Consequently, we epitope tagged Gid8p and Dcr2p with HA and c-Myc epitope tags (19). In both cases proteins of the expected size were detected from cell extracts after immunoprecipitations and immunoblotting with anti-HA and anti-Myc antibodies (Fig. 5). Cells carrying the epitope-tagged proteins were indistinguishable from the wild type, based on generation time, cell size, and budding index measurements (data not shown). Overexpression of GID8 in strains carrying a epitope-tagged DCR2 allele still increased the budding index (data not shown). Since Gid8p requires the presence of functional Dcr2p (Table 3), the epitope-tagged Dcr2p probably retains function. Based on the granular staining pattern by immunofluorescence of the HA- or Myc-tagged Gid8p or Dcr2p, we conclude that Gid8p and Dcr2p are present in distinct foci throughout the cell (Fig. 5). Similar results were obtained with a strain carrying a green fluorescent protein-tagged DCR2 allele (data not shown). Despite the similar staining patterns obtained in cells carrying either Gid8p or Dcr2p fusion proteins, in cells coexpressing both there was no evidence of colocalization (Fig. 5C). Attempts to coimmunoprecipitate Gid8p and Dcr2p from these cells were also unsuccessful (data not shown).
FIG. 5.

Subcellular localization of Gid8p and Dcr2p. (A and B, top) Immunoblots showing HA- or Myc-tagged Gid8p and Dcr2p, immunoprecipitated from cell extracts of the corresponding strains. (Bottom) Cells carrying a single epitope-tagged copy of the product of GID8 or DCR2, expressed from its native chromosomal location, or untagged controls (BY4742 for the HA-tagged strains or BY4741 for the Myc-tagged strains) were photographed through phase optics (left) and by fluorescence microscopy. The nuclei (middle) were visualized by DAPI staining. Epitope-tagged Gid8p or Dcr2p (right) were visualized by immunofluorescence. (C) Cells coexpressing Gid8p-HA and Dcr2p-Myc were processed as described for panels A and B and compared to the untagged control strain (BY4743). The merged colored image was produced by false coloring the Gid8p-HA image green and the Dcr2p-Myc image red.
DCR2-H338A antagonizes wild-type DCR2.
The DCR2 ORF is predicted to encode a 578-amino-acid protein of 66,463 Da. Motif searches suggested that Dcr2p may belong to a family of calcineurin-like metal-containing phosphoesterases (E value = 1e−5, from CDART [11]), which includes protein phosphoserine phosphatases, nucleotidases, nucleases, sphingomyelin phosphodiesterases, and 2′-3′ cyclic AMP phosphodiesterases. Within the conserved βαβαβ phosphoesterase structure there are sequence “signatures” common to these proteins. Among them is a GNHD/E sequence motif, thought to be important for the hydrolysis of phosphate esters in the active-site dinuclear metal center (36). Mutational analysis suggested that the His of the GNHD motif probably affects catalysis but not substrate binding in λ Ser/Thr phosphatase and calcineurin (21, 36).
To test the possibility that Dcr2p may function as a phosphoesterase, we introduced an H338A mutation in the GNHD motif of Dcr2p (Fig. 6A). The presence of this DCR2-H338A allele does not alter the endogenous levels of Dcr2p or Gid8p (Fig. 7). In phosphatase assays with 4-nitrophenylphosphate as a substrate, crude extracts from cells lacking DCR2 or carrying the DCR2-H338A allele had significantly lower (∼20%) phosphatase activity than extracts from wild-type cells (Fig. 6B). However, in the same assays extracts from cells overexpressing DCR2 had only minimally increased (∼5%) phosphatase activity (Fig. 6B). This could be due to the high background of this crude assay.
We then examined the ability of the DCR2-H338A allele to interfere with the two phenotypic attributes of the wild-type DCR2: first, overexpression of DCR2 increases the budding index; second, DCR2 is necessary for GID8 overexpression to increase the budding index. However, in cells carrying DCR2-H338A, overexpression of wild-type DCR2 (Fig. 6B) or GID8 (Fig. 6C) did not increase the budding index. Therefore, DCR2-H338A is an antimorph or dominant negative, presumably because it encodes a mutant protein capable of antagonizing the wild-type DCR2 gene product. These results are consistent with a putative role for Dcr2p as a phosphoesterase.
Functional interactions with other START regulators.
Cells carrying GID8 or DCR2 high-copy-number plasmids do not have altered Cln3p levels (Fig. 8A), consistent with the fact that, for these cells, size and resistance to pheromone are similar to those for wild-type cells (Fig. 1). We then overexpressed GID8 and DCR2 in cells lacking CLN3. Interestingly, in the absence of CLN3 GID8-2μ and DCR2-2μ did not increase the budding index, suggesting that Gid8p and Dcr2p may regulate cell cycle progression via Cln3p (Fig. 8B). Thus, a role for Gid8p and Dcr2p in G1 might require Cln3p, but it does not lead to higher Cln3p levels.
We then deleted GID8 and/or DCR2 in cells lacking CLN3, BCK2, or SWI4. Bck2p activates START in a Cln3p-independent manner (33), while Swi4p is a G1/S transcription factor (2). Cells lacking CLN3, BCK2, or SWI4 proliferate at almost the same rate as wild-type cells in rich media, but these mutants are larger than wild-type cells (Table 4). Interestingly, mutants with deletions of CLN3, BCK2, or SWI4 as well as GID8 and DCR2 were even larger (Table 4). The growth rate of the triple mutants was similar to those of cells with a single CLN3, BCK2, or SWI4 deletion in rich liquid (Table 4) or solid (Fig. 8C) media. Surprisingly, in the presence of high salt concentrations there were clear effects, with the triple cln3Δ gid8Δ dcr2Δ and swi4Δ gid8Δ dcr2Δ mutants growing very poorly (Fig. 8C). Cells with double mutations in GID8 or DCR2 and CLN3 or SWI4 proliferated normally, suggesting that GID8 and DCR2 might have synergistic functions under these conditions. Slightly poorer growth was also evident in bck2Δ gid8Δ dcr2Δ cells, but the effect was not as pronounced (Fig. 8C). Therefore, Gid8p and Dcr2p are required for normal rates of cell proliferation under high salt concentrations and in the absence of Cln3p or Swi4p.
DISCUSSION
In this study we have shown that Gid8p and Dcr2p affect cell cycle progression by regulating the completion of START. We discuss these findings in the general context of START control.
Why have GID8 and DCR2 not been previously identified in various screens for START regulators? Since GID8 and DCR2 are not essential, they were not targeted by the classic cdc mutant screen done by Hartwell and colleagues, which focused on essential genes (13). Cells overexpressing GID8 and DCR2 seem to initiate START at a smaller size than wild-type cells (Fig. 1A and 2A), similar to CLN3-overexpressing cells (Fig. 2A). However, unlike overexpression of CLN3, overexpression of GID8 or DCR2 does not change the overall size of the population (Fig. 1C), probably because these cells continue growing to the same size as wild-type cells in subsequent phases of the cell cycle after START completion. They also retain sensitivity to the antimitogenic properties of pheromone (Fig. 1D). Consequently, they would have been missed by previous approaches that relied on overall changes in cell size or resistance to pheromone for the identification of START regulators (6, 8, 16, 24, 26, 30, 35). These properties of GID8 and DCR2 mutants are important because they suggest that the list of START regulators may be larger than previously thought.
At this point, we can only speculate about the possible role(s) of GID8 and DCR2 in START control. Neither GID8 nor DCR2 mRNA levels are cell cycle regulated (29). Gid8p is predicted to contain LisH and CTLH domains (27). These domains have been previously associated with cytoskeletal functions (9). Recently, the mammalian cyclin E/Cdk2 substrate p220 (NPAT) was shown to regulate G1/S histone transcription through its LisH domain (32). It is important, however, that no clear function can be deduced from the presence of these domains. Gid8p does not appear to colocalize with the cytoskeleton based on genome-wide localization data (15) and our own observations (Fig. 5). It was also recently suggested that Gid8p is involved in proteasome-mediated catabolite degradation of fructose-1,6-biphosphatase when cells are transferred from a nonfermentable carbon source to glucose (27). However, since all our experiments did not involve such media changes and since the GID8 overexpression phenotype was evident in steady-state conditions in glucose-rich media, it is unclear what role (if any) this activity might play in the regulation of START.
Based on genetic evidence, Gid8p and Dcr2p may function through a common pathway, with Dcr2p being downstream of Gid8p (Table 3 and Fig. 6), to positively control the timing of START. It is also clear that Gid8p's effects on overall cell proliferation may not solely depend on the presence of Dcr2p, because their combined loss produces more-severe cell size (Table 4) and viability phenotypes in the context of other cell cycle mutations (Fig. 8). The cell size enlargement when GID8 and DCR2 were both deleted was additive to that due to CLN3, BCK2, or SWI4 deletions (Table 4). Combined loss of GID8, DCR2, and SWI4 or CLN3 severely affects overall cell proliferation in high-salt conditions (Fig. 8C). The increase in the budding index of cells carrying GID8 or DCR2 high-copy-number plasmids appears to require the presence of CLN3 (Fig. 8B). Nonetheless, the synthetic effects observed in the plate growth assays on high salt suggest that Gid8p and Dcr2p may also have synergistic functions with Cln3p and Swi4p under these conditions.
The “output” of the Gid8p/Dcr2p pathway will likely involve some type of phospho-ester hydrolysis, since our data strongly point to a phosphoesterase activity of Dcr2p (Fig. 6). This activity could be directed to any one of several types of substrates (for example lipids, nucleic acids, and proteins). It will be an important goal of future studies to identify the substrate(s) of Dcr2p as well as any other factor(s) that impinges on Gid8p/Dcr2p and that is physiologically relevant for cell cycle progression. Overall, our data point to an important role for Gid8p and Dcr2p in the timing of START, and a better understanding of their function(s) at the molecular level will contribute to our understanding of the G1/S transition.
Acknowledgments
We thank J. Miller for flow cytometry, A. Dhasarathy for help with tetrad dissections, and F. Cross for plasmids and strains.
This work was supported by a grant from the National Institutes of Health (R01-GM062377) to M.P.
REFERENCES
- 1.Bogomolnaya, L. M., R. Pathak, R. Cham, J. Guo, Y. V. Surovtseva, L. Jaeckel, and M. Polymenis. 2004. A new enrichment approach identifies genes that alter cell cycle progression in Saccharomyces cerevisiae. Curr. Genet. 45:350-359. [DOI] [PubMed] [Google Scholar]
- 2.Breeden, L. 1996. Start-specific transcription in yeast. Curr. Top. Microbiol. Immunol. 208:95-127. [DOI] [PubMed] [Google Scholar]
- 3.Bryan, B. A., E. McGrew, Y. Lu, and M. Polymenis. 2004. Evidence for control of nitrogen metabolism by a START-dependent mechanism in Saccharomyces cerevisiae. Mol. Genet. Genom. 271:72-81. [DOI] [PubMed] [Google Scholar]
- 4.Carlson, M., and D. Botstein. 1982. Two differentially regulated mRNAs with different 5′ ends encode secreted with intracellular forms of yeast invertase. Cell 28:145-154. [DOI] [PubMed] [Google Scholar]
- 5.Cross, F. R. 1990. Cell cycle arrest caused by CLN gene deficiency in Saccharomyces cerevisiae resembles START-I arrest and is independent of the mating pheromone signalling pathway. Mol. Cell. Biol. 10:6482-6490. [DOI] [PMC free article] [PubMed] [Google Scholar]
- 6.Cross, F. R. 1988. DAF1, a mutant gene affecting size control, pheromone arrest, and cell cycle kinetics of Saccharomyces cerevisiae. Mol. Cell. Biol. 8:4675-4684. [DOI] [PMC free article] [PubMed] [Google Scholar]
- 7.Cross, F. R., V. Archambault, M. Miller, and M. Klovstad. 2002. Testing a mathematical model of the yeast cell cycle. Mol. Biol. Cell 13:52-70. [DOI] [PMC free article] [PubMed] [Google Scholar]
- 8.Edwards, M. C., N. Liegeois, J. Horecka, R. A. DePinho, G. F. J. Sprague, M. Tyers, and S. J. Elledge. 1997. Human CPR (cell cycle progression restoration) genes impart a Far− phenotype on yeast cells. Genetics 147:1063-1076. [DOI] [PMC free article] [PubMed] [Google Scholar]
- 9.Emes, R. D., and C. P. Ponting. 2001. A new sequence motif linking lissencephaly, Treacher Collins and oral-facial-digital type 1 syndromes, microtubule dynamics and cell migration. Hum. Mol. Genet. 10:2813-2820. [DOI] [PubMed] [Google Scholar]
- 10.Fraschini, R., E. Formenti, G. Lucchini, and S. Piatti. 1999. Budding yeast Bub2 is localized at spindle pole bodies and activates the mitotic checkpoint via a different pathway from Mad2. J. Cell Biol. 145:979-991. [DOI] [PMC free article] [PubMed] [Google Scholar]
- 11.Geer, L. Y., M. Domrachev, D. J. Lipman, and S. H. Bryant. 2002. CDART: protein homology by domain architecture. Genome Res. 12:1619-1623. [DOI] [PMC free article] [PubMed] [Google Scholar]
- 12.Giaever, G., A. M. Chu, L. Ni, C. Connelly, L. Riles, S. Veronneau, S. Dow, A. Lucau-Danila, K. Anderson, B. Andre, A. P. Arkin, A. Astromoff, M. El Bakkoury, R. Bangham, R. Benito, S. Brachat, S. Campanaro, M. Curtiss, K. Davis, A. Deutschbauer, K. D. Entian, P. Flaherty, F. Foury, D. J. Garfinkel, M. Gerstein, D. Gotte, U. Guldener, J. H. Hegemann, S. Hempel, Z. Herman, D. F. Jaramillo, D. E. Kelly, S. L. Kelly, P. Kotter, D. LaBonte, D. C. Lamb, N. Lan, H. Liang, H. Liao, L. Liu, C. Luo, M. Lussier, R. Mao, P. Menard, S. L. Ooi, J. L. Revuelta, C. J. Roberts, M. Rose, P. Ross-Macdonald, B. Scherens, G. Schimmack, B. Shafer, D. D. Shoemaker, S. Sookhai-Mahadeo, R. K. Storms, J. N. Strathern, G. Valle, M. Voet, G. Volckaert, C. Y. Wang, T. R. Ward, J. Wilhelmy, E. A. Winzeler, Y. Yang, G. Yen, E. Youngman, K. Yu, H. Bussey, J. D. Boeke, M. Snyder, P. Philippsen, R. W. Davis, and M. Johnston. 2002. Functional profiling of the Saccharomyces cerevisiae genome. Nature 418:387-391. [DOI] [PubMed] [Google Scholar]
- 13.Hartwell, L. H., J. Culotti, J. R. Pringle, and B. J. Reid. 1974. Genetic control of the cell division cycle in yeast. Science 183:46-51. [DOI] [PubMed] [Google Scholar]
- 14.Ho, S. N., H. D. Hunt, R. M. Horton, J. K. Pullen, and L. R. Pease. 1989. Site-directed mutagenesis by overlap extension using the polymerase chain reaction. Gene 77:51-59. [DOI] [PubMed] [Google Scholar]
- 15.Huh, W. K., J. V. Falvo, L. C. Gerke, A. S. Carroll, R. W. Howson, J. S. Weissman, and E. K. O'Shea. 2003. Global analysis of protein localization in budding yeast. Nature 425:686-691. [DOI] [PubMed] [Google Scholar]
- 16.Jorgensen, P., J. L. Nishikawa, B. J. Breitkreutz, and M. Tyers. 2002. Systematic identification of pathways that couple cell growth and division in yeast. Science 297:395-400. [DOI] [PubMed] [Google Scholar]
- 17.Kaiser, C., S. Michaelis, and A. Mitchell. 1994. Methods in yeast genetics. Cold Spring Harbor Laboratory Press, Cold Spring Harbor, N.Y.
- 18.Lew, D. J., and D. J. Burke. 2003. The spindle assembly and spindle position checkpoints. Annu. Rev. Genet. 37:251-282. [DOI] [PubMed] [Google Scholar]
- 19.Longtine, M. S., A. McKenzie III, D. J. Demarini, N. G. Shah, A. Wach, A. Brachat, P. Philippsen, and J. R. Pringle. 1998. Additional modules for versatile and economical PCR-based gene deletion and modification in Saccharomyces cerevisiae. Yeast 14:953-961. [DOI] [PubMed] [Google Scholar]
- 20.Lord, P. G., and A. E. Wheals. 1983. Rate of cell cycle initiation of yeast cells when cell size is not a rate-determining factor. J. Cell Sci. 59:183-201. [DOI] [PubMed] [Google Scholar]
- 21.Mertz, P., L. Yu, R. Sikkink, and F. Rusnak. 1997. Kinetic and spectroscopic analyses of mutants of a conserved histidine in the metallophosphatases calcineurin and lambda protein phosphatase. J. Biol. Chem. 272:21296-21302. [DOI] [PubMed] [Google Scholar]
- 22.Nash, R., G. Tokiwa, S. Anand, K. Erickson, and A. B. Futcher. 1988. The WHI1+ gene of Saccharomyces cerevisiae tethers cell division to cell size and is a cyclin homolog. EMBO J. 7:4335-4346. [DOI] [PMC free article] [PubMed] [Google Scholar]
- 23.Polymenis, M., and E. V. Schmidt. 1999. Coordination of cell growth with cell division. Curr. Opin. Genet. Dev. 9:76-80. [DOI] [PubMed] [Google Scholar]
- 24.Prendergast, J. A., L. E. Murray, A. Rowley, D. R. Carruthers, R. A. Singer, and G. C. Johnston. 1990. Size selection identifies new genes that regulate Saccharomyces cerevisiae cell proliferation. Genetics 124:81-90. [DOI] [PMC free article] [PubMed] [Google Scholar]
- 25.Pringle, J. R., and L. H. Hartwell. 1981. The Saccharomyces cerevisiae cell cycle, p. 97-142. In J. D. Strathern, E. W. Jones, and J. R. Broach (ed.), The molecular biology of the yeast Saccharomyces. Cold Spring Harbor Laboratory Press, Cold Spring Harbor, N.Y.
- 26.Reed, S. I. 1980. The selection of S. cerevisiae mutants defective in the start event of cell division. Genetics 95:561-577. [DOI] [PMC free article] [PubMed] [Google Scholar]
- 27.Regelmann, J., T. Schule, F. S. Josupeit, J. Horak, M. Rose, K. D. Entian, M. Thumm, and D. H. Wolf. 2003. Catabolite degradation of fructose-1,6-bisphosphatase in the yeast Saccharomyces cerevisiae: a genome-wide screen identifies eight novel GID genes and indicates the existence of two degradation pathways. Mol. Biol. Cell 14:1652-1663. [DOI] [PMC free article] [PubMed] [Google Scholar]
- 28.Sambrook, J., E. F. Fritsch, and T. Maniatis. 1989. Molecular cloning: a laboratory manual, 2nd ed. Cold Spring Harbor Laboratory Press, Cold Spring Harbor, N.Y.
- 29.Spellman, P. T., G. Sherlock, M. Q. Zhang, V. R. Iyer, K. Anders, M. B. Eisen, P. O. Brown, D. Botstein, and B. Futcher. 1998. Comprehensive identification of cell cycle-regulated genes of the yeast Saccharomyces cerevisiae by microarray hybridization. Mol. Biol. Cell. 9:3273-3297. [DOI] [PMC free article] [PubMed] [Google Scholar]
- 30.Sudbery, P. E., A. R. Goodey, and B. L. Carter. 1980. Genes which control cell proliferation in the yeast Saccharomyces cerevisiae. Nature 288:401-404. [DOI] [PubMed] [Google Scholar]
- 31.Toone, W. M., B. L. Aerne, B. A. Morgan, and L. H. Johnston. 1997. Getting started: regulating the initiation of DNA replication in yeast. Annu. Rev. Microbiol. 51:125-149. [DOI] [PubMed] [Google Scholar]
- 32.Wei, Y., J. Jin, and J. W. Harper. 2003. The cyclin E/Cdk2 substrate and Cajal body component p220NPAT activates histone transcription through a novel LisH-like domain. Mol. Cell. Biol. 23:3669-3680. [DOI] [PMC free article] [PubMed] [Google Scholar]
- 33.Wijnen, H., and B. Futcher. 1999. Genetic analysis of the shared role of CLN3 and BCK2 at the G1-S transition in Saccharomyces cerevisiae. Genetics 153:1131-1143. [DOI] [PMC free article] [PubMed] [Google Scholar]
- 34.Zettel, M. F., L. R. Garza, A. M. Cass, R. A. Myhre, L. A. Haizlip, S. N. Osadebe, D. W. Sudimack, R. Pathak, T. L. Stone, and M. Polymenis. 2003. The budding index of Saccharomyces cerevisiae deletion strains identifies genes important for cell cycle progression. FEMS Microbiol. Lett. 223:253-258. [DOI] [PubMed] [Google Scholar]
- 35.Zhang, J., C. Schneider, L. Ottmers, R. Rodriguez, A. Day, J. Markwardt, and B. L. Schneider. 2002. Genomic scale mutant hunt identifies cell size homeostasis genes in S. cerevisiae. Curr. Biol. 12:1992-2001. [DOI] [PubMed] [Google Scholar]
- 36.Zhuo, S., J. C. Clemens, R. L. Stone, and J. E. Dixon. 1994. Mutational analysis of a Ser/Thr phosphatase. Identification of residues important in phosphoesterase substrate binding and catalysis. J. Biol. Chem. 269:26234-26238. [PubMed] [Google Scholar]