

Abstract
Background
Ovarian cancer (OC) is a gynecological oncology that has a poor prognosis and high mortality. This study is conducted to identify the key genes implicated in the prognosis of OC by bioinformatic analysis.
Methods
Gene expression data (including 568 primary OC tissues, 17 recurrent OC tissues, and 8 adjacent normal tissues) and the relevant clinical information of OC patients were downloaded from The Cancer Genome Atlas database. After data preprocessing, cluster analysis was conducted using the ConsensusClusterPlus package in R. Using the limma package in R, differential analysis was performed to identify feature genes. Based on Kaplan-Meier (KM) survival analysis, prognostic seed genes were selected from the feature genes. After key prognostic genes were further screened by cluster analysis and KM survival analysis, they were performed functional enrichment analysis and multivariate survival analysis. Using the survival package in R, cox regression analysis was conducted for the microarray data of GSE17260 to validate the key prognostic genes.
Results
A total of 3668 feature genes were obtained, among which 75 genes were identified as prognostic seed genes. Then, 25 key prognostic genes were screened, including AXL, FOS, KLF6, WDR77, DUSP1, GADD45B, and SLIT3. Especially, AXL and SLIT3 were enriched in ovulation cycle. Multivariate survival analysis showed that the key prognostic genes could effectively differentiate the samples and were significantly associated with prognosis. Additionally, GSE17260 confirmed that the key prognostic genes were associated with the prognosis of OC.
Conclusion
AXL, FOS, KLF6, WDR77, DUSP1, GADD45B, and SLIT3 might affect the prognosis of OC.
Keywords: Ovarian cancer, Cluster analysis, Key prognostic genes, Functional enrichment analysis, Multivariate survival analysis
Background
Ovarian cancer (OC), which ranks seventh in incidence and eighth in mortality among tumors in women, is characterized by pelvic pain, bloating, loss of appetite, and abdominal swelling [1]. OC can mainly spread into the lining of bowel and abdomen, and lymph nodes, bladder, liver, and lungs [2]. Usually, the women with more ovulation have higher risk of OC, especially those who have not given birth, have earlier menstruation or later menopause [3]. OC usually has a poor prognosis and high mortality, and most cases are diagnosed at advanced stages as there lacks effective detection means [4]. In 2012, globally 239,000 women were diagnosed with OC and nearly around 152,000 women died of the disease. [3]. Thus, exploring the pathogenesis of OC and developing novel therapies are urgent.
In recent years, several studies have reported the molecular mechanisms of OC. For instance, Li et al. declared that chemokine receptor 4 (CXCR4) plays a critical role in cisplatin-based chemotherapy for patients with epithelial ovarian cancer (EOC) and can be seen as a prognostic factor [5]. Yes-associated protein 1 (YAP) contributes to cell growth and formation of OC both in vivo and in vitro, additionally, YAP and TEA domain family member 4 (TEAD4) may serve as prognostic markers and therapeutic targets for OC [6, 7]. Previous studies demonstrated that high Beclin 1 expression in protein level can be a prognostic factor of OC [8, 9]. Califano et al. deemed that obesity evaluated by Body Mass Index combined with high mobility group A2 (HMGA2) expression can be used for predicting poor prognosis in patients suffered from OC [10]. Forkhead box M1 (FOXM1) expression is reported to be participated in the development and progression of EOC, and FOXM1 is a promising prognostic factor for overall survival and progression-free survival [11, 12]. However, there lacks a overall reveal of the key genes implicated in OC.
To identify the key genes associated with prognosis of OC, microarray data of primary OC tissues, recurrent OC tissues and adjacent normal tissues were obtained. Then, the samples were pre-classified into two groups, and key prognostic genes were screened. Followed by functional enrichment analysis, multivariate survival analysis was carried out to examine the overall influence of these genes on prognosis. Finally, the key prognostic genes were validated by an independent microarray data.
Methods
Data source and data preprocessing
Gene expression data of OC patients (dataset ID: TCGA_OV_exp_u133a) were downloaded from TCGA (The Cancer Genome Atlas, http://cancergenome.nih.gov/) database [13], meanwhile, the relevant clinical information were also obtained. The gene expression data, which were sequenced on the platform of Affymetrix HT Human Genome U133a microarray, included 568 primary OC tissues, 17 recurrent OC tissues, and 8 adjacent normal tissues. The data is level 3 data downloaded from TCGA, in which the expression level of all probes has been normalized. Based on the annotation platform, probes were then mapped into gene symbols. For multiple probes corresponded to a common gene symbol, their values were averaged and defined as the gene expression value.
Cluster analysis and differential analysis
The variance of gene expression levels for each gene in the samples was calculated, and the gene with variance less than 20% of the total variance of all genes was removed. Meanwhile, the median of gene expression level for each gene in each sample was used as the statistical indicator, and then the gene with median less than 20% of the total median of all genes was eliminated. The expression levels of the genes with potential expression changes in each sample were performed centralization. To pre-classify the samples into two groups, cluster analysis was conducted using the ConsensusClusterPlus package [14] in R. Subsequently, the limma package (Linear Models for Microarray Analysis, http://www.bioconductor.org/packages/release/bioc/html/limma.html) [15] in R was utilized to perform differential analysis for each gene in the pre-classified samples, and the genes with p-value < 0.001 were identified as feature genes.
Screening of stable feature genes and key prognostic genes
To obtain novel sample classification and feature genes, the expression levels of feature genes were iteratively used for the above cluster analysis and differential analysis. Then, the novel sample classification and feature genes were separately compared with the previous sample classification and feature genes. If both of them were inconsistent, the expression matrix of the novel feature genes would be applied for the next iteration. The stable feature genes were obtained until at least one of the sample classification and the feature genes was consistent. To further identify the stable feature genes associated with prognosis, the expression level of each gene in each sample was used to classify the samples according to the average expression level of the gene. Then, Kaplan-Meier (KM) survival analysis [16] was carried out, and the feature genes with p-value < 0.01 were taken as prognostic seed genes.
The prognostic seed genes were performed Euclidean distance cluster to reclassify the samples. Then, the reclassified samples were conducted KM survival analysis [16]. Based on this sample classification, the differential expression level of each prognostic seed gene was calculated using the limma package [15] in R, with p-value < 0.001 as the threshold. Log2 fold change (FC) value (with fixed interval) was used as the cut-off criterion for screening gene set. Then, cluster analysis and KM survival analysis [16] successively were performed, and the most significant gen were considered as the ultimately key prognostic genes.
Functional enrichment analysis
Gene Ontology (GO, http://www.geneontology.org/) aims to provide functions of genes and gene products from the following aspects: biological process (BP), molecular function (MF), and cellular component (CC) [17]. Using the clusterProfiler package (http://bioconductor.org/packages/release/bioc/html/clusterProfiler.html) [18] in R, the key prognostic genes were performed GO functional enrichment analysis. The terms with q-value < 0.05 were selected as the significant functions.
Multivariate survival analysis
To examine the overall influence of the key prognostic genes on prognosis, multivariate survival analysis was conducted for the key prognostic genes. Besides, Receiver Operating Characteristic (ROC) curve was drawn using the survivalROC package [19] in R.
Validation of the key prognostic genes using an independent microarray data
To confirm that the repeatability and portability of key prognostic genes, microarray data of GSE17260 were downloaded from Gene Expression Omnibus (GEO, https://www.ncbi.nlm.nih.gov/geo/) and used for survival analysis. GSE17260, which was sequenced on the platform of Agilent-014850 Whole Human Genome Microarray 4x44K G4112F, included a total of 110 serous OC samples. Using the survival package [20] in R, cox regression analysis was conducted for the microarray data.
Results
Data preprocessing, cluster analysis and differential analysis
Through data preprocessing, the expression values of a total of 12042 genes were acquired. After screening the primary OC tissues with clinical information, a total of 564 samples were obtained. The variance and median of gene expression levels were calculated, and then the genes with little expression changes among the samples were removed. After that, a total of 8873 genes were screened. The expression levels of the 8873 genes in the 564 samples were performed centralization. Then, the 564 samples were pre-classified into two groups (one group had 195 samples and the other group had 369 samples) through cluster analysis to identify the prognosis difference among all samples. The heatmap of cluster analysis showed that the 8873 genes could distinguish different samples (Fig. 1). Subsequently, a total of 3668 genes were identified as feature genes using differential analysis.
Fig. 1.
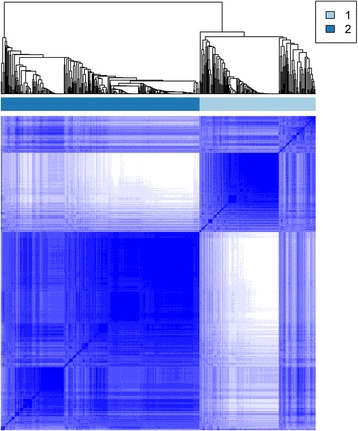
The cluster heatmap for the 8873 genes
Screening of stable feature genes and key prognostic genes
Through the loop iteration of the expression levels of feature genes, a total of 3393 stable feature genes were obtained. The two clusters with different prognosis status of the stable feature genes included 211 samples and 353 samples, respectively. The samples under the same cluster exhibited high correlation (Fig. 2). The clinical features of the two sample groups were further observed, and the result showed that the two group (cluster 1 and cluster 2) samples had significant differences in both the stage (Table 1A) and the grade (Table 1B).
Fig. 2.
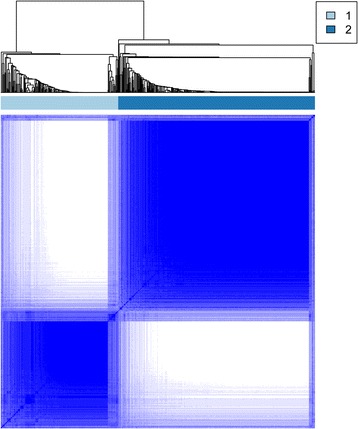
The cluster heatmap for the 3393 stable feature genes
Table 1.
The stage and grade distribution of the two groups of samples divided by the 3393 stable feature genes
| A Cluster | StageIII | StageIV | Total number of samples | Fisher’s exact p-value |
| Cluster1 | 144 | 53 | 197 | 4.699e-06 |
| Cluster2 | 260 | 31 | 291 | |
| B Cluster | G2 | G3 | Total number of samples | Fisher’s exact p-value |
| Cluster1 | 10 | 196 | 206 | 8.491e-06 |
| Cluster2 | 59 | 279 | 338 |
Using KM survival analysis, a total of 75 prognostic seed genes were identified. Afterwards, cluster analysis was conducted for the prognostic seed genes, and the cluster heatmap suggested that the samples could be obviously divided into two groups (one group had 479 samples and the other group had 85 samples) (Fig. 3). Using log-rank test, the survival analysis for the two group samples showed that they had significant differences in prognosis (Fig. 4), indicating that the prognostic seed genes could classify the samples in prognostic level.
Fig. 3.
The cluster heatmap for the 75 prognostic seed genes
Fig. 4.
The result of survival analysis for the two groups of samples divided by the 75 prognostic seed genes
The cluster heatmap showed that the expression levels of some genes among the 75 prognostic seed genes were not very obvious, thus the key prognostic genes were further extracted. After trying different log2 FC value for screening gene set, we found that |log2FC| > 0.7 was the most optimal threshold. Under |log2FC| > 0.7, the gene set containing 25 genes had the most significant influence on prognosis, as they can distinguish patients with different survival status. Thus, the 25 genes were selected as the key prognostic genes, including AXL receptor tyrosine kinase (AXL), FBJ murine osteosarcoma viral oncogene homolog (FOS), Kruppel-like factor 6 (KLF6), WD repeat domain 77 (WDR77), dual specificity phosphatase 1 (DUSP1), growth arrest and DNA damage inducible beta (GADD45B), and slit guidance ligand 3 (SLIT3) (Table 2).
Table 2.
The information of the 25 key prognostic genes
| Gene symbol | Gene Name |
|---|---|
| AXL | AXL receptor tyrosine kinase |
| EHD2 | EH domain containing 2 |
| FOS | FBJ murine osteosarcoma viral oncogene homolog |
| KLF6 | Kruppel-like factor 6 |
| MKS1 | Meckel syndrome, type 1 |
| PDLIM2 | PDZ and LIM domain 2 |
| RAB31 | RAB31, member RAS oncogene family |
| TIMP3 | TIMP metallopeptidase inhibitor 3 |
| WDR77 | WD repeat domain 77 |
| ZFP36 | ZFP36 ring finger protein |
| CSF2RB | colony stimulating factor 2 receptor beta common subunit |
| DUSP1 | dual specificity phosphatase 1 |
| FMO2 | flavin containing monooxygenase 2 |
| GFPT2 | glutamine-fructose-6-phosphate transaminase 2 |
| GADD45B | growth arrest and DNA damage inducible beta |
| GAS1 | growth arrest specific 1 |
| INHBA | inhibin beta A |
| KIF26B | kinesin family member 26B |
| MMP19 | matrix metallopeptidase 19 |
| GALNT10 | polypeptide N-acetylgalactosaminyltransferase 10 |
| RGS16 | regulator of G-protein signaling 16 |
| RGS2 | regulator of G-protein signaling 2 |
| STK3 | serine/threonine kinase 3 |
| SLIT3 | slit guidance ligand 3 |
| TUBB6 | tubulin beta 6 class V |
Functional enrichment analysis
With q-value < 0.05 as the threshold, the 25 key prognostic genes were significantly enriched in 14 terms. The enriched functions mainly included ovulation cycle (q-value = 0.004227, which involved AXL and SLIT3), reproductive structure development (q-value = 0.004227), and regulation of reproductive process (q-value = 0.004227) (Table 3).
Table 3.
The GO (Gene Ontology) functions enriched for the 25 key prognostic genes
| Term | Description | Gene symbol | Q-value |
|---|---|---|---|
| GO:0042698 | ovulation cycle | INHBA, MMP19, SLIT3, AXL | 0.004227 |
| GO:0048608 | reproductive structure development | INHBA, MMP19, WDR77, STK3, SLIT3, AXL | 0.004227 |
| GO:2000241 | regulation of reproductive process | INHBA, WDR77, STK3, DUSP1 | 0.004227 |
| GO:0061458 | reproductive system development | INHBA, MMP19, WDR77, STK3, SLIT3, AXL | 0.004227 |
| GO:0046660 | female sex differentiation | INHBA, MMP19, SLIT3, AXL | 0.004227 |
| GO:0001554 | luteolysis | MMP19, SLIT3 | 0.004227 |
| GO:1901654 | response to ketone | KLF6, SLIT3, DUSP1, FOS | 0.009043 |
| GO:0097305 | response to alcohol | INHBA, KLF6, SLIT3, DUSP1, FOS | 0.012039 |
| GO:0022602 | ovulation cycle process | INHBA, MMP19, SLIT3 | 0.024753 |
| GO:0051591 | response to cAMP | MMP19, DUSP1, FOS | 0.025054 |
| GO:0030728 | ovulation | INHBA, MMP19 | 0.027454 |
| GO:0008585 | female gonad development | INHBA, MMP19, SLIT3 | 0.027454 |
| GO:0046545 | development of primary female sexual characteristics | INHBA, MMP19, SLIT3 | 0.028787 |
| GO:0007548 | sex differentiation | INHBA, MMP19, SLIT3, AXL | 0.030429 |
Multivariate survival analysis
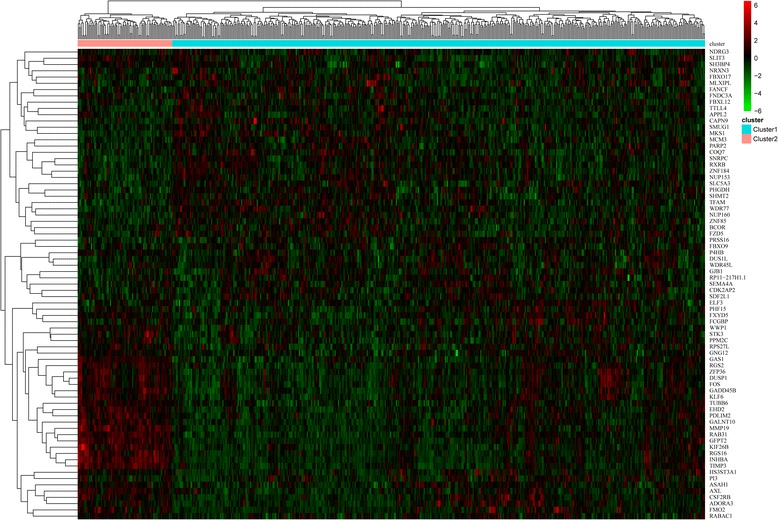
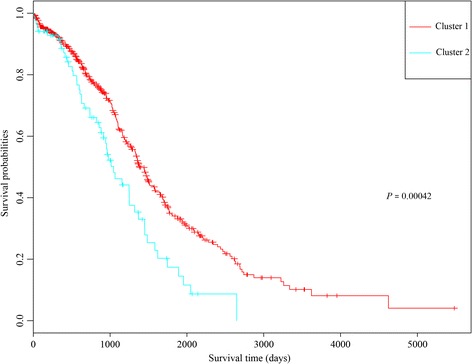
The cluster heatmap of the 25 key prognostic genes suggested that these genes could divide the samples into two groups (Fig. 5). The multivariate survival analysis for the key prognostic genes showed that the overall survival time of the patients in the two groups had significant difference (p-value = 0.00226) (Fig. 6). Therefore, the 25 key prognostic genes could effectively differentiate the samples and were significantly associated with prognosis.
Fig. 5.
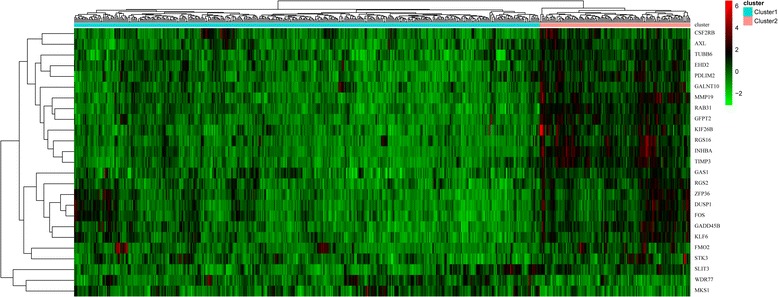
The cluster heatmap for the 25 key prognostic genes
Fig. 6.
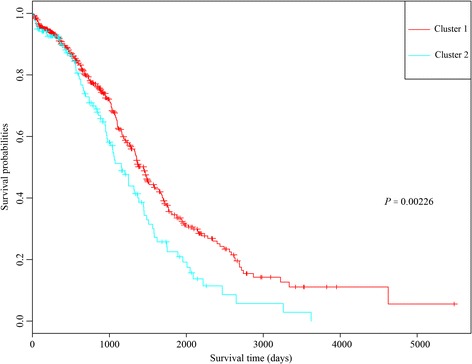
The Kaplan-Meier (KM) survival curve for the two groups of samples divided by the 25 key prognostic genes
Validation of the key prognostic genes using an independent microarray data
The microarray data of GSE17260 were taken as validation dataset to confirm that the repeatability and portability of the key prognostic genes. Multivariate survival analysis showed that the 25 key prognostic genes also had good classification effects for the validation dataset (Fig. 7). This suggested that the 25 key prognostic genes were key genes affecting the prognosis of OC.
Fig. 7.
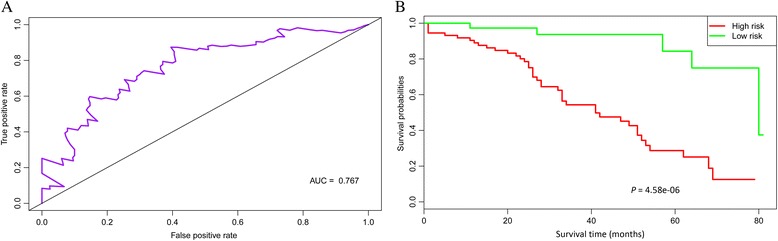
The Receiver Operating Characteristic (ROC) curve (a) and Kaplan-Meier (KM) survival curve (b) of multivariate survival analysis for the validation dataset. The results showed that the 25 key prognostic genes also had good classification effects for the validation dataset
Discussion
In this study, a total of 564 samples were obtained from data preprocessing, which were pre-classified into two groups. Afterwards, differential analysis identified 3668 feature genes. Besides, 3393 stable feature genes were obtained through loop iteration, and 75 genes among them were identified as prognostic seed genes. Moreover, 25 prognostic seed genes were selected as the key prognostic genes (including AXL, FOS, KLF6, WDR77, DUSP1, GADD45B, and SLIT3). Multivariate survival analysis indicated that the 25 key prognostic genes could effectively differentiate the samples and were significantly associated with prognosis. In addition, the microarray data of GSE17260 further confirmed that the key prognostic genes were key genes affecting the prognosis of OC.
GADD45 proteins mediate many cellular functions such as cell cycle control, genotoxic stress, DNA repair, and senescence, additionally, GADD45 proteins functions as tumor suppressors through their pro-apoptotic activities [21, 22]. Overexpression of GADD45A may be implicated in the pro-apoptosis effect of the synthetic retinoid CD437 on ovarian cancer cells [23]. Oliveira-Ferrer et al. deem that c-FOS may affect OC progression through exerting pro-apoptotic effect and altering peritoneal adhesion of OC cells [24]. Mahner et al. find that down-regulated c-Fos plays a role in tumor progression in OC and c-Fos may be used as prognostic factor for the disease [25]. Furthermore, KLF6 and its alternative splicing isoform KLF6-SV1 are related to the main clinical characteristics of EOC, thus they may serve as therapeutic targets for changing the development and dissemination of OC [26]. Above evidence declared that GADD45B, FOS, and KLF6 might be correlated with the prognosis of OC.
Ligr et al. find that p44/Mep50/WDR77 is associated with hormone effects during ovarian tumorigenesis [27]. Via regulating the p38 MAPK-mediated p-glycoprotein overexpression, DUSP1 may cause the resistance of human OC cells to paclitaxel [28, 29]. The glucocorticoid administration to OC patients is correlated with increased expression of map kinase phosphatase 1 (MKP1, also known as DUSP1) and serum and glucocorticoid-regulated kinase 1 (SGK1), indicating that glucocorticoids may weaken chemotherapy effect in OC patients by promoting the expression of anti-apoptotic genes [30]. Additionally, MKP1 can be induced by cisplatin via ERK signaling-associated phosphorylation, and the ERK-MKP1 signaling functions in overcoming cisplatin resistance in OC patients [31]. Thus, WDR77 and DUSP1 might play roles in the development of OC.
Previous study find that Growth arrest-specific gene 6 (GAS6)/AXL pathway has an influence on the complex events occurring during the early stage of OC [32]. GAS6/AXL targeting can be an effective mean for inhibiting the progression of metastatic OC, and the soluble AXL receptor is a promising agent for treating the disease [33]. Since cortisol suppressing SLIT/Roundabout (ROBO) pathway contributes to the regeneration of ovarian surface epithelium, the pathway may be a target for controlling the SLIT/ROBO system in OC [34, 35]. Qiu et al. demonstrate that SLIT2 can serve as tumor suppressor in OC, thus it may be used as a promising therapeutic target for the disease [36]. Functional enrichment analysis showed that AXL and SLIT3 were enriched in ovulation cycle, suggesting that AXL and SLIT3 might also be involved in OC through affecting ovulation cycle.
Conclusions
In conclusion, a total of 3668 feature genes and 25 key prognostic genes were screened by bioinformatics analysis. Besides, several key genes (AXL, FOS, KLF6, WDR77, DUSP1, GADD45B, and SLIT3) might be associated with the prognosis of OC. However, the functions of these key genes need to be confirmed by experimental researches in future.
Acknowledgements
This study was supported by the national natural science fund projects (grant number: 81571387) and Funds for start-up program in Shanghai Changhai Hospital (grant number: CH201506).
Funding
none.
Availability of data and materials
The raw data were collected and analyzed by the Authors, and are not ready to share their data because the data have not been published.
Authors’ contributions
JJZ and LL participated in the design of this study.LL,SNL HF and SYC performed the statistical analysis. LL carried out the study and collected important background information.LL,SYC and JJZ drafted the manuscript. All authors read and approved the final manuscript.
Competing interests
The authors declare that they have no competing interest.
Consent for publication
Not applicable.
Ethics approval and consent to participate
Not applicable.
Publisher’s Note
Springer Nature remains neutral with regard to jurisdictional claims in published maps and institutional affiliations.
Abbreviations
- AXL
AXL receptor tyrosine kinase
- BP
Biological process
- CC
Cellular component
- CXCR4
Chemokine receptor 4
- DUSP1
Dual specificity phosphatase 1
- EOC
Epithelial ovarian cancer
- FC
Fold change
- FOS
FBJ murine osteosarcoma viral oncogene homolog
- FOXM1
Forkhead box M1
- GADD45B
Growth arrest and DNA damage inducible beta
- GAS6
Growth arrest-specific gene 6
- GEO
Gene Expression Omnibus
- GO
Gene Ontology
- HMGA2
High mobility group A2
- KLF6
Kruppel-like factor 6
- KM
Kaplan-Meier
- MF
Molecular function
- MKP1
Map kinase phosphatase 1
- OC
Ovarian cancer
- ROC
Receiver Operating Characteristic
- SGK1
Glucocorticoid-regulated kinase 1
- SLIT3
Slit guidance ligand 3
- TCGA
The Cancer Genome Atlas
- TEAD4
TEA domain family member 4
- WDR77
WD repeat domain 77
- YAP
Yes-associated protein 1
References
- 1.Modugno F, Edwards RP. Ovarian cancer: prevention, detection, and treatment of the disease and its recurrence. Molecular mechanisms and personalized medicine meeting report. Int J Gynecol Cancer. 2012;22(8):45–57. doi: 10.1097/IGC.0b013e31826bd1f2. [DOI] [PMC free article] [PubMed] [Google Scholar]
- 2.Cancer UK. Treating advanced ovarian cancer. 2014. [Google Scholar]
- 3.Mcguire S. World Cancer Report 2014. Geneva, Switzerland: World Health Organization, International Agency for Research on Cancer, WHO Press, 2015. Advances in Nutrition. 2016;7(2):418–419. doi: 10.3945/an.116.012211. [DOI] [PMC free article] [PubMed] [Google Scholar]
- 4.Jayson GC, Kohn EC, Kitchener HC, Ledermann JA. Ovarian cancer. Lancet. 2014;384(9951):1376–1388. doi: 10.1016/S0140-6736(13)62146-7. [DOI] [PubMed] [Google Scholar]
- 5.Li J, Jiang K, Qiu X, et al. Overexpression of CXCR4 is significantly associated with cisplatin-based chemotherapy resistance and can be a prognostic factor in epithelial ovarian cancer. BMB Rep. 2014;47(1):33–38. doi: 10.5483/BMBRep.2014.47.1.069. [DOI] [PMC free article] [PubMed] [Google Scholar]
- 6.Xia Y, Chang T, Wang Y, et al. YAP Promotes Ovarian Cancer Cell Tumorigenesis and Is Indicative of a Poor Prognosis for Ovarian Cancer Patients. Plos One. 2014;9(3):e91770. doi: 10.1371/journal.pone.0091770. [DOI] [PMC free article] [PubMed] [Google Scholar]
- 7.Tan G, Cao X, Dai Q, et al. A novel role for microRNA-129-5p in inhibiting ovarian cancer cell proliferation and survival via direct suppression of transcriptional co-activators YAP and TAZ. Oncotarget. 2015;6(11):8676–8686. doi: 10.18632/oncotarget.3254. [DOI] [PMC free article] [PubMed] [Google Scholar]
- 8.Cai M, Hu Z, Liu J, et al. Beclin 1 expression in ovarian tissues and its effects on ovarian cancer prognosis. Int J Mol Sci. 2014;15(4):5292–5303. doi: 10.3390/ijms15045292. [DOI] [PMC free article] [PubMed] [Google Scholar]
- 9.Zhao Y, Chen S, Gou WF, Xiao LJ, Takano Y, Zheng HC. Aberrant Beclin 1 expression is closely linked to carcinogenesis, differentiation, progression, and prognosis of ovarian epithelial carcinoma. Tumor Biology. 2014;35(3):1955–1964. doi: 10.1007/s13277-013-1261-6. [DOI] [PubMed] [Google Scholar]
- 10.Califano D, Pignata S, Losito NS, et al. High HMGA2 Expression and High Body Mass Index Negatively Affect the Prognosis of Patients With Ovarian Cancer. J Cell Physiol. 2014;229(1):53–59. doi: 10.1002/jcp.24416. [DOI] [PubMed] [Google Scholar]
- 11.Ning W, Yu W, Li W, et al. Overexpression of FOXM1 predicts poor prognosis and promotes cancer cell proliferation, migration and invasion in epithelial ovarian cancer. J Transl Med. 2014;12(1):1–13. doi: 10.1186/1479-5876-12-1. [DOI] [PMC free article] [PubMed] [Google Scholar]
- 12.Zhao F, Siu MK, Jiang L, et al. Overexpression of forkhead box protein M1 (FOXM1) in ovarian cancer correlates with poor patient survival and contributes to paclitaxel resistance. Plos One. 2014;9(11):e113478. doi: 10.1371/journal.pone.0113478. [DOI] [PMC free article] [PubMed] [Google Scholar]
- 13.Network CGAR. Comprehensive genomic characterization of squamous cell lung cancers. Nature. 2012;489(7417):519–525. doi: 10.1038/nature11404. [DOI] [PMC free article] [PubMed] [Google Scholar]
- 14.Wilkerson MD, Hayes DN. ConsensusClusterPlus: a class discovery tool with confidence assessments and item tracking. Bioinformatics. 2010;26(12):1572–1573. doi: 10.1093/bioinformatics/btq170. [DOI] [PMC free article] [PubMed] [Google Scholar]
- 15.Ritchie ME, Phipson B, Wu D, et al. limma powers differential expression analyses for RNA-sequencing and microarray studies. Nucleic Acids Res. 2015;43(7):e47. [DOI] [PMC free article] [PubMed]
- 16.Lacny S, Wilson T, Clement F, et al. Kaplan-Meier Survival Analysis Overestimates the Risk of Revision Arthroplasty: A Meta-analysis. Clin. Orthop. Relat. Res. 2015;473(11):3431–3442. doi: 10.1007/s11999-015-4235-8. [DOI] [PMC free article] [PubMed] [Google Scholar]
- 17.Carbon S, Ireland A, Mungall CJ, et al. AmiGO: online access to ontology and annotation data. Bioinformatics. 2009;25(2):288–289. doi: 10.1093/bioinformatics/btn615. [DOI] [PMC free article] [PubMed] [Google Scholar]
- 18.Yu G, Wang LG, Han Y, He QY. clusterProfiler: an R package for comparing biological themes among gene clusters. Omics A Journal of Integrative Biology. 2012;16(5):284–287. doi: 10.1089/omi.2011.0118. [DOI] [PMC free article] [PubMed] [Google Scholar]
- 19.Heagerty PJ, Thomas L, Pepe MS. Time-dependent ROC curves for censored survival data and a diagnostic marker. Biometrics. 2000;56(2):337–344. doi: 10.1111/j.0006-341X.2000.00337.x. [DOI] [PubMed] [Google Scholar]
- 20.Akira M, Yuya M, Yoshihisa N, et al. Kaplan–Meier survival analysis and Cox regression analyses regarding right ventricular septal pacing: Data from Japanese pacemaker cohort. Data Brief. 2016;8:1303–1307. doi: 10.1016/j.dib.2016.07.058. [DOI] [PMC free article] [PubMed] [Google Scholar]
- 21.Tamura RE, de Vasconcellos JF, Sarkar D, Libermann TA, Fisher PB, Zerbini LF. GADD45 proteins: central players in tumorigenesis. Curr Mol Med. 2012;12(5):634–651. doi: 10.2174/156652412800619978. [DOI] [PMC free article] [PubMed] [Google Scholar]
- 22.Salvador JM, Brown-Clay JD, Fornace AJ. Gadd45 in Stress Signaling, Cell Cycle Control, and Apoptosis. Adv. Exp. Med. Biol. 2013;793(10):1–19. doi: 10.1007/978-1-4614-8289-5_1. [DOI] [PubMed] [Google Scholar]
- 23.Jiang T, Soprano DR, Soprano KJ. GADD45A is a mediator of CD437 induced apoptosis in ovarian carcinoma cells. J Cell Physiol. 2007;212(3):771–779. doi: 10.1002/jcp.21073. [DOI] [PubMed] [Google Scholar]
- 24.Oliveira-Ferrer L, Rößler K, Haustein V, et al. c-FOS suppresses ovarian cancer progression by changing adhesion. Br J Cancer. 2013;110(3):753–763. doi: 10.1038/bjc.2013.774. [DOI] [PMC free article] [PubMed] [Google Scholar]
- 25.Mahner S, Baasch C, Schwarz J, et al. C-Fos expression is a molecular predictor of progression and survival in epithelial ovarian carcinoma. Br J Cancer. 2008;99(8):1269–1275. doi: 10.1038/sj.bjc.6604650. [DOI] [PMC free article] [PubMed] [Google Scholar]
- 26.Difeo A, Narla G, Hirshfeld J, et al. Roles of KLF6 and KLF6-SV1 in ovarian cancer progression and intraperitoneal dissemination. Clin Cancer Res. 2006;12(12):3730–3739. doi: 10.1158/1078-0432.CCR-06-0054. [DOI] [PubMed] [Google Scholar]
- 27.Ligr M, Patwa RR, Daniels G, et al. Expression and function of androgen receptor coactivator p44/Mep50/WDR77 in ovarian cancer. Plos One. 2011;6(10):e26250. doi: 10.1371/journal.pone.0026250. [DOI] [PMC free article] [PubMed] [Google Scholar]
- 28.Kang YS, Seok HJ, Jeong EJ, et al. DUSP1 induces paclitaxel resistance through the regulation of p-glycoprotein expression in human ovarian cancer cells. Biochem. Biophys. Res. Commun. 2016;478(1):403–409. doi: 10.1016/j.bbrc.2016.07.035. [DOI] [PubMed] [Google Scholar]
- 29.Kang Y, Nagaraja AS, Armaizpena GN, et al. Adrenergic stimulation of DUSP1 impairs chemotherapy response in ovarian cancer. Clin Cancer Res. 2015;22(7):1713–24. [DOI] [PMC free article] [PubMed]
- 30.Melhem A, Yamada SD, Fleming GF, et al. Administration of glucocorticoids to ovarian cancer patients is associated with expression of the anti-apoptotic genes SGK1 and MKP1/DUSP1 in ovarian tissues. Clin Cancer Res. 2009;15(9):3196–3204. doi: 10.1158/1078-0432.CCR-08-2131. [DOI] [PMC free article] [PubMed] [Google Scholar]
- 31.Wang J, Zhou JY, Wu GS. ERK-dependent MKP-1-mediated cisplatin resistance in human ovarian cancer cells. Cancer Res. 2007;67(24):11933–11941. doi: 10.1158/0008-5472.CAN-07-5185. [DOI] [PubMed] [Google Scholar]
- 32.Sun W, Fujimoto J, Tamaya T. Coexpression of Gas6/Axl in Human Ovarian Cancers. Oncology. 2004;66(6):450–457. doi: 10.1159/000079499. [DOI] [PubMed] [Google Scholar]
- 33.Rankin EB, Fuh KCTaylor TE, Krieg AJ, et al. AXL is an essential factor and therapeutic target for metastatic ovarian cancer. Cancer Res. 2010;70(19):7570–7579. doi: 10.1158/0008-5472.CAN-10-1267. [DOI] [PMC free article] [PubMed] [Google Scholar]
- 34.Dickinson RE, Fegan KS, Ren X, Hillier SG, Duncan WC. Glucocorticoid Regulation of SLIT/ROBO Tumour Suppressor Genes in the Ovarian Surface Epithelium and Ovarian Cancer Cells. Plos One. 2011;6(11):e27792. doi: 10.1371/journal.pone.0027792. [DOI] [PMC free article] [PubMed] [Google Scholar]
- 35.Dickinson RE, Myers M, Duncan WC. Novel regulated expression of the SLIT/ROBO pathway in the ovary: possible role during luteolysis in women. Endocrinology. 2008;149(10):5024–5034. doi: 10.1210/en.2008-0204. [DOI] [PubMed] [Google Scholar]
- 36.Qiu H, Zhu J, Yu J, Pu H, Dong R. SLIT2 is epigenetically silenced in ovarian cancers and suppresses growth when activated. Asian Pac. J. Cancer Prev. 2011;12(3):791–795. [PubMed] [Google Scholar]
Associated Data
This section collects any data citations, data availability statements, or supplementary materials included in this article.
Data Availability Statement
The raw data were collected and analyzed by the Authors, and are not ready to share their data because the data have not been published.