Abstract
W18O49 with a tunable oxidation state was prepared by addition of NaNO3 or NaBH4 as a redox agent in the solvothermal system. The addition of redox agents has no influence on the crystallization of W18O49. The obtained W18O49 structures keep their morphology as a bundle of nanowires with a regular hexagonal on the cross‐section. W18O49 exhibits strong valence‐dependent absorption features in the near‐IR region. Reduced W18O49 with more W5+ has a higher concentration of oxygen vacancies, which enhances the localized surface plasmon resonance effect. Reduced W18O49 exhibits a high photothermal conversion efficiency of 59.6 % and has good photothermal stability.
Keywords: near-IR absorption, oxygen vacancy, photothermal conversion, photothermal stability, tunable oxidation state
1. Introduction
Photothermal conversion is an effective route in utilizing solar energy as well as photoelectric and photochemical methods. It has been widely studied on noble metals (such as Au, Ag), organic compounds (indocyanine green dye, polyaniline), carbon‐based materials (such as carbon nanotubes, graphene), and semiconductors (Cu2‐xS).1 Among these four categories, noble metals are the most studied photothermal materials, because of their localized surface plasmon resonance (LSPR) effect. Plasmons are the collective oscillations of the electron gas in a metal or semiconductor with large amounts of free carriers.2 Optical waves can couple these electron oscillations in the form of propagating surface waves or localized excitation and then generate heat.2 Metals, such as Au and Ag, have been most closely associated with field of plasmonics, as their plasmon resonance positions lie in the visible region.2, 3, 4, 5, 6, 7 The common semiconductors have no LSPR effect because of their low free‐carrier concentrations. Some methods, such as doping with hetero‐valence metal ions, are developed to improve the free‐carrier concentration in metal oxides. For example, tin‐doped indium oxide,8 aluminum‐doped zinc oxide,9 indium‐doped cadmium oxide,10 and niobium‐doped titanium oxide.11 Doping will improve the free‐carrier concentration so as to enhance the near‐IR (NIR) region absorption and adjust the LSPR position.
Tungsten oxide WO3‐x has become a new and intriguing class of plasmonic materials because of their oxygen deficiencies.12 The electrical and optical properties of WO3−x are dominated by localized electrons, which are related to the oxygen deficiencies involved in polarons, which are quasiparticles consisting of charge carrier.13 For example, W18O49 reveals different photoluminescence properties because of different amounts of oxygen vacancies.14 W18O49 is a promising material in many applications such as electrochromic windows,15 optical devices,16 supercapacitors,17 gas sensors,14 photocatalysis,18, 19 and photothermal agents.20 The application of W18O49 as electrochromic windows is attributed to the variation of W valence state by the driving voltage, which is an acceptable electrochromic mechanism.15 Zhou et al. reported that W18O49 with different amounts of W5+ has different electrocatalytic activity.21 Cong et al. reported that W18O49 has a noble‐metal‐comparable surface‐enhanced Raman scattering (SERS) performance,22 and H2‐treated W18O49, which possesses more W5+, displays the greatest SERS enhancement performance. We have prepared W18O49 through a solvothermal reaction.17 It is straightforward to adjust the redox conditions in a Teflon‐lined solvothermal reactor by adding redox agents. Here, we report the preparation of W18O49 with a tunable oxidation state by using NaNO3 or NaBH4 as a redox agent in the solvothermal system. We find that the oxidation state of the W element in W18O49 has a significant influence on the photothermal conversion properties.
2. Results and Discussion
W18O49 with a tunable oxidation state was prepared by addition of NaNO3 or NaBH4 as a redox agent in the solvothermal system. The oxidized product obtained by adding 300 mg NaNO3 is referred to as o‐W18O49. The reduced product obtained by adding 38 mg NaBH4 is referred to as r‐W18O49. The product prepared without a redox agent is referred to as n‐W18O49. Figure 1 a shows the XRD patterns of o‐W18O49, n‐W18O49, and r‐W18O49. The three samples have similar XRD patterns, which match well with that of W18O49 (P2/m, JCPDS No: 71‐2450). The two main diffraction peaks belong to the paralleled crystal face (010) and (020), respectively, and all other diffractions are much broader, implying that the crystal structure has preferential growth orientation along the [010] direction.
Figure 1.
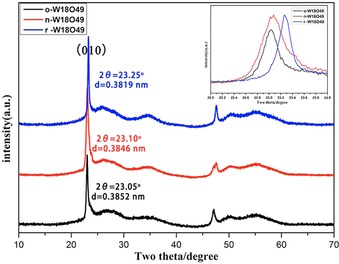
XRD patterns of W18O49 best match with that of the monoclinic W18O49 (P2/m, JCPDS No: 71‐2450). The inset is the partial enlarged graph at the (010) reflection peak position.
XRD results indicate that the addition of a redox agent, NaNO3 or NaBH4, in the solvothermal system has no influence on the crystallization of W18O49. But further analysis of the reflection peak positions indicates that the (010) reflection peak positon has shifted. The positions (2θ) of (010) reflection peak are 23.05, 23.10, and 23.25° for o‐W18O49, n‐W18O49, and r‐W18O49, respectively. According to Bragg's Law, a reflection peak position shift to a higher degree implies a narrowing of the d spacing, which might be caused by an oxygen vacancy. Figures 2 a–c and 2 d–f show SEM and TEM images, respectively, of o‐W18O49, n‐W18O49, and r‐W18O49. The morphology of o‐W18O49, n‐W18O49, and r‐W18O49 is a bundle of nanowires with regular hexagonal packing on the cross‐section. The particle size of o‐W18O49 is about 600 nm in diameter and approximately 150 nm in depth. The particle sizes of n‐W18O49 and r‐W18O49 are similar, measuring about 250 nm in diameter and 300 nm in length. The inset in Figure 2 d is the high‐resolution TEM (HRTEM) image, and the d spacing of 0.380 nm, which is consistent with the XRD result.
Figure 2.
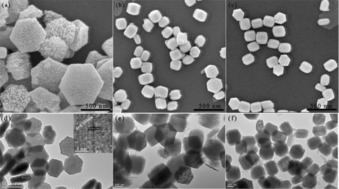
a–c) SEM images of o‐W18O49, n‐W18O49, and r‐W18O49, respectively. d–f) TEM images of o‐W18O49, n‐W18O49, and r‐W18O49, respectively. The inset in (d) is the HRTEM image of the position marked in red.
XPS was used to characterize the tungsten oxidation state. The coexistence of W5+ and W6+ in r‐W18O49 and n‐W18O49 is confirmed by the doublet at about 38.2 and 36.1 eV in Figures 3 b and 3 c, which are assigned to W 4f5/2 and W 4f7/2 of W6+, respectively. The lower binding energy peaks at 37.3 and 34.4 eV belong to W 4f5/2 and W 4f7/2 of W5+, respectively. The percentage of W5+ in r‐W18O49 and n‐W18O49 is estimated to be 24.4 and 16.7 %, according to the integral areas of the peaks. As for o‐W18O49, there is only evidence of the W6+ oxidation state, whose binding energy is located at 37.9 eV (W 4f5/2) and 35.8 eV (W 4f7/2). There is a 0.3 eV binding energy shift for W 4f5/2 and W 4f7/2 of W6+, which could be attributed to the fact that the presence of W5+ in n‐W18O49 and r‐W18O49 has an influence on the chemical environment of W6+. Figures 3 d–f show XPS spectra of O 1s. The percentages of absorbed oxygen for the binding energy peak at 532.0 eV23 are 30.8, 27.0, and 18.8 % for o‐W18O49, n‐W18O49 and r‐W18O49, respectively. We performed electron paramagnetic resonance (EPR) to investigate the oxygen defects in W18O49. Both r‐W18O49 and n‐W18O49 have an obvious signal at B=3370 mT, owing to the presence of single‐electron oxygen active sites, as shown in Figure 4.14 Whereas, o‐W18O49 has no signal throughout the whole magnetic field. A stronger signal of r‐W18O49 compared with that of n‐W18O49 at B=3370 mT indicates that r‐W18O49 possesses more oxygen defects than n‐W18O49.
Figure 3.
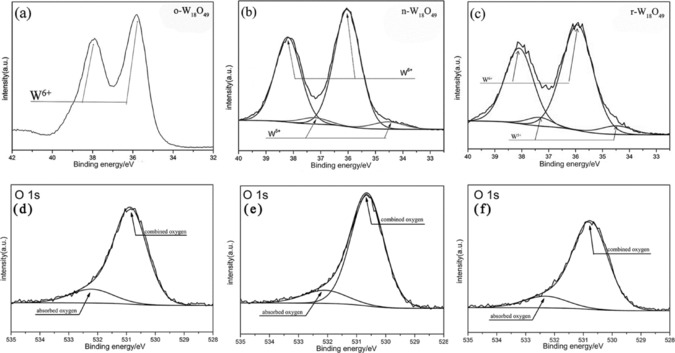
a–c) XPS spectra of the W 4f orbital in o‐W18O49, n‐W18O49, and r‐W18O49, respectively. d–f) XPS spectra of O 1s in o‐W18O49, n‐W18O49, and r‐W18O49, respectively.
Figure 4.
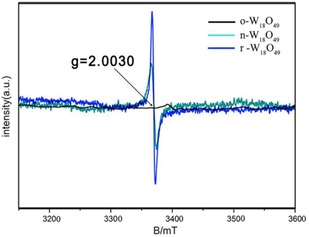
Room‐temperature EPR spectra of o‐W18O49, n‐W18O49, and r‐W18O49, respectively.
Figure 5 shows the reflection spectra of o‐W18O49, n‐W18O49, and r‐W18O49 for the wavelength range of 200–2400 nm. The r‐W18O49 sample shows strong light absorption, as compared with n‐W18O49 throughout the whole NIR range. The W18O49 samples exhibit longitudinal surface plasmon resonance, which corresponds to electron oscillations parallel to the nanowire's growth direction.16 Whereas, o‐W18O49 has no response over the whole NIR and visible light range, owing to its low free carriers, that is, oxygen vacancies, and there is no LSPR effect.
Figure 5.
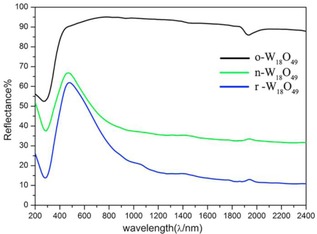
UV/Vis–NIR reflection spectra of o‐W18O49, n‐W18O49, and r‐W18O49, respectively.
As shown in Figure 6 a, after being irradiated by a 808 nm laser at a power density of 1 W cm−2 for 10 s, the powders of o‐W18O49, n‐ W18O49, and r‐W18O49 exhibit a temperature increase from room temperature to 74, 103, and 145 °C, respectively. To further investigate the photothermal conversion efficiency, we adopted the reported method to evaluate the photothermal conversion efficiency.24 Figure 7 a shows the temperature increases of o‐W18O49, n‐W18O49, r‐W18O49, and deionized water (as the control) after irradiation by a 808 nm laser at a power density of 3.5 W cm−2 for 15 mins; the dispersion of r‐W18O49 shows a temperature increase of 51.5 °C, whereas n‐W18O49, o‐W18O49, and deionized water have temperature increases of 24.6, 12.0, and 5.1 °C, respectively. The thermography (as shown in Figure 6 b) reveals that r‐W18O49 possesses the best photothermal conversion performance. According to Roper's report,25 the photothermal conversion efficiency was calculated by using Equation (1):24
| (1) |
Figure 6.
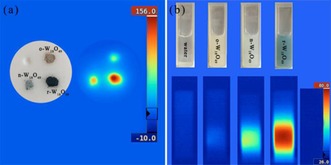
a) Thermography of solid samples after irradiation by a 808 nm laser at a power density of 1 W cm−2 for 10 s. b) Images and thermography of deionized water, o‐W18O49, n‐W18O49, and r‐W18O49 after irradiation by a 808 nm laser at a density of 3.5 W cm−2 for 15 mins.
Figure 7.
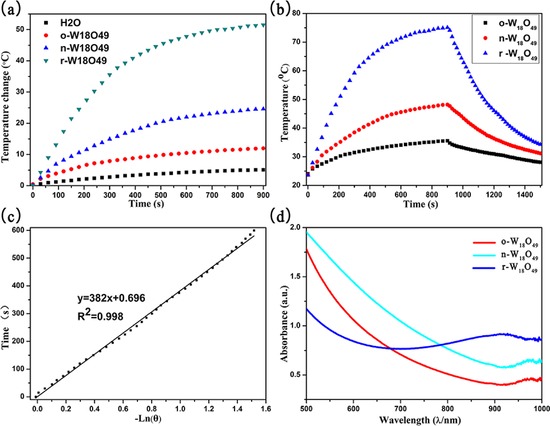
a) Temperature increases of deionized water and the aqueous dispersions of o‐W18O49, n‐W18O49, and r‐W18O49. b) The photothermal effect of o‐W18O49, n‐W18O49, and r‐W18O49. The dispersions were irradiated by using a 808 nm laser at a power density of 3.5 W cm−2 for 900 s and cooled to room temperature in an ambient environment. c) The time constant for heat transfer from the system is calculated to be 382 s. d) The UV/Vis spectra of o‐W18O49, n‐W18O49, and r‐W18O49 dispersions.
where h is the heat transfer coefficient, S is the surface area of the container, T max is the maximum temperature of the dispersion after irradiated by the laser, and T surr is the surrounding temperature, thus (T max−T surr) is regarded as the temperature increase of the dispersion after irradiation by the laser. Q 0 is the heat input from light absorption by the control system (deionized water and quartz cell only), and its value was calculated to be 0.077 W. P is the laser power and A 808 is the absorbance of the dispersions at 808 nm. The value of hS is calculated by using Equation (2):24
| (2) |
where τ s is the time constant for heat transfer from the system, which is determined to be 382 s (for r‐W18O49), as shown in Figure 7 c, and the time constant is 522 and 721 s for n‐W18O49 and o‐W18O49, which is shown in the Supporting Information. m i is 2 and 5.827 g, whereas C p,i is 4.2 and 0.892 J g−1 K−1 for water and the quartz cell, respectively. Thus, the values of hS are calculated to be 0.036, 0.026, and 0.019 J K−1 s−1 for r‐W18O49, n‐W18O49, and o‐W18O49, respectively.
The photothermal stability of r‐W18O49 is evaluated by repeated laser irradiation for five cycles. Figure 8 shows that the final temperature elevation could be achieved in the same way as that of the first cycle. There is only a slight decrease of absorbance from 0.828 to 0.789 over five heating and cooling cycles after irradiated by a 808 nm laser at a density of 3.5 W cm−2.
Figure 8.
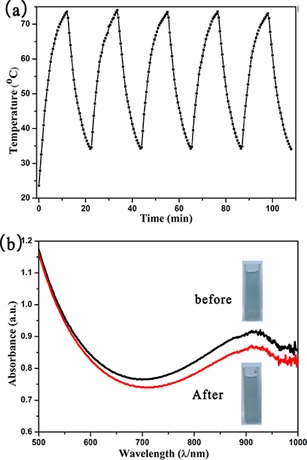
a) The dispersion of r‐W18O49 at 0.3 mg mL−1 was irradiated by using a 808 nm laser at a density of 3.5 W cm−2 for five heating and cooling cycles. b) UV/Vis spectra of r‐W18O49 before (black line) and after (red line) five laser irradiation cycles (808 nm, 3.5 W cm−2).
3. Conclusions
W18O49 nanocrystals of the same crystal structure with different amounts of W5+ and oxygen vacancies were prepared by addition of NaNO3 or NaBH4 as a redox agent in the solvothermal system. The oxidation state of W and oxygen vacancy in W18O49 have a significant influence on the NIR light absorption and photothermal conversion efficiency. The r‐W18O49 with more W5+ exhibits strong NIR light absorption, significant photothermal conversion efficiency of 59.6 % at 808 nm, and has good photothermal stability.
Experimental Section
Preparation of W18O49 with Tunable Oxidation State
W18O49 was prepared by using a solvothermal reaction, as described in Refs. 14, 17. In a typical procedure, WCl6 (200 mg) was dissolved in 1‐butanol (30 mL) with sonication for 3 min. The obtained blue solution was transferred into a 50 mL Teflon‐lined autoclave and kept at 200 °C for 24 h, and then cooled to room temperature naturally. The product was washed with water and ethanol four times by using centrifugation. The product was then dried in a vacuum oven over night. W18O49 samples with tunable oxidation states were prepared by addition of NaNO3 or NaBH4 as the redox agent in a solvothermal system.
Photothermal Conversion Experiment
W18O49 (3 mg) was dispersed in deionized water (10 mL) by ultrasonic treatment. Then, dispersed W18O49 was measured by using a light absorption spectrometer to obtain the absorption spectra. The dispersed W18O49 (2 mL) was sealed in a quartz cell and irradiated by using a 808 nm laser at a power density of 3.5 W cm−2 to observe the temperature increase in every 30 s. When the system reached a stable temperature (temperature change less than 0.2 °C min−1), the laser was turned off. The temperature was recorded in every 15 s during the cooling process. The laser power was turned on when the temperature cooled to room temperature. The above laser irradiation process was repeated for five cycles to evaluate the photothermal stability of r‐W18O49.
Characterization
The XRD patterns were recorded by using PANalytical B.V. Empyrean X‐ray powder diffraction with Cu Kα radiation over a range of 10–70° (2θ) with 0.02° per step. SEM images were obtained with a JSM‐6700F electron microscope. TEM images were obtained with a Tecnai G2 FEI Company electron microscope. XPS (Thermo ESCALAB 250) was performed by using monochromatic Al Kα radiation (1486.6 eV). The EPR spectra were obtained on a JES‐FA 200 EPR spectrometer with a micro‐frequency of 9.45 GHz. UV/Vis solid reflectance spectra were obtained by using a UV/Vis solid spectrometer (PerkinElmer Lambda 950).
Conflict of interest
The authors declare no conflict of interest.
Supporting information
As a service to our authors and readers, this journal provides supporting information supplied by the authors. Such materials are peer reviewed and may be re‐organized for online delivery, but are not copy‐edited or typeset. Technical support issues arising from supporting information (other than missing files) should be addressed to the authors.
Supplementary
Acknowledgements
This work was supported by the National Natural Science Foundation of China (No. 21371066).
Z. Fang, S. Jiao, Y. Kang, G. Pang, S. Feng, ChemistryOpen 2017, 6, 261.
References
- 1. Li B., Wang Q., Zou R., Hu J., Nanoscale 2014, 6, 3274–3282. [DOI] [PubMed] [Google Scholar]
- 2. Lal S., Link S., Halas N. J., Nat. Photonics 2007, 1, 641–648. [Google Scholar]
- 3. Skrabalak S. E., Chen J., Xia Y., Acc. Chem. Res. 2008, 41, 1587–1595. [DOI] [PMC free article] [PubMed] [Google Scholar]
- 4. Pietrobon B., Kitaev V., Chem. Mater. 2008, 20, 5186–5190. [Google Scholar]
- 5. Zhang J., Li S., Schatz G. C., Mirkin C. A., Angew. Chem. 2009, 121, 7927–7931. [Google Scholar]
- 6. Jin R., Cao Y. C., Schatz G. C., Mirkin C. A., Nature 2003, 425, 487–490. [DOI] [PubMed] [Google Scholar]
- 7. Zhang Q., Li W., Xia Y., J. Am. Chem. Soc. 2010, 132, 11372–11378. [DOI] [PMC free article] [PubMed] [Google Scholar]
- 8. Kanehara M., Koike H., Yoshinaga T., Teranishi T., J. Am. Chem. Soc. 2009, 131, 17736–17737. [DOI] [PubMed] [Google Scholar]
- 9. Buonsanti R., Llordes A., Milliron D. J., Nano Lett. 2011, 11, 4706–4710. [DOI] [PubMed] [Google Scholar]
- 10. Gordon T. R., Paik T., Klein D. R., Murray C. B., Nano Lett. 2013, 13, 2857–2863. [DOI] [PubMed] [Google Scholar]
- 11. De Trizio L., Buonsanti R., Schimpf A. M., Llordes A., Gamelin D. R., Simonutti R., Milliron D. J., Chem. Mater. 2013, 25, 3383–3390. [Google Scholar]
- 12. Mattox T. M., Ye X., Manthiram K., Schuck P. J., Alivisatos A. P., Urban J. J., Adv. Mater. 2015, 27, 5830. [DOI] [PubMed] [Google Scholar]
- 13. Manthiram K., Alivisatos A. P., J. Am. Chem. Soc. 2012, 134, 3995–3998. [DOI] [PubMed] [Google Scholar]
- 14. Wang D., Sun J., Cao X., Pang G., Feng S., J. Mater. Chem. A 2013, 1, 8653–8657. [Google Scholar]
- 15. Chang X., Sun S., Li Z., Xu X., Qiu Y., Appl. Surf. Sci. 2011, 257, 5726–5730. [Google Scholar]
- 16. Guo C., Yin S., Yan M., Kobayashi M., Kakihana M., Tsugio S., Inorg. Chem. 2012, 51, 4763–4771. [DOI] [PubMed] [Google Scholar]
- 17. Wang D., Li J., Cao X., Pang G., Feng S., Chem. Commun. 2010, 46, 7718–7720. [DOI] [PubMed] [Google Scholar]
- 18. Liu J., Margeat O., Dachraoui W., Liu X., Fahlman M., Ackermann J., Adv. Funct. Mater. 2014, 24, 6029–6037. [Google Scholar]
- 19. Huang Z. F., Song J., Pan L., Lv F., Wang Q., Zou J. J., Zhang X., Wang L., Chem. Commun. 2014, 50, 10959–10962. [DOI] [PubMed] [Google Scholar]
- 20. Xu W., Tian Q., Chen Z., Zhu M., J. Mater. Chem. B 2014, 2, 5594–5601. [DOI] [PubMed] [Google Scholar]
- 21. Zhou H., Shi Y., Dong Q., Lin J., Wang A., M, Tingli , J. Phys. Chem. C 2014, 118, 20100–20106. [Google Scholar]
- 22. Cong S., Yuan Y., Chen Z., Hou J., Yang M., Nat. Commun. 2015, 6, 7800–7806. [DOI] [PMC free article] [PubMed] [Google Scholar]
- 23. Xing M., Zhang J., Chen F., Tian B., Chem. Commun. 2011, 47, 4947–4749. [DOI] [PubMed] [Google Scholar]
- 24. Lin M., Guo C., Li J., Zhou D., Zhang H., Wang L., Yang B., ACS Appl. Mater. Interfaces 2014, 6, 5860–5868. [DOI] [PubMed] [Google Scholar]
- 25. Roper D. K., Ahn W., Hoepfner M., J. Phys. Chem. C 2007, 111, 3636–3641. [DOI] [PMC free article] [PubMed] [Google Scholar]
Associated Data
This section collects any data citations, data availability statements, or supplementary materials included in this article.
Supplementary Materials
As a service to our authors and readers, this journal provides supporting information supplied by the authors. Such materials are peer reviewed and may be re‐organized for online delivery, but are not copy‐edited or typeset. Technical support issues arising from supporting information (other than missing files) should be addressed to the authors.
Supplementary


