

Abstract
Key points
Lysophosphatidic acid (LPA) is an itch mediator, but not a pain mediator by a cheek injection model.
Dorsal root ganglion neurons directly respond to LPA depending on transient receptor potential ankyrin 1 (TRPA1) and vanilloid 1 (TRPV1).
LPA‐induced itch‐related behaviours are decreased in TRPA1‐knockout (KO), TRPV1KO or TRPA1TRPV1 double KO mice.
TRPA1 and TRPV1 channels are activated by intracellular LPA, but not by extracellular LPA following LPA5 receptor activation with an activity of Ca2+‐independent phospholipase A2 and phospholipase D.
Intracellular LPA interaction sites of TRPA1 are KK672–673 and KR977–978 (K: lysine, R: arginine).
Abstract
Intractable and continuous itch sensations often accompany diseases such as atopic dermatitis, neurogenic lesions, uremia and cholestasis. Lysophosphatidic acid (LPA) is an itch mediator found in cholestatic itch patients and it induces acute itch and pain in experimental rodent models. However, the molecular mechanism by which LPA activates peripheral sensory neurons remains unknown. In this study, we used a cheek injection method in mice to reveal that LPA induced itch‐related behaviours but not pain‐related behaviours. The LPA‐induced itch behaviour and cellular effects were dependent on transient receptor potential ankyrin 1 (TRPA1) and vanilloid 1 (TRPV1), which are important for itch signal transduction. We also found that, among the six LPA receptors, the LPA5 receptor had the greatest involvement in itching. Furthermore, we demonstrated that phospholipase D (PLD) plays a critical role downstream of LPA5 and that LPA directly and intracellularly activates TRPA1 and TRPV1. These results suggest a unique mechanism by which cytoplasmic LPA produced de novo could activate TRPA1 and TRPV1. We conclude that LPA‐induced itch is mediated by LPA5, PLD, TRPA1 and TRPV1 signalling, and thus targeting TRPA1, TRPV1 or PLD could be effective for cholestatic itch interventions.
Keywords: itch, lysophosphatidic acid, TRP channels
Key points
Lysophosphatidic acid (LPA) is an itch mediator, but not a pain mediator by a cheek injection model.
Dorsal root ganglion neurons directly respond to LPA depending on transient receptor potential ankyrin 1 (TRPA1) and vanilloid 1 (TRPV1).
LPA‐induced itch‐related behaviours are decreased in TRPA1‐knockout (KO), TRPV1KO or TRPA1TRPV1 double KO mice.
TRPA1 and TRPV1 channels are activated by intracellular LPA, but not by extracellular LPA following LPA5 receptor activation with an activity of Ca2+‐independent phospholipase A2 and phospholipase D.
Intracellular LPA interaction sites of TRPA1 are KK672–673 and KR977–978 (K: lysine, R: arginine).
Abbreviations
- AITC
allyl isothiocyanate
- BEL
bromoenol lactone
- CPZ
capsazepine
- DAG
diacylglycerol
- DGPP
dioctanoylglycerol pyrophosphate
- DRG
dorsal root ganglion
- FIPI
5‐fluoro‐2‐indolyl des‐chlorohalopemide
- iPLA2
Ca2+‐independent phospholipase A2
- KO
knockout
- LPA
lysophosphatidic acid
- LPC
lysophosphatidylcholine
- LPI
lysophosphatidylinositol
- LPL
lysophospholipid
- PA
phosphatidic acid
- PC
phosphatidylcholine
- PI
phosphatidylinositol
- PC‐PLC
phosphatidylcholin‐specific phospholipase C
- PH
putative pleckstrin homology
- PI‐PLC
phosphatidylinositol‐specific phospholipase C
- PLD
phospholipase D
- PIP2
phosphatidylinositol 4,5‐bisphosphate
- TG
trigeminal ganglion
- TRPA1
transient receptor potential ankyrin 1
- TRPV1
transient receptor potential vanilloid 1
Introduction
The sensation of itch, formally called pruritus, is defined as ‘an unpleasant cutaneous sensation which provokes a desire to scratch’ (Rothman, 1941). Pruritus is caused by exogenous factors and is also accompanied by diseases such as atopic dermatitis, neurogenic lesions, uremia and cholestasis (Ikoma et al. 2006). Many itch‐inducing substances, called pruritogens, have been shown to activate receptors expressed in primary sensory neurons. These pruritogens are thought to trigger pruritogenic signals that are transmitted to the CNS to evoke an itch sensation (Ikoma et al. 2006; Akiyama & Carstens, 2013; Liu & Ji, 2013; Han & Dong, 2014; Zhang, 2015). Lysophosphatidic acid (LPA) is known to be a pruritogen, but the mechanism by which it affects primary sensory neurons to elicit itching remains unclear (Liu & Ji 2013; Han & Dong, 2014; Zhang, 2015).
LPA is a small, ubiquitous phospholipid that plays important roles in cell survival, apoptosis, motility, shape formation, differentiation and other processes (Choi et al. 2010; Tigyi, 2010; Kihara et al. 2014). LPA was identified as a pruritogen present in the sera of cholestatic patients with pruritus, and the activity of LPA‐producing enzymes correlated positively with itch intensity in these patients (Kremer et al. 2010). In rodent models, LPA is both a pruritogen that induces itch‐related behaviours (Hashimoto et al. 2004; Kremer et al. 2010; Alemi et al. 2013), and an algogen, a pain‐inducing molecule that causes acute pain‐related behaviours (Nieto‐Posadas et al. 2012). Thus, whether LPA acts as a pruritogen, an algogen or both to affect the peripheral nervous system is unclear.
Transient receptor potential ankyrin 1 (TRPA1) and vanilloid 1 (TRPV1) are key molecules in itch and pain signalling, and are members of the TRP channel superfamily that in mammals includes 28 members (Wu et al. 2010). Both TRPA1 and TRPV1 are non‐selective Ca2+‐permeable cation channels that are expressed in neurons of dorsal root ganglion (DRG), trigeminal ganglion (TG) and nodose ganglion (Caterina et al. 2000; Story et al. 2003) and transmit somatosensory signals. TRPA1 has been reported to cause pain (Bautista et al. 2006) as well as itch (Wilson et al. 2011, 2013; Morita et al. 2015); similarly, TRPV1 also induces both pain (Caterina et al. 2000) and itch sensations (Shim et al. 2007). Given that these channels play critically important roles in both pain and itch sensations, we hypothesized that TRPA1 and TRPV1 are involved in the action of LPA. Thus, in this study we aimed to clarify the physiological role of LPA and investigate the detailed mechanistic pathways involved in its action as well as the role of the TRPA1 and TRPV1 channels in this pathway.
Methods
Ethical approval
All procedures involving the care and use of animals were approved by the institutional Animal Care and Use Committee of the National Institute of Natural Sciences (no. 16A074) and carried out in accordance with the National Institutes of Health Guide for the care and use of laboratory animals (NIH publication No. 85‐23. Revised, 1985).
Animals
Male C57BL/6N mice (6–12 weeks old) were housed at one to six animals per cage in a controlled environment (12 h light/dark cycle; 22–25°C; 50–60% humidity) with food and water provided ad libitum. All experiments were performed during the light cycle. TRPA1‐knockout (KO) and TRPV1KO mice were kindly provided by Dr David Julius (University of California, San Francisco). TRPA1TRPV1DKO mice were obtained by crossbreeding TRPA1KO and TRPV1KO mice.
Chemicals
LPA (1‐oleoyl), dioctanoylglycerol pyrophosphate (DGPP), lysophosphatidylcholine (LPC; 1‐oleoyl) and phosphatidic acid (PA; 1,2‐dioleoyl) were obtained from Avanti Polar Lipids (Alabaster, AL, USA). Allyl isothiocyanate (AITC) and carvacrol were obtained from Wako Pure Chemical Industries (Osaka, Japan). Capsaicin, ionomycin, capsazepine and lysophosphatidylinositol (LPI; from soybeans) were obtained from Sigma‐Aldrich (St Louis, MO, USA). A‐967079 was obtained from StressMarq Bioscience (Victoria, BC, Canada). Fura‐2‐acetoxymethyl ester was obtained from Thermo Fisher Scientific (Waltham, MA, USA). H2L 5765834 and TC LPA5 4 were obtained from Tocris Bioscience (Ellisville, MO, USA). AM095 was obtained from Amira Pharmaceuticals (New York, NY, USA). Edelfosine, bromoenol lactone (BEL), 5‐fluoro‐2‐indolyl des‐chlorohalopemide (FIPI) and U‐73122 were obtained from Cayman Chemical (Ann Arbor, MI, USA). D609 was obtained from Santa Cruz Biotechnology (Dallas, TX, USA). Stock solutions were prepared in methanol/water (1:1, v/v) for LPA; in ethanol for AITC, capsaicin and DGPP; in methanol for capsazepine; and in dimethylsulfoxide (Wako) for all other compounds.
Behavioural test
A cheek injection model (Shimada & LaMotte, 2008) was used in this study without any anaesthesia. After a 30 min habituation, 10 μl of saline‐based vehicle or LPA (8.94, 100 or 300 nmol prepared from the commercially supplied powder) was intradermally injected into the right cheek of the mice with a 30‐gauge needle (Becton Dickinson and Company, Franklin Lakes, NJ, USA) connected to a glass syringe (Hamilton Company, Reno, NV, USA) by PE‐10 polyethylene tubing (Becton Dickinson and Company). Behaviours were then recorded for 30 min with a digital camera (EX‐ZR100 and EX‐ZR400, CASIO, Tokyo, Japan). Inhibitors were co‐injected at a concentration of 200 nmol per 10 μl. Scratching and wiping behaviours directed toward the injection site were counted. A set of scratching bouts was defined as a serial movement wherein the mouse lifts its hindpaw for scratching and subsequently returns the hindpaw to the floor. Wiping behaviour was defined as only unilateral behaviour with the forelimb.
Cultures of isolated TG and DRG neurons
The TG and DRG were rapidly dissected from adult C57BL/6NCr mice upon anaesthesia with intramuscular injection of ketamine (100 mg kg−1) and intraperitoneal injection of xylazine (10 mg kg−1), and then dissociated by incubation for 20–30 min at 37°C in Earle's balanced salt solution (EBSS; Sigma) containing 10% fetal bovine serum (FBS; Biowest, Nuaille, France), 2 mm l‐glutamine (GlutaMAX; Thermo Fisher Scientific), vitamin mixture (C6895; Sigma), 50 units ml−1 penicillin/50 μg ml−1 streptomycin (Thermo Fisher Scientific) and 2.5 mg ml−1 collagenase (C7657; Sigma). After changing the solutions by centrifugation (room temperature, 1000 r.p.m., 4 min), the TG and DRG were gently triturated with a fire‐polished Pasteur pipette and filtered through 70 μm nylon mesh (Becton Dickinson and Company). The solution was changed to Dulbecco's modified Eagle's medium (DMEM; Wako) containing 10% FBS, 50 units ml−1 penicillin/50 μg ml−1 streptomycin and 2 mm l‐glutamine. TG and DRG neurons were re‐suspended in DMEM, inoculated in a drop on 12 mm coverslips (Matsunami Glass Ind., Osaka, Japan) pre‐coated with poly‐d‐lysine (100 μg ml−1, C6407; Sigma), and incubated for 30 min at 37°C in 5% CO2 followed by medium addition. Cultured DRG neurons were used for Ca2+ imaging experiments 14–24 h after dissection.
Ca2+ imaging
For Ca2+ imaging experiments, DRG and TG neurons were incubated for 30 min in medium containing 5 μm of the fluorescent indicator Fura‐2. Fura‐2 fluorescence was measured under conditions where a coverslip was set in a recording chamber that was then perfused with a standard bath solution containing 140 mm NaCl, 5 mm KCl, 2 mm MgCl2, 2 mm CaCl2, 10 mm Hepes and 10 mm d‐glucose at pH 7.4 adjusted with NaOH. A Ca2+‐free bath solution was prepared by omitting 2 mm CaCl2 from the standard bath solution and adding 5 mm EGTA. Ionomycin (5 μm) was applied to confirm cell viability and for response normalization with the equation described below. Antagonists/inhibitors were applied 90 s before LPA application and for 90 s with 5 μm LPA in experiments using those compounds. Fura‐2 fluorescence was excited at 340 and 380 nm and emission was monitored at 510 nm with a digital CCD camera (ORCA‐HR C4742‐95‐12HR; Hamamatsu Photonics, Hamamatsu, Japan). Data were obtained every 5 s and analysed using ImageJ software (National Institutes of Health, Bethesda, MD, USA). The 340/380 ratio value (described as F) was calculated using regions of interest that included the whole cell body. The change in the 340/380 ratio value (ΔF Norm) was normalized using the following formula:
where F Initial is the averaged F for the first 25 s of each cell in the experiments, and F Ionomycin is the maximum F value of ionomycin application for 100 s. In this study, each response to an application with ΔF Norm ≥ 0.1 was regarded as positive. Cells not responding to KCl (100 mm) application were regarded as non‐neuronal cells. Dose‐dependency of the Ca2+ imaging data (acquired with IP Lab software) was fitted with the equation y = (A 1−A 2)/[1 + (x/x o)p] + A 2 (ORIGIN 8.1 software, Originlab Corporation; Wellesley Hills, MA, USA), and analysed with ImageJ.
RNA extraction and reverse transcription PCR
Total RNA was extracted from freshly isolated mouse DRG neurons that were isolated as described above. DRGs were collected into a 1.5 ml tube (Nippi Incorporated, Tokyo, Japan) and homogenized in Sepasol‐RNA I Super G (Nacalai Tesque, Kyoto, Japan). RNA extraction was performed by incubation at room temperature for 5 min, addition of 200 μl chloroform (Wako) with mixing, incubation at room temperature for 3 min and centrifugation at 12 000 g and 4°C for 15 min. Then, 500 μl 2‐propanol (Nacalai Tesque) was added to the supernatant, which was incubated at room temperature for 10 min and centrifuged at 12 000 g and 4°C for 10 min. The resulting precipitate was resuspended in 1 ml 75% (v/v) ethanol (Wako), centrifuged at 12 000 g and 4°C for 5 min, and the supernatant was removed.
Extracted RNA was treated with DNase I following the manufacturer's protocol. The solution was mixed with an equivalent amount of phenol/chloroform/isoamyl alcohol (25:24:1, PCI) (Nacalai Tesque). RNA was purified through centrifugation at 12 000 g and room temperature for 10 min, mixing the supernatant with an equivalent amount of PCI, and centrifuging at 12 000 g and room temperature for 10 min. Then, 3 m sodium acetate (pH 5.2, Nacalai Tesque) and 100% ethanol (Wako), at one‐tenth and 2.5 times, respectively, of the total supernatant volume was added to the supernatant followed by mixing and incubation at −20°C for 20 min followed by centrifugation at 12 000 g and 4°C for 10 min. Ethanol (70%, 1 ml; Wako) was added before the suspension was centrifuged at 12 000 g and 4°C for 5 min, and the supernatant was then removed.
Reverse transcription was performed using 1 μg extracted RNA and SuperScript III Reverse Transcriptase (Thermo Fisher Scientific) following the manufacturer's protocol. PCR was performed on a reaction mixture including cDNA, each primer set (Table 1) and recombinant Taq DNA Polymerase (R001A; Takara Bio Inc., Shiga, Japan) following the manufacturer's protocol. After incubation at 95°C for 5 min, 35–40 cycles of PCR were performed with 95°C for 45 s, 60°C for 30 s and 72°C for 10 s, followed by incubation at 72°C for 10 min. The PCR products were electrophoresed on a 1.5% agarose (Thermo Fisher Scientific) gel with 0.5 μg ml−1 ethidium bromide (Thermo Fisher Scientific) at 100 V for 30–40 min and visualized with a transilluminator (ATTO, Tokyo, Japan).
Table 1.
Primer sets for mouse LPA receptors and phospholipases
| Genes | Sense primer (5′→3′) | Antisense primer (5′→3′) |
|---|---|---|
| mLpar1 | TCTTCTGGGCCATTTTCAAC | TGCCTGAAGGTGGCGCTCAT |
| mLpar3 | ACACCAGTGGCTCCATCAG | GTTCATGACGGAGTTGAGCAG |
| mLpar5 | AGGAAGAGCAACCGATCACAG | ACCACCATATGCAAACGATGTG |
| mPla2g6 | GCTACAGCTCCTAGGGAAGAA | CGAGGATCCTTGCTGTGGAT |
| mPlcb3 | CGAGGATCCTTGCTGTGGAT | GACTATGCGGAGGCCTTGAT |
| mPld1 | GACTATGCGGAGGCCTTGAT | TGTAGGGGTCACCTCAGAGA |
| mPld2 | TGTAGGGGTCACCTCAGAGA | AAGTGCAGTTGCTCCGATCT |
| mActb | TGTTACCAACTGGGACGACA | AAGGAAGGCTGGAAAAGAGC |
RNA interference (RNAi) for mLpa5
RNAi was performed by transfection of mixed small interference RNAs (siRNAs) specific for mLpa5 (Thermo Fisher Scientific) with a total amount of 1000 pmol siRNA for one DRG neuron culture coverslip. The sequences used were CCCUCAGAAAGCACCCAAAtt, CCACUGGUUUACUACUUCAtt and CCCUCAGAAAGCACCCAAAtt. For negative control siRNA, Silencer Negative Control No. 1 siRNA (Thermo Fisher Scientific) was transfected. Transfection was performed with Lipofectamine 3000 Transfection Reagent (Thermo Fisher Scientific) following the manufacturer's protocol.
Transient transfection of HEK293T cells
HEK293T cells were maintained at 37°C in 5% CO2 in the supplemented DMEM described above. Transient transfection of HEK293T cells was achieved with Lipofectamine Transfection Reagent (Thermo Fisher Scientific), PLUS Reagent (Thermo Fisher Scientific) and Opti‐MEM I Reduced Serum Medium (Thermo Fisher Scientific) following the manufacturer's protocol. Plasmid DNAs for TRPA1 (pcDNA5‐FRT) and TRPV1 (pcDNA3.1) were transfected with pGreen Lantern 1 into HEK293T cells and transfected cells were used for patch clamp experiments 14–48 h after transfection. For mlpa5 RNAi experiments, the mLpa5/pEGFP‐N2 vector was transfected.
Electrophysiology
HEK293T cells expressing mTRPA1 or mutant mTRPA1 were used for whole‐cell and single‐channel recordings with standard patch pipettes (3–5 MΩ resistance) made with borosilicate glass capillaries (King Precision Glass, Claremont, CA, USA). The extracellular solution for whole‐cell recording was the standard bath solution mentioned above. The extracellular solution for single‐channel recording and the intracellular solutions for both configurations contained 140 mm KCl, 5 mm EGTA and 10 mm HEPES at pH 7.4, adjusted with KOH. The whole‐cell voltage‐clamp recordings were performed with the membrane potential clamped at −60 mV. Inside‐out membrane patches were used for single‐channel recordings where the membrane potential was clamped at +30 mV. Before membrane excision, cells were perfused with the standard bath solution that was then exchanged for the KCl‐based solution. Data were sampled at 10 kHz and filtered at 5 kHz for whole‐cell recording and at 2 kHz for single‐channel recording (Axopatch 200B Amplifier; Molecular Devices, Sunnyvale, CA, USA). Data were analysed using pCLAMP 10.2 Software (Molecular Devices).
Construction of mutant mouse TRPA1
mTRPA1 (NM_177781) cDNA in the pcDNA5/FRT expression vector was used. Vectors containing mTRPA1 mutants were constructed by PCR with synthesized oligonucleotide primer sets containing specific nucleotide sequences that produced amino acid substitutions (Table 2). The entire sequence of each mTRPA1 including the desired substitutions was confirmed by DNA sequencing.
Table 2.
Primer sets for mouse TRPA1 lysine/arginine mutations
| mTRPA1 mutant | Sense primer (5′→3′) | Antisense primer (5′→3′) |
|---|---|---|
| K592Q | GCCCTGCACAATcAGCGCAAGGAAGTG | CACTTCCTTGCGCTgATTGTGCAGGGC |
| R593Q | CTGCACAATAAGCaaAAGGAAGTGGTT | AACCACTTCCTTttGCTTATTGTGCAG |
| K594Q | CACAATAAGCGCcAGGAAGTGGTTCTC | GAGAACCACTTCCTgGCGCTTATTGTG |
| R602Q | CTCACAACCATCcaAAATAAAAGATGG | CCATCTTTTATTTtgGATGGTTGTGAG |
| R604Q | ACCATCAGAAATcAAAGATGGGATGAG | CTCATCCCATCTTTgATTTCTGATGGT |
| R605Q | ATCAGAAATAAAcaATGGGATGAGTGT | ATCAGAAATAAAcaATGGGATGAGTGT |
| KK672‐673QQ | TCCATGACCcAAcAAGTAGCACCTACC | GTGCTACTTgTTgGGTCATGGATAATGG |
| KR799‐800QQ | TCCAACAGcAAcaGAATTACTTCCTG | AATTCtgTTgCTGTTGGAAAATTTGG |
| K972Q | GAGGTCCAGcAGCAT GCGTCAT | ATGACGCATGCTgCTGGACCTC |
| KR977‐978QQ | CATGCGTCATTGcAGcaGATTGCTATGC | GCATAGCAATCtgCTgCAATGACGCATG |
| KK991‐992QQ | CAACTTAGAAcAAcAGCTGCCACTC | GAGTGGCAGCTgTTgTTCTAAGTTG |
| RK999‐1000QQ | CTGGTACTTACagcAAGTGGATCAG | CTGATCCACTTgctGTAAGTACCAG |
| R1004Q | GTGGATCAGcaGTCCACCATCG | CGATGGTGGACtgCTGATCCAC |
| R1012Q | GTATCCAAATcaACCCAGGCACG | CGTGCCTGGGTtgATTTGGATAC |
| R1014Q | CAAATAGACCCcaGCACGGCAGG | CCTGCCGTGCtgGGGTCTATTTG |
| R1017Q | CCAGGCACGGCcaGATGCTACGG | CCGTAGCATCtgGCCGTGCCTGG |
| R1020Q | CAGGATGCTAcaGTTTTTTCATTAC | GTAATGAAAAAACtgTAGCATCCTG |
| R1092Q | TCTTTCCAAGACcaGTTCAAGAAGGAG | CTCCTTCTTGAACtgGTCTTGGAAAGA |
| R1094Q | CAAGACAGGTTCcAaAAGGAGAGGC TG | CAGCCTCTCCTTtTgGAACCTGTCTTG |
| R1095Q | GACAGGTTCAAGcAaGAGAGGC TGGAA | TTCCAGCCTCTCtTgCTTGAACCTGTC |
| R1097Q | TTCAAGAAGGAGcaGCTGGAACAGATG | CATCTGTTCCAGCtgCTCCTTCTTGAA |
Statistics
Data are expressed as means ± SEM. No data points were excluded. All statistical analyses were conducted on at least three different experiments. Statistical analyses were performed with the two‐tailed Welch's t test to compare two groups and with one‐way ANOVA tests followed by two‐tailed Dunnett's tests for multiple comparisons, unless mentioned specifically in the figures. P < 0.05 was considered to be significant.
Results
LPA‐induced behaviours in a mouse cheek injection model
In mice, LPA has been reported to induce scratching behaviours (Hashimoto et al. 2004; Kremer et al. 2010; Alemi et al. 2013) and pain‐related responses (Nieto‐Posadas et al. 2012), leading to ambiguity about its physiological effects. Itch‐ and pain‐related behaviours are clearly segregated as scratching and wiping behaviours that occur in response to pruritogens and algogens, respectively (Akiyama et al. 2010 a). We used a cheek injection model (Shimada & LaMotte, 2008) to clarify a physiological role for LPA in mice. LPA (100 nmol per site) was intradermally injected into the right cheeks of wild type (WT) mice, and subsequent scratching and wiping behaviours were counted. The LPA‐induced scratching behaviours peaked at 20 min following injection (Fig. 1 A), but no significant wiping behaviours were observed (Fig. 1 B). Compared with vehicle treatment, the scratching behaviour continued during the first 30 min after injection of LPA (Fig. 1 C), but no wiping behaviours were seen (Fig. 1 D). Thus, in mice LPA acts as a pruritogen, but not an algogen. Because LPA‐induced acute pain‐related behaviours were previously reported (Nieto‐Posadas et al. 2012), we performed the cheek injection assay at the same LPA dose (8.94 nmol) and no wiping behaviours were observed (Fig. 1 E). A three times higher dose of LPA (300 nmol per site) also failed to induce wiping behaviours, but did induce scratching behaviours (Fig. 1 F), again confirming that LPA works as a pruritogen without effects as an algogen.
Figure 1. LPA induces scratching but not wiping behaviours in mice in a cheek injection model.
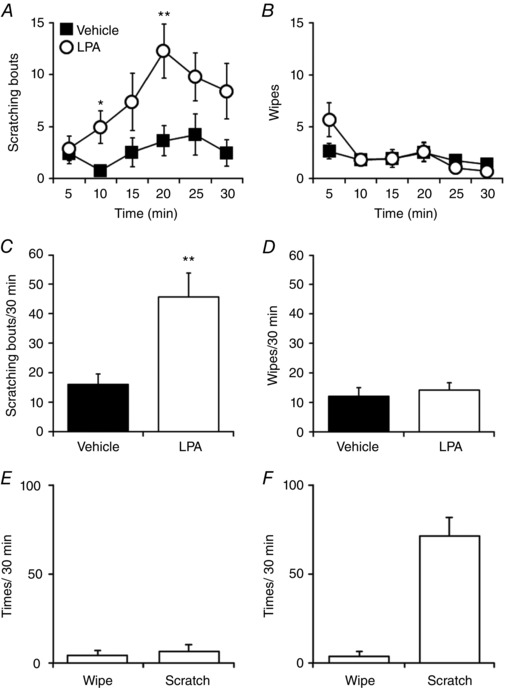
A and B, scratching (A) and wiping (B) behaviours induced by injection of vehicle (saline) or LPA (100 nmol/10 μl per site) into the right cheeks of WT mice were assessed every 5 min for 30 min. Filled squares and open circles indicate vehicle‐ and LPA‐treated groups, respectively. C and D, quantitative analysis of the scratching (C) and wiping (D) behaviours for 30 min in A and B; n = 17 for vehicle and n = 20 for LPA. E and F, quantitative analysis of the wiping and scratching behaviours for 30 min induced by LPA (E: 8.94 nmol, n = 6; F: 300 nmol, n = 5). * P < 0.05, ** P < 0.01 by Welch's t test. Data are shown as mean ± SEM.
LPA‐induced Ca2+ influx through TRPA1 and TRPV1 channels in mouse DRG neurons
To examine whether LPA directly affects mouse TG and DRG neurons, Ca2+ imaging experiments were performed using primary cultured TG and DRG neurons. Application of LPA (5 μm) transiently caused similar increases in intracellular Ca2+ concentrations ([Ca2+]i) in both DRG and TG neurons (Fig. 2 A and E). Therefore, we decided to use DRG neurons in the following experiments because it was easier to obtain a large number of cells from the DRG, which could make the data more convincing. LPA‐responding neurons were found in 40.0 ± 3.5% (n = 394/1030) of the examined DRG neurons, which were classified as LPA‐responding (LPA+) (Fig. 2 A, D and F). This LPA effect was dose‐dependent, and the EC50 value for the intensity of LPA+ neurons was 1.1 ± 0.3 μm (Fig. 2 B). Therefore, we used 5 μm LPA in all the subsequent in vitro experiments. The LPA‐induced increase in [Ca2+]i was not observed in the absence of extracellular Ca2+ (Figs 2 C and 3 A), indicating that the LPA‐induced [Ca2+]i increase was caused by Ca2+ influx from the extracellular space. Previous studies suggested that Ca2+‐permeable ion channels, such as TRPA1 and TRPV1, that are expressed in the plasma membrane of DRG neurons are involved in itch signalling in primary sensory neurons (Caterina et al. 2000; Story et al. 2003; Bautista et al. 2006; Shim et al. 2007; Wu et al. 2010; Wilson et al. 2011, 2013; Morita et al. 2015). To examine the functional expression of these channels in LPA+ DRG neurons, AITC (100 μm) and capsaicin (Cap, 1 μm), which are selective agonists of TRPA1 and TRPV1, respectively, were applied after LPA treatment (Fig. 2 D).
Figure 2. LPA activates mouse DRG neurons and both TRPA1 and TRPV1 are functionally expressed in LPA‐responsive neurons.
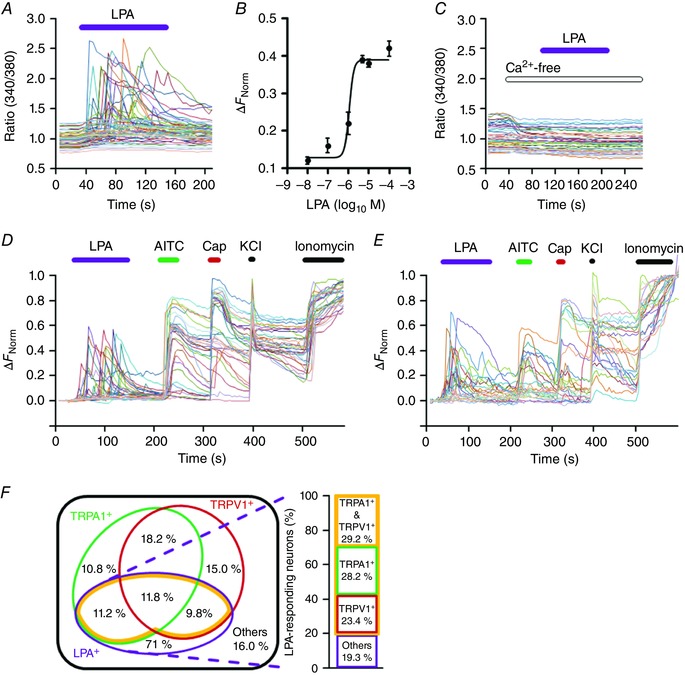
A, representative Fura‐2 traces of LPA (5 μm)‐induced [Ca2+]i changes in mouse DRG neurons. B, LPA dose‐dependent curves for response intensity of LPA‐responding (LPA+) neurons (n = 5–13). C, representative traces of [Ca2+]i changes following LPA application (5 μm) in the absence of extracellular Ca2+. D and E, representative traces of [Ca2+]i changes of DRG neurons (D) and TG neurons (E) in response to AITC (100 μm), capsaicin (Cap, 1 μm), KCl (100 mm) and ionomycin (5 μm) following LPA (5 μm) application. F, Venn diagram of classified DRG neurons (left) and the extracted LPA+ population (right). Numbers indicate mean percentage values of DRG neuron subpopulations. Of 1030 DRG neurons, 394 were LPA+. Areas shown by orange lines indicate the subpopulations responding to LPA, AITC and/or Cap (LPA+ with TRPA1+ and/or TRPV1+).
Figure 3. TRPA1 and TRPV1 are required for the LPA‐induced increase in [Ca2+]i and scratching behaviours.
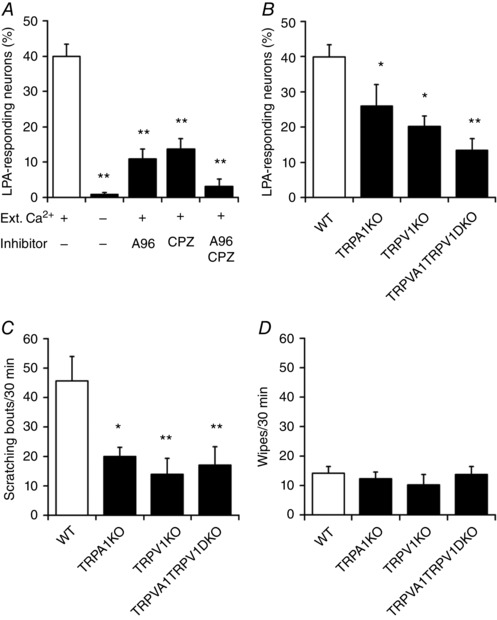
A, LPA+ neurons during application of LPA (5 μm) in the presence of extracellular Ca2+ [Ext. Ca2+ (+)], LPA in the absence of Ext. Ca2+, LPA + A‐967079 (A96, 1 μm) with Ext. Ca2+ (+), LPA + capsazepine (CPZ, 10 μm) with Ext. Ca2+ (+) and LPA + A96 + CPZ with Ext. Ca2+ (+); n = 4–13. Cells ≥ 300. ** P < 0.01 vs. LPA by Dunnett's multiple comparison test. Data are shown as means ± SEM. B, percentages of LPA (5 μm)‐responding DRG neurons in WT, TRPA1KO, TRPV1KO and TRPA1TRPV1 double KO (TRPA1TRPV1DKO) mice; n = 3–13. Cells ≥ 400. * P < 0.05, ** P < 0.01 vs. WT by one‐tailed Dunnett's multiple comparison test. C and D, scratching (C) and wiping (D) behaviours for 30 min after cheek injection of LPA (100 nmol/10 μl per site) in WT, TRPA1KO, TRPV1KO and TRPA1TRPV1DKO mice; n = 12–20. * P < 0.05, ** P < 0.01 vs. WT by Dunnett's multiple comparison test. Data are shown as mean ± SEM.
Based on the responsiveness to LPA, AITC and Cap, DRG neurons were classified into eight subpopulations composed of four groups: LPA+, AITC‐responding (TRPA1+), capsaicin‐responding (TRPV1+) and others (Fig. 2 F). LPA+, TRPA1+ and TRPV1+ neuronal subpopulations overlapped wherein most LPA+ neurons (82.2 ± 2.8%, n = 318/394, Fig. 2 F, right) functionally expressed TRPA1 and/or TRPV1, suggesting that TRPA1 and/or TRPV1 contribute to LPA responsiveness in DRG neurons.
To further examine whether activation of TRPA1 and/or TRPV1 was involved in the Ca2+ influx induced by LPA, the TRPA1 antagonist A‐967079 (A96, 1 μm) and TRPV1 antagonist capsazepine (CPZ, 10 μm) were applied to the neurons prior to LPA addition. Individually, both antagonists decreased the number of LPA+ neurons, and co‐application of the two antagonists almost completely abolished LPA+ neurons (Fig. 3 A). To further clarify the contribution of TRPA1 and/or TRPV1 to LPA responsiveness, DRG neurons from mice lacking TRPA1 (TRPA1KO), TRPV1 (TRPV1KO) or both channels (TRPA1TRPV1DKO) were assessed. The number of LPA+ neurons significantly decreased in TRPA1KO, TRPV1KO and TRPA1TRPV1DKO DRG neurons (26.0 ± 6.0%, n = 144/579; 20.3 ± 2.8%, n = 93/443; and 13.5 ± 3.2%, n = 65/455, respectively) (Fig. 3 B). Taken together, these results suggested that the LPA‐induced [Ca2+]i increase in DRG neurons is evoked mainly through activation of TRPA1 and/or TRPV1.
Involvement of TRPA1 and TRPV1 in LPA‐induced scratching
To examine the contribution of TRPA1 and/or TRPV1 to LPA‐induced scratching behaviours, LPA was injected into the cheeks of WT, TRPA1KO, TRPV1KO and TRPA1TRPV1DKO mice. Scratching behaviours were reduced in each mouse type (Fig. 3 C) to levels that were similar to that seen for the vehicle‐treated group (Fig. 1 C). No changes in wiping behaviours were observed in these strains (Fig. 3 D), indicating that both TRPA1 and TRPV1 are involved in LPA‐induced scratching but not wiping (i.e. pain) behaviours. Thus, results from in vivo and in vitro experiments to explore the mechanism of LPA action suggested that TRPA1 and TRPV1 play crucial roles in LPA‐induced itch sensation.
LPA receptors are involved in an LPA‐induced [Ca2+]i increase in DRG neurons
Given that the TRPA1+ and TRPV1+ populations were not well encompassed by the LPA+ population (Fig. 2 F), we hypothesized that indirect mechanisms initiated by LPA receptor activation, as well as direct activation of TRPA1 and TRPV1 by LPA, are involved in LPA activity. We first investigated if LPA receptors are involved in the LPA‐induced [Ca2+]i increase seen in DRG neurons. The six known LPA receptors are G protein‐coupled receptors that are currently referred to as LPA1–LPA6 (Kihara et al. 2014). While diverse expression patterns for these receptors are known in various organs (Choi et al. 2010), LPA1, LPA3 and LPA5, which all cause [Ca2+]i increases in response to LPA (Fischer et al. 2001; Lee et al. 2006), are reportedly expressed in DRG neurons (Inoue et al. 2004; Lee et al. 2006; Nieto‐Posadas et al. 2012). We confirmed this expression in the DRG neurons by RT‐PCR (Fig. 4 A). To investigate the involvement of these three LPA receptors, we first tested the antagonist H2L 5765834 (H2L) that affects the LPA1, LPA3 and LPA5 receptors. H2L (10 μm) decreased the number of LPA+ neurons (8.8 ± 3.5%, n = 45/347) (Fig. 4 B), indicating that one or more of these three LPA receptors mediated the LPA‐induced [Ca2+]i increase in DRG neurons. To determine which LPA receptor subtype had the most significant role in LPA‐induced DRG responses, an antagonist specific to each LPA receptor was next used. The highly selective LPA1 antagonist AM095 (10 μm) partially reduced the number of LPA+ neurons (27.4 ± 1.7%, n = 119/457), although this change was not statistically significant (Fig. 4 B). Meanwhile, the LPA3 antagonist DGPP (10 μm) had little effect on the LPA+ population (35.3 ± 6.5%, n = 158/514) (Fig. 4 B). In contrast, TC LPA5 4 (TC, 10 μm), a selective antagonist of LPA5, markedly decreased the number of LPA+ neurons (4.9 ± 1.8%, n = 16/340) (Fig. 4 B), suggesting that LPA5 is critically involved in LPA‐induced [Ca2+]i increases. To establish the involvement of LPA5 at a genetic level, we performed RNAi experiments. After confirming the effectiveness of siRNAs at reducing mLpa5 expression in HEK293T cells and DRG neurons (Fig. 4 C and D), we knocked down mLpa5 in DRG neurons with the siRNAs and performed Ca2+ imaging experiments. Following mLpa5 knockdown, the number of LPA+ neurons (Fig. 4 E) and [Ca2+]i changes in DRG neurons upon LPA application (Fig. 4 F) were significantly decreased. Together, these results suggested that LPA5 is the most likely LPA receptor to be involved in the LPA‐induced Ca2+ response in mouse DRG neurons.
Figure 4. LPA5 is required for LPA‐induced signalling in DRG neurons.
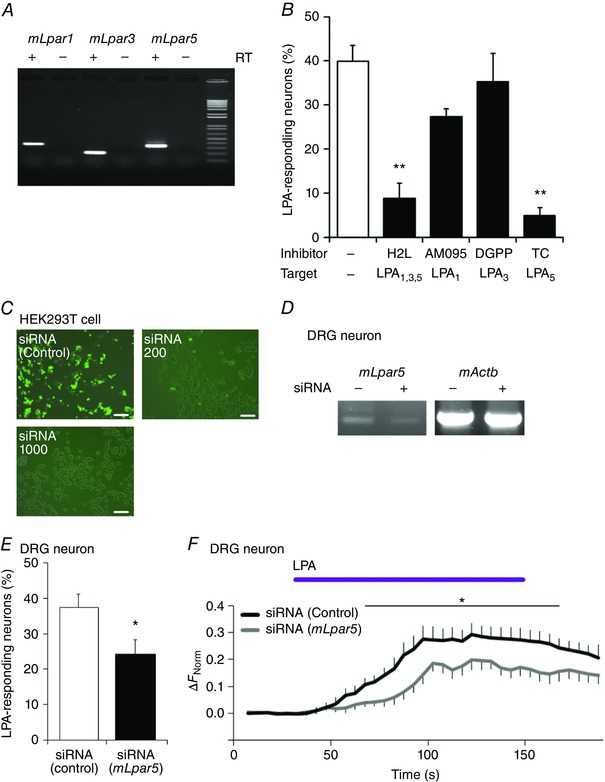
A, RT‐PCR analysis of LPA1, LPA3 and LPA5 receptor (mLpar1, mLpar3 and mLpar5, respectively) gene expression in mouse DRG neurons. Equivalent results were obtained in at least three independent tests of samples isolated from other mice. RT, reverse transcriptase. B, percentages of LPA (5 μm)‐responding DRG neurons from WT mice during application of LPA (5 μm) alone and LPA with LPA receptor antagonists including H2L 5765834 (H2L, 10 μm), AM095 (10 μm), DGPP (10 μm) and TC LPA5 4 (TC, 10 μm); n = 4–13. Cells ≥ 300. ** P < 0.01 vs. LPA by Dunnett's multiple comparison test. C, representative images of siRNA‐mediated reductions in mLpa5 gene expression in HEK293T cells. Compared with transfection of negative‐control siRNA (upper left), enhanced green fluorescent protein (EGFP) signals were dose‐dependently decreased by siRNAs for mLpa5 (200 and 1000 pg, upper right and lower left, respectively). Scale bars: 100 μm. D, representative gel image of mLpar5 mRNA expression upon siRNA treatment in DRG neurons. Minus siRNA indicates the data obtained with a random sequence siRNA. Predicted sizes of the amplified fragments are 334 bp (mLpar5) and 573 bp (mActb). E, percentages of LPA‐responsive neurons in negative‐control siRNA‐ or mLpa5 siRNA‐transfected neurons; n = 4 and 6 coverslips treated with negative‐control siRNA or mLpa5 siRNAs, respectively. F, [Ca2+]i changes in siRNA‐transfected DRG neurons upon application of 5 μm LPA; n = 23 and 32 for negative‐control siRNA‐ and mLpa5 siRNA‐transfected neurons, respectively. * P < 0.05 by Welch's t test.
Downstream pathways of LPA receptors in DRG neurons
Although the LPA5 receptor was found to be involved in LPA‐induced [Ca2+]i increases in mouse DRG neurons, the finding that LPA‐induced [Ca2+]i increases nearly disappeared in the absence of extracellular Ca2+ and upon co‐application of the TRP antagonists A967079 and Cap (Fig. 2 C and 3 A) suggests the possible existence of mechanisms that are induced by LPA5 receptor activation to promote Ca2+ influx through TRPA1 and/or TRPV1 channels. Given the uncertainty about whether multiple G protein‐coupled LPA receptors expressed in the same cells interact with one another, and how complex G‐protein signalling is involved in itch‐related intracellular pathways (Choi et al. 2010; Kihara et al. 2014), exploration of critical molecules or pathways that are downstream targets of the LPA receptor and lead to activation of TRPA1 and TRPV1 channels is important. Intracellular lipid production and phospholipid depletion by phospholipase activity could possibly activate TRPA1 and TRPV1 (Dai et al. 2007; Rohacs et al. 2008; Kukkonen, 2011) following LPA5 activation. Therefore, we focused on the phospholipases and pathways that are thought to produce putative TRPA1 and TRPV1 ligands. We hypothesized that Ca2+‐independent phospholipase A2 (iPLA2) (Dennis et al. 2011), phosphatidylcholine‐specific phospholipase C (PC‐PLC) (Adibhatla et al. 2012) and phospholipase D (PLD) (Selvy et al. 2011) activities may be involved in the ligand production (Fig. 5 A). RT‐PCR analysis showed that both iPLA2 (Pla2g6) and PLD (Pld1 and Pld2) are expressed in DRG neurons (Fig. 5 B). We also confirmed the expression of the phosphatidylinositol‐specific phospholipase C (PI‐PLC) gene (Plcb3), because this enzyme has also been reported to be involved in itch sensation (Han et al. 2006; Imamachi et al. 2009; Wilson et al. 2013) (Fig. 5 A and B).
Figure 5. PLD is required for LPA‐induced signalling in DRG neurons.
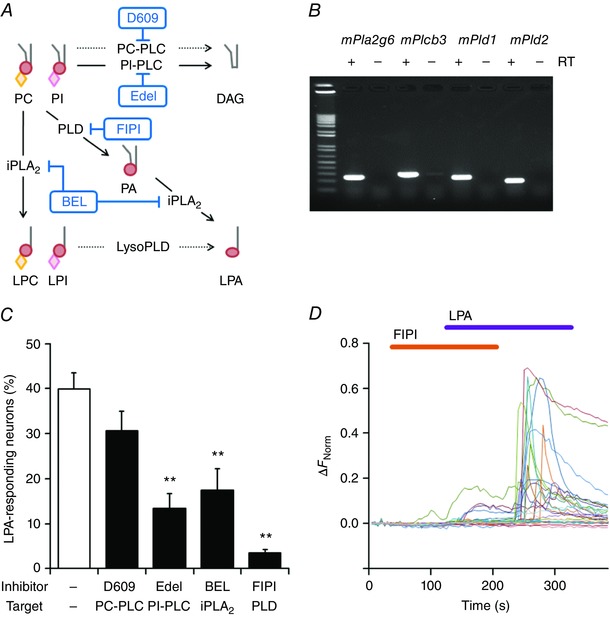
A, hypothetical intracellular cascades of various lipid products upon LPA receptor activation. Processing of membrane lipids such as PC and PI can be catalysed by multiple phospholipases such as PC‐PLC, PI‐PLC, iPLA2 and PLD (arrows) to produce various lipids, including DAG, LPC, LPI, PA and LPA. Phospholipase inhibitors are indicated in blue. BEL, bromoenol lactone; DAG, diacylglycerol; Edel, edelfosine; iPLA2, calcium‐independent phospholipase A2; LPC, lysophosphatidylcholine; LPI, lysophosphatidylinositol; PA, phosphatidic acid; PC, phosphatidylcholine; PC‐PLC, PC‐specific phospholipase C; PI, phosphatidylinositol; PI‐PLC, PI‐specific phospholipase C; PLD, phospholipase D. Dotted lines indicate uncertain enzymatic pathways. Grey lines, red circles, orange diamonds and pink diamonds indicate hydrocarbon chains, phosphate groups, phosphorylcholine and inositol phosphate, respectively. B, expression of mouse iPLA2, PLCβ3, PLD1 and PLD2 genes (mPla2g6, mPlcb3, mPld1 and mPld2, respectively) in DRG neurons examined in RT‐PCR experiments. Equivalent results were obtained from at least three independent tests of samples isolated from other mice. C, percentages of LPA‐responding DRG neurons from WT mice during application of LPA (5 μm) alone and LPA with phospholipase inhibitors, including D609 (10 μm), Edel (10 μm), BEL (1 μm) and FIPI (10 μm); n = 5–13. Cells ≥ 200. ** P < 0.01 vs. LPA by Dunnett's multiple comparison test. Data are shown as mean ± SEM. D, representative traces of [Ca2+]i changes in DRG neurons following 5 μm LPA application with and without 10 μm FIPI. Equivalent results were obtained from at least three independent tests.
An inhibitor of PC‐PLC (D609, 10 μm) that produces diacylglycerol (DAG) and phosphorylcholine (Adibhatla et al. 2012) (Fig. 5 A) did not affect the LPA+ neuron population (30.6 ± 403%, n = 126/403) (Fig. 5 C), suggesting that PC‐PLC activity and products are not required for the response of DRG neurons to LPA. PI‐PLC cleaves membrane PI 4,5‐bisphosphate (PIP2) to produce DAG (Fig. 5 A) and inositol 1,4,5‐trisphosphate (IP3) to cause an increase in [Ca2+]i from IP3‐dependent Ca2+ stores (Kadamur & Ross, 2013). We examined this enzyme because previous reports indicated that PI‐PLC and PI‐PLC signalling‐related products were related to itch sensation (Han et al. 2006; Imamachi et al. 2009; Wilson et al. 2013) as well as TRPA1 and TRPV1 activation (Bandell et al. 2004; Woo et al. 2008). The selective PI‐PLC inhibitor U‐73122 exhibited non‐specific effects in DRG neurons (data not shown), as previously reported in Chinese hamster ovary (CHO) cells expressing TRPA1 and in DRG neurons (Kim et al. 2011; Bandell et al. 2004; Karashima et al. 2008). Therefore, we used another PI‐PLC inhibitor, edelfosine (Edel, 10 μm), which decreased the number of LPA+ neurons (13.4 ± 3.3%, n = 43/318) (Fig. 5 C), indicating that PI‐PLC activity is indeed involved to some extent in LPA‐induced signalling in DRG neurons.
PLA2 activity produces lysophospholipids (LPLs) (Fig. 5 A) and fatty acids (Dennis et al. 2011), both of which can activate several ion channels, including TRPs (Kukkonen, 2011). A specific inhibitor of iPLA2, BEL (1 μm), decreased the number of LPA+ neurons (17.5 ± 4.7%, n = 118/694) (Fig. 5 C), suggesting that iPLA2 activity is involved in the LPA pathway. Meanwhile, PLD hydrolyses phospholipids and LPLs into PA and LPA (Selvy et al. 2011), respectively, and PA can be further hydrolysed to fatty acids and LPA by subsequent PLA2 activity (Thomson & Clark, 1995; Choi et al. 2010; Tigyi, 2010; Kukkonen, 2011) (Fig. 5 A). The potent PLD‐specific inhibitor FIPI (10 μm) almost abolished LPA+ neurons (3.5 ± 0.7%, n = 8/237) (Fig. 5 C and D), suggesting that products generated by PLD activity are strongly involved in the LPA‐induced [Ca2+]i response in DRG neurons. These results demonstrated the involvement of PI‐PLC, iPLA2 and especially PLD in the LPA‐induced response in DRG neurons and suggested that, among the phospholipases, PLD may play the most crucial role in LPA signalling.
Direct activation of TRPA1 by LPA
DAG, LPC, LPI, PA and LPA could be produced by the enzymatic activity of PI‐PLC, iPLA2 and PLD (Fig. 5 A) downstream of LPA5 receptor activation by extracellular LPA. The results shown here, together with the requirement of TRPA1 and TRPV1 for the LPA‐induced increase in [Ca2+]i (Fig. 3 A and B), raise the possibility that these molecules may directly activate TRPA1 and/or TRPV1 intracellularly. An earlier report showed that a DAG analogue activates TRPA1 (Bandell et al. 2004), and the effects of DAG, phospholipids and LPLs on TRPV1 function have also been examined (Brauchi et al. 2007; Nieto‐Posadas et al. 2012). Therefore, to examine whether DAG analogues directly activate TRPA1 and TRPV1 channels from the intracellular side, we applied LPC, LPI, PA or LPA onto the intracellular side of the plasma membrane of HEK293T cells expressing either TRPA1 or TRPV1. LPA, but not LPC, LPI or PA, strongly induced unitary single‐channel currents of TRPA1 or TRPV1 (Fig. 6 B–E), suggesting that LPA is the most likely product of the phospholipases that can activate both channels. No currents were induced by LPA in patch membranes that lacked TRPA1 and TRPV1 expression (Fig. 6 A). LPA‐induced single‐channel currents of TRPA1 and TRPV1 were significantly inhibited by the antagonists A967079 (1 μm) and capsazepine (10 μm), respectively (Fig. 6 D–G), which supports the idea that LPA activates TRPA1 and TRPV1.
Figure 6. LPA directly activates mouse TRPA1 and TRPV1 from the intracellular side, but not from the extracellular side in single channel recordings.
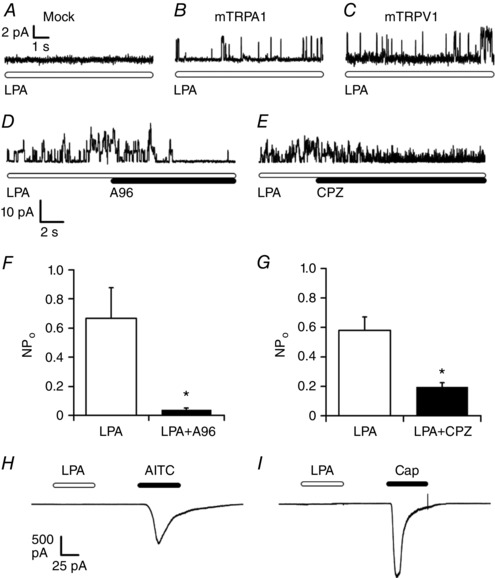
A–C, representative single‐channel recordings at +30 mV using inside‐out membrane patches obtained from HEK293T cells not expressing mTRPA1 or mTRPV1 (A), and expressing either TRPA1 (B) or mTRPV1 (C); 5 μm LPA was applied; n = 3–20. Equivalent currents were independently obtained five times. D and E, representative traces showing that the TRPA1 and TRPV1 inhibitors, A‐967079 (A96, 1 μm) and capsazepine (CPZ, 30 μm), reduced LPA‐induced currents in membrane patches expressing mTRPA1 (D) or mTRPV1 (E), respectively. F and G, comparison of NPo values of LPA‐induced currents before and after application of A96 (1 μm) (F) or CPZ (30 μm) (G); n = 5. * P < 0.05 by Welch's t test. Data are shown as mean ± SEM. H and I, whole‐cell currents at −60 mV obtained from HEK293T cells expressing mTRPA1 (H) or mTRPV1 (I) upon extracellular application of LPA (5 μm) followed by AITC (100 μm) or capsaicin (Cap, 1 μm); n ≥ 3.
Given that the ability of LPA to activate TRPA1 from the extracellular side was unclear, and that LPA‐dependent TRPV1 activation was previously demonstrated (Nieto‐Posadas et al. 2012), we also examined whether LPA activates TRPA1 and TRPV1 extracellularly in whole‐cell patch‐clamp recordings. Interestingly, LPA did not induce inward currents in the cells that responded to AITC or capsaicin, (Fig. 6 H and I), suggesting that LPA activates both TRPA1 and TRPV1 intracellularly, but not extracellularly.
Identification of the amino acids involved in TRPA1 activation by LPA
Interactions of phospholipids such as PIP2 with ion channels and the detailed interaction sites have been well studied (Suh & Hille, 2008), and thus specific amino acids that govern the interaction between TRPV1 and LPA could be identified based on the fact that the entire LPA structure is included in PIP2 (Nieto‐Posadas et al. 2012). Therefore, we tried to identify the amino acid residues involved in LPA‐induced activation of TRPA1 by focusing on the ‘putative pleckstrin homology (PH)‐like domain’ defined as [K/R]‐X3‐11‐[K/R]‐X‐[K/R]‐[K/R] (R: arginine; X: any amino acid), which is predicted to be involved in the effect of PIP2 on TRPA1 (Nilius et al. 2008). Considering the negative charges of LPA and PIP2, the positively charged PH‐like domains would be candidates for the LPA and TRPA1 interaction. Among the four PH‐like domains (PH‐like 1–4) in TRPA1 (Karashima et al. 2008), we focused on the PH‐like domains 3 and 4 because these sites are located near the transmembrane domains (Paulsen et al. 2015), and in other ion channels many phospholipid interaction sites have been shown to exist near the transmembrane domains (Suh & Hille, 2008). We also focused on the subcellular K/R‐rich regions that are located close to the transmembrane domains and other nearby serial K/R residues (Fig. 7 A). In total, 26 K and R amino acids were chosen as candidate residues for involvement in the interaction of LPA with TRPA1. Single‐channel analyses in HEK293T cells expressing WT or mutated TRPA1 channels identified two mutants (KK672‐673QQ and KR977‐978QQ) that showed markedly reduced NPo (number of channels times open probability) values (0.09 ± 0.05 and 0.13 ± 0.04, respectively) relative to WT TRPA1 (0.35 ± 0.07) following LPA application (Fig. 7 B), while considerable responses to the TRPA1 agonists, carvacrol (500 μm) and AITC (100 μm), were maintained (Fig. 7 C). These data indicated that these four basic residues are likely to be involved in TRPA1 activation by LPA.
Figure 7. Identification of amino acid residues involved in LPA‐induced TRPA1 activation.
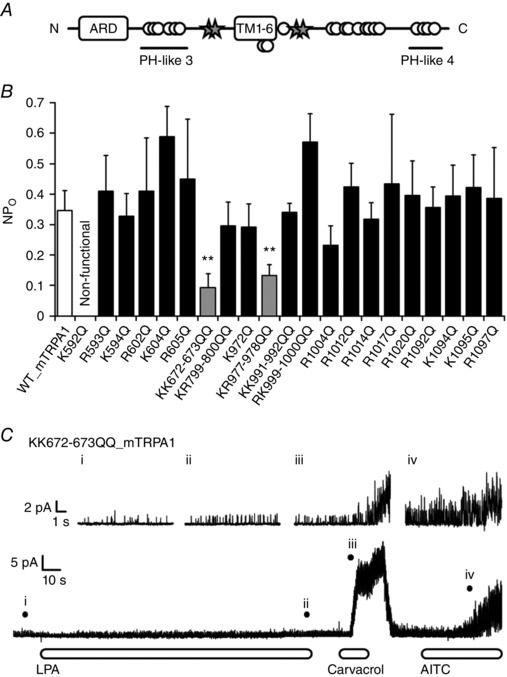
A, schematic diagram of the mTRPA1 structure. ARD, ankyrin repeat domains; PH‐like 3 and 4, pleckstrin homology‐like domain 3 and 4; TM, transmembrane domains. Open circles and stars indicate mutated amino acids; four amino acids (stars) were found to be involved in LPA activity. B, comparison of NPo values of WT and mutated mTRPA1 upon LPA (5 μm) application from inside‐out single‐channel recordings; n = 3–13. ** P < 0.01 vs. WT by Welch t test. Data are shown as mean ± SEM. C, representative single‐channel recordings obtained from the KK672‐673QQ mTRPA1 mutant‐expressing patches upon sequential application of LPA (5 μm), carvacrol (500 μm) and AITC (100 μm). Each magnified current in the upper trace corresponds to currents at points i–iv indicated with filled circles in the lower trace; n ≥ 3.
PLD activity is required for LPA‐induced itch in vivo
PLD activity was shown to be crucial for LPA‐induced [Ca2+]i responses in DRG neurons (Fig. 5 C and D). Therefore, to ascertain if PLD activity is responsible for LPA‐induced itch sensation in vivo, we performed cheek injection experiments. LPA‐induced scratching behaviours were decreased by co‐application with FIPI (200 nmol/10 μl per site) (Fig. 8 A) without significant changes in wiping behaviours (Fig. 8 B), suggesting that the decrease in scratching induced by FIPI is not compensated for by an increase in wiping behaviours. In contrast, co‐application of LPA with the PLC inhibitor D609 (200 nmol/10 μl per site) did not significantly affect LPA‐induced scratching and wiping behaviours (Fig. 8 C and D), which is consistent with the result that D609 did not evoke LPA‐induced [Ca2+]i responses in DRG neurons (Fig. 5 C). These results suggested that PLD activity is required for LPA‐induced itch sensation in vivo as well as the LPA‐induced [Ca2+]i response observed in DRG neurons in vitro.
Figure 8. PLD activity is involved in LPA‐induced itch in mice.
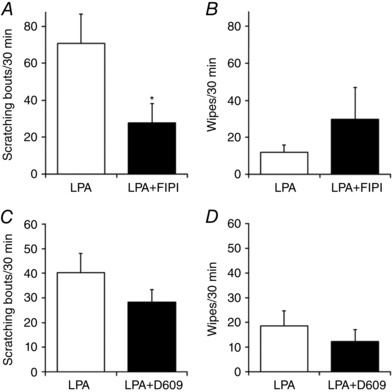
A and B, scratching (A) and wiping (B) behaviours observed for 30 min in WT mice using the cheek injection model. LPA (100 nmol/10 μl per site) without and with FIPI (200 nmol/10 μl per site) was injected; n = 7 for LPA, n = 8 for LPA + FIPI. C and D, scratching (C) and wiping (D) behaviours observed for 30 min in WT mice caused by LPA without and with D609 (200 nmol/10 μl per site) using the cheek injection model; n = 8 for LPA, n = 10 for LPA + D609. * P < 0.05 by Welch's t test. Data are shown as mean ± SEM.
Discussion
In this study we demonstrated that LPA is a pruritogen, but not an algogen, and that DRG neurons respond to LPA through activation of TRPA1 and TRPV1. Notably, PLD activity is required for LPA‐induced signalling downstream of LPA5 activation. We also demonstrated that LPA, a PLD activity‐mediated product, directly activates TRPA1 from the intracellular side. Combined with the report regarding TRPV1 (Nieto‐Posadas et al. 2012), these findings support our hypothesis that LPA5 activation by extracellular LPA induces de novo production of intracellular LPA via PLD and iPLA2 activity that subsequently leads to TRPA1 and TRPV1 activation (Fig. 9). Importantly, PLD activity as well as that of TRPA1 and TRPV1 is required for LPA‐induced pruritus, suggesting that the LPA signalling observed in vitro could also occur in vivo.
Figure 9. Hypothetical signalling pathway of LPA‐induced itch.
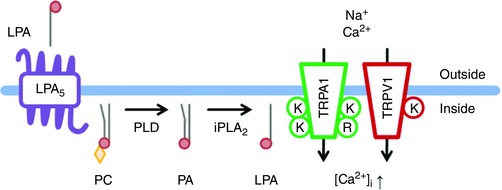
Extracellular LPA activates the LPA5 receptor and membrane lipids are metabolized mainly by PLD. PLD and iPLA2 activity leads to intracellular LPA production and the resulting LPA directly activates TRPA1 and TRPV1 through interactions with KK672–673/KR977–978 and K710 (Nieto‐Posadas et al. 2012), respectively, leading to an increase in [Ca2+]i. Thin grey lines, red circles and orange diamonds indicate hydrocarbon chains, phosphate groups and phosphorylcholine, respectively.
The ambiguity concerning whether LPA functions as a pruritogen or algogen that arose from results of previous behavioural studies (Hashimoto et al. 2004; Kremer et al. 2010; Nieto‐Posadas et al. 2012; Alemi et al. 2013) can partly be explained by the lack of definition or distinction between possible pain‐related licking behaviours and biting behaviours. Since licking and biting of the hindpaws can be induced by algogens and pruritogens, respectively, it is difficult to readily discriminate between the two. Well‐defined biting behaviours toward the hindpaws that were induced by pruritogenic conditions or pruritogens were observed in a dry‐skin model in mice (Akiyama et al. 2010 b) and by serotonin injection into the hindpaw (Kuraishi et al. 2008). Because of the difficulty in distinguishing between the two behaviours, particular attention should be paid to compounds that have uncharacterized effects (Akiyama & Carstens 2013; Han & Dong, 2014). Taking these facts into consideration, several compounds that appeared to have both algogen and pruritogen properties were confirmed to be pruritogens by cheek injection experiments (Shimada & LaMotte, 2008; Akiyama et al. 2010 a; Wilson et al. 2011, 2013; Morita et al. 2015). In this study the cheek injection results support a role for LPA as a pruritogen.
In healthy humans, serum LPA concentrations are typically in the submicromolar range (Hosogaya et al. 2008), which is lower than the concentration (5 μm) we used in this study. As such, LPA may not activate primary sensory neurons under healthy conditions, but high‐level LPA production could induce itch sensations in cholestasis patients, although the correlation between LPA concentrations and activity of LPA‐producing enzymes under pruritic condition awaits examination. However, the measurement of plasma LPA levels is challenging due to the rapid degradation of LPA by lipid phosphate phosphatases such that the half‐life of plasma LPA is about 3 min (Albers et al. 2010). Nonetheless, a good correlation between serum LPA‐producing activity and itch intensity in cholestatic patients with pruritus (Kremer et al. 2010) suggests that a high LPA concentration is sufficient to activate peripheral sensory neurons, resulting in itch sensations.
In this study we showed that TRPA1 and TRPV1 are required for LPA‐induced signalling in DRG neurons and LPA‐induced pruritus in vivo (Figs 2 and 3). Interestingly, the in vivo results showed that ablating either of the two channels is sufficient to diminish LPA‐induced pruritus to the levels seen for vehicle treatment (Figs 1 C and 3 B). These observations suggest a possible mechanism for LPA‐induced itch signalling and scratching in vitro and in vivo: a decrease in the total number of LPA+ neurons in TRPA1KO or TRPV1KO mice could fully decrease LPA‐induced pruritus. These outcomes could partly be explained by potential functional interactions between the two channels during pain signalling (Weng et al. 2015). Thus, TRPA1 and TRPV1 could contribute to LPA action separately or in concert. Indeed, pruritus that was dependent on both TRPA1 and TRPV1 was previously reported to be caused by LTB4 and IL‐31 (Fernandes et al. 2013; Cevikbas et al. 2014). In the latter case, the TRPA1+/TRPV1+ population was suggested to play a crucial role in itch signalling, which is similar to our findings.
We demonstrated the possible involvement of iPLA2, PI‐PLC and, most critically, PLD in LPA signalling, all of which can be activated downstream of LPA receptor activation (Choi et al. 2010; Tigyi, 2010; Kukkonen, 2011), although no highly specific enzyme inhibitors are available. However, the finding that LPA had no effect in whole‐cell recordings (Fig. 6 H and I) together with the unique activity of LPA among the above signalling pathways suggests that LPA produced de novo by both iPLA2 and PLD leads to activation of TRPA1 and TRPV1 channels. Our results also suggest that PI‐PLC is partially involved in LPA action, which is consistent with reports showing PI‐PLC‐dependent itch signalling induced by various pruritogens (Han et al. 2006; Imamachi et al. 2009; Wilson et al. 2011, 2013). Collectively, LPA endogenously produced by PLD and iPLA2 activity causes TRPA1 and TRPV1 activation (Fig. 9).
We also used site‐directed mutagenesis to identify for the first time the TRPA1 residues that are necessary for the interaction between LPA and TRPA1. Residues KK672–673 and KR977–978, which are located close to the transmembrane domains in the TRPA1 N‐ and C‐terminus, respectively, were found to be important for the LPA–TRPA1 interaction. The location of these K and R residues is consistent with earlier findings that showed interactions between channels and phospholipids such as PIP2 (Suh & Hille, 2008). The TRPA1 structure was previously clarified by cryo‐electron microscopy single‐particle analysis (Paulsen et al. 2015) and phospholipid interaction sites were identified in TRPV1 (Brauchi et al. 2007; Nieto‐Posadas et al. 2012), but not all basic amino acid residues in TRPA1 were examined in this study. The reports showing that PIP2 interaction sites are located on the distal N‐terminal region of TRPV4 (Garcia‐Elias et al. 2013; Takahashi et al. 2014), one of which is a predicted PH‐like domain (Nilius et al. 2008), suggest that other phospholipid interaction sites could exist in TRPA1.
In addition to TRPA1 and TRPV1, we used phospholipase inhibitors to demonstrate the involvement of PLD in LPA‐induced pruritus. LPA was identified as the most likely candidate pruritogen, which is consistent with the fact that serum LPA‐producing activity correlates with itch intensity of cholestatic patients with pruritus (Kremer et al. 2010). On the other hand, bile acids, which are increased in cholestasis but not correlated to itch intensity (Kremer et al. 2010), were recently shown to induce pruritus in mice through the TGR5 receptor (Alemi et al. 2013) and TRPA1 (Lieu et al. 2014). These apparently different phenomena might be due to differences between humans and mice or the acute and chronic phases of cholestatic disease. Furthermore, bile duct ligation in cholestatic rats induced forepaw and hindlimb scratching behaviours that are thought to be related to the PAR2 receptor and TRPV1, as evidenced by increases in the expression levels of these proteins (Belghiti et al. 2013). Therefore, the establishment of a cholestatic mouse model would be necessary to elucidate whether our hypothetical pathway that involves LPA5, PLD, TRPA1 and TRPV1 (Fig. 9) is physiologically relevant for inducing pruritus.
Additional information
Conflict of interest
The authors declare no competing financial interests.
Author contributions
H.K. and M.T. wrote the main manuscript text and H.K. prepared Figs 1, 2, 3, 4, 5, 6, 7, 8, 9. F.N and K.U. contributed to mutagenesis experiments and siRNA experiments, respectively. All authors have approved the final version of the manuscript and agreed to be accountable for all aspects of the work.
Funding
The study was supported by a Grant‐in‐Aid for Scientific Research from the Ministry of Education, Culture, Sports, Science and Technology in Japan (nos. 15H02501 and 15H05928 to M.T., and no. 16K21691 to H.K.).
Acknowledgements
We are grateful to Dr David Julius (University of California, San Francisco) for kindly providing TRPA1KO and TRPV1KO mice. We also thank Dr Junken Aoki (Tohoku university) for helpful suggestions.
Contributor Information
Kunitoshi Uchida, Email: uchida@college.fdcnet.ac.jp.
Makoto Tominaga, Email: tominaga@nips.ac.jp.
References
- Adibhatla RM, Hatcher JF & Gusain A (2012). Tricyclodecan‐9‐yl‐xanthogenate (D609) mechanism of actions: a mini‐review of literature. Neurochem Res 37, 671–679. [DOI] [PMC free article] [PubMed] [Google Scholar]
- Akiyama T, Carstens MI & Carstens E (2010. a). Facial injections of pruritogens and algogens excite partly overlapping populations of primary and second‐order trigeminal neurons in mice. J Neurophysiol 104, 2442–2450. [DOI] [PMC free article] [PubMed] [Google Scholar]
- Akiyama T, Carstens MI & Carstens E (2010. b). Spontaneous itch in the absence of hyperalgesia in a mouse hindpaw dry skin model. Neurosci Lett 484, 62–65. [DOI] [PMC free article] [PubMed] [Google Scholar]
- Akiyama T & Carstens E (2013). Neural processing of itch. Neuroscience 250, 697–714. [DOI] [PMC free article] [PubMed] [Google Scholar]
- Albers HM, Dong A, van Meeteren LA, Egan DA, Sunkara M, van Tilburg EW, Schuurman K, van Tellingen O, Morris AJ, Smyth SS, Moolenaar WH & Ovaa H (2010). Boronic acid‐based inhibitor of autotaxin reveals rapid turnover of LPA in the circulation. Proc Natl Acad Sci USA 107, 7257–7262. [DOI] [PMC free article] [PubMed] [Google Scholar]
- Alemi F, Kwon E, Poole DP, Lieu T, Lyo V, Cattaruzza F, Cevikbas F, Steinhoff M, Nassini R, Materazzi S, Guerrero‐Alba R, Valdez‐Morales E, Cottrell GS, Schoonjans K, Geppetti P, Vanner SJ, Bunnett NW & Corvera CU (2013). The TGR5 receptor mediates bile acid‐induced itch and analgesia. J Clin Invest 123, 1513–1530. [DOI] [PMC free article] [PubMed] [Google Scholar]
- Bandell M, Story GM, Hwang SW, Viswanath V, Eid SR, Petrus MJ, Earley TJ & Patapoutian A (2004). Noxious cold ion channel TRPA1 is activated by pungent compounds and bradykinin. Neuron 41, 849–857. [DOI] [PubMed] [Google Scholar]
- Bautista DM, Jordt SE, Nikai T, Tsuruda PR, Read AJ, Poblete J, Yamoah EN, Basbaum AI & Julius D (2006). TRPA1 mediates the inflammatory actions of environmental irritants and proalgesic agents. Cell 124, 1269–1282. [DOI] [PubMed] [Google Scholar]
- Belghiti M, Estévez‐Herrera J, Giménez‐Garzó C, González‐Usano A, Montoliu C, Ferrer‐Montiel A, Felipo V & Planells‐Cases R (2013). Potentiation of the transient receptor potential vanilloid 1 channel contributes to pruritogenesis in a rat model of liver disease. J Biol Chem 288, 9675–9685. [DOI] [PMC free article] [PubMed] [Google Scholar]
- Brauchi S, Orta G, Mascayano C, Salazar M, Raddatz N, Urbina H, Rosenmann E, Gonzalez‐Nilo F & Latorre R (2007). Dissection of the components for PIP2 activation and thermosensation in TRP channels. Proc Natl Acad Sci USA 104, 10246–10251. [DOI] [PMC free article] [PubMed] [Google Scholar]
- Caterina MJ, Leffler A, Malmberg AB, Martin WJ, Trafton J, Petersen‐Zeitz KR, Koltzenburg M, Basbaum AI & Julius D (2000). Impaired nociception and pain sensation in mice lacking the capsaicin receptor. Science 288, 306–313. [DOI] [PubMed] [Google Scholar]
- Cevikbas F, Wang X, Akiyama T, Kempkes C, Savinko T, Antal A, Kukova G, Buhl T, Ikoma A, Buddenkotte J, Soumelis V, Feld M, Alenius H, Dillon SR, Carstens E, Homey B, Basbaum A & Steinhoff M (2014). A sensory neuron‐expressed IL‐31 receptor mediates T helper cell‐dependent itch: involvement of TRPV1 and TRPA1. J Allergy Clin Immunol 133, 448–460. [DOI] [PMC free article] [PubMed] [Google Scholar]
- Choi JW, Herr DR, Noguchi K, Yung YC, Lee CW, Mutoh T, Lin ME, Teo ST, Park KE, Mosley AN & Chun J (2010). LPA receptors: subtypes and biological actions. Annu Rev Pharmacol Toxicol 50, 157–186. [DOI] [PubMed] [Google Scholar]
- Dai Y, Wang S, Tominaga M, Yamamoto S, Fukuoka T, Higashi T, Kobayashi K, Obata K, Yamanaka H & Noguchi K (2007). Sensitization of TRPA1 by PAR2 contributes to the sensation of inflammatory pain. J Clin Invest 117, 1979–1987. [DOI] [PMC free article] [PubMed] [Google Scholar]
- Dennis EA, Cao J, Hsu YH, Magrioti V & Kokotos G (2011). Phospholipase A2 enzymes: physical structure, biological function, disease implication, chemical inhibition, and therapeutic intervention. Chem Rev 111, 6130–6185. [DOI] [PMC free article] [PubMed] [Google Scholar]
- Fernandes ES, Vong CT, Quek S, Cheong J, Awal S, Gentry C, Aubdool AA, Liang L, Bodkin JV, Bevan S, Heads R & Brain SD (2013). Superoxide generation and leukocyte accumulation: key elements in the mediation of leukotriene B4‐induced itch by transient receptor potential ankyrin 1 and transient receptor potential vanilloid 1. FASEB J 27, 1664–1673. [DOI] [PubMed] [Google Scholar]
- Fischer DJ, Nusser N, Virag T, Yokoyama K, Da Wang, Baker DL, Bautista, D , Parrill AL & Tigyi G (2001). Short‐chain phosphatidates are subtype‐selective antagonists of lysophosphatidic acid receptors. Mol Pharmacol 60, 776–784. [PubMed] [Google Scholar]
- Garcia‐Elias A, Mrkonjic S, Pardo‐Pastor C, Inada H, Hellmich UA, Rubio‐Moscardó F, Plata C, Gaudet R, Vicente R & Valverde MA (2013). Phosphatidylinositol‐4,5‐biphosphate‐dependent rearrangement of TRPV4 cytosolic tails enables channel activation by physiological stimuli. Proc Natl Acad Sci USA 110, 9553–9558. [DOI] [PMC free article] [PubMed] [Google Scholar]
- Han L & Dong X (2014). Itch mechanisms and circuits. Annu Rev Biophys 43, 331–355. [DOI] [PMC free article] [PubMed] [Google Scholar]
- Han SK, Mancino V & Simon MI (2006). Phospholipase Cβ 3 mediates the scratching response activated by the histamine H1 receptor on C‐fiber nociceptive neurons. Neuron 52, 691–703. [DOI] [PubMed] [Google Scholar]
- Hashimoto T, Ohata H & Momose K (2004). Itch–scratch responses induced by lysophosphatidic acid in mice. Pharmacology 72, 51–56. [DOI] [PubMed] [Google Scholar]
- Hosogaya S, Yatomi Y, Nakamura K, Ohkawa R, Okubo S, Yokota H, Ohta M, Yamazaki H, Koike T & Ozaki Y (2008). Measurement of plasma lysophosphatidic acid concentration in healthy subjects: strong correlation with lysophospholipase D activity. Ann Clin Biochem 45, 364–368. [DOI] [PubMed] [Google Scholar]
- Ikoma A, Steinhoff M, Ständer S, Yosipovitch G & Schmelz M (2006). The neurobiology of itch. Nat Rev Neurosci 7, 535–547. [DOI] [PubMed] [Google Scholar]
- Imamachi N, Park GH, Lee H, Anderson DJ, Simon MI, Basbaum AI & Han SK (2009). TRPV1‐expressing primary afferents generate behavioral responses to pruritogens via multiple mechanisms. Proc Natl Acad Sci USA 106, 11330–11335. [DOI] [PMC free article] [PubMed] [Google Scholar]
- Inoue M, Rashid MH, Fujita R, Contos JJ, Chun J & Ueda H (2004). Initiation of neuropathic pain requires lysophosphatidic acid receptor signaling. Nat Med 10, 712–718. [DOI] [PubMed] [Google Scholar]
- Kadamur G & Ross EM (2013). Mammalian phospholipase C. Annu Rev Physiol 75, 127–154. [DOI] [PubMed] [Google Scholar]
- Karashima Y, Prenen J, Meseguer V, Owsianik G, Voets T & Nilius B (2008). Modulation of the transient receptor potential channel TRPA1 by phosphatidylinositol 4, 5‐biphosphate manipulators. Pflugers Arch 457, 77–89. [DOI] [PubMed] [Google Scholar]
- Kihara Y, Maceyka M, Spiegel S & Chun J (2014). Lysophospholipid receptor nomenclature review: IUPHAR Review 8. Br J Pharmacol 171, 3575–3594. [DOI] [PMC free article] [PubMed] [Google Scholar]
- Kim SJ, Park GH, Kim D, Lee J, Min H, Wall E, Lee CJ, Simon MI, Lee SJ & Han SK (2011). Analysis of cellular and behavioral responses to imiquimod reveals a unique itch pathway in transient receptor potential vanilloid 1 (TRPV1)‐expressing neurons. Proc Natl Acad Sci USA 108, 3371–3376. [DOI] [PMC free article] [PubMed] [Google Scholar]
- Kremer AE, Martens JJ, Kulik W, Ruëff F, Kuiper EM, van Buuren HR, van Erpecum KJ, Kondrackiene J, Prieto J, Rust C, Geenes VL, Williamson C, Moolenaar WH, Beuers U & Oude Elferink RP (2010). Lysophosphatidic acid is a potential mediator of cholestatic pruritus. Gastroenterology 139, 1008–1018. [DOI] [PubMed] [Google Scholar]
- Kukkonen JP (2011). A ménage à trois made in heaven: G‐protein‐coupled receptors, lipids and TRP channels. Cell Calcium 50, 9–26. [DOI] [PubMed] [Google Scholar]
- Kuraishi Y, Yageta Y, Konno M, Andoh T, Yamaguchi‐Miyamoto T & Nojima H (2008). Intracisternal, but not intrathecal, injection of naloxone inhibits cutaneous itch‐related response in mice. Biol Pharm Bull 31, 2143–2145. [DOI] [PubMed] [Google Scholar]
- Lee CW, Rivera R, Gardell S, Dubin AE & Chun J (2006). GPR92 as a new G12/13‐ and Gq‐coupled lysophosphatidic acid receptor that increases cAMP, LPA5. J Biol Chem 281, 23589–23597. [DOI] [PubMed] [Google Scholar]
- Lieu T, Jayaweera G, Zhao P, Poole DP, Jensen D, Grace M, McIntyre P, Bron R, Wilson YM, Krappitz M, Haerteis S, Korbmacher C, Steinhoff MS, Nassini R, Materazzi S, Geppetti P, Corvera CU & Bunnett NW (2014). The bile acid receptor TGR5 activates the TRPA1 channel to induce itch in mice. Gastroenterology 147, 1417–1428. [DOI] [PMC free article] [PubMed] [Google Scholar]
- Liu T & Ji RR (2013). New insights into the mechanisms of itch: are pain and itch controlled by distinct mechanisms? Pflugers Arch 465, 1671–1685. [DOI] [PMC free article] [PubMed] [Google Scholar]
- Morita T, McClain SP, Batia LM, Pellegrino M, Wilson SR, Kienzler MA, Lyman K, Olsen AS, Wong JF, Stucky CL, Brem RB & Bautista DM (2015). HTR7 mediates serotonergic acute and chronic itch. Neuron 87, 124–138. [DOI] [PMC free article] [PubMed] [Google Scholar]
- Nieto‐Posadas A, Picazo‐Juárez G, Llorente I, Jara‐Oseguera A, Morales‐Lázaro S, Escalante‐Alcalde D, Islas LD & Rosenbaum T (2012). Lysophosphatidic acid directly activates TRPV1 through a C‐terminal binding site. Nat Chem Biol 8, 78–85. [DOI] [PubMed] [Google Scholar]
- Nilius B, Owsianik G & Voets T (2008). Transient receptor potential channels meet phosphoinositides. EMBO J 27, 2809–2816. [DOI] [PMC free article] [PubMed] [Google Scholar]
- Paulsen CE, Armache, JP , Gao Y, Cheng Y & Julius D (2015). Structure of the TRPA1 ion channel suggests regulatory mechanisms. Nature 520, 511–517. [DOI] [PMC free article] [PubMed] [Google Scholar]
- Rohacs T, Thyagarajan B & Lukacs V (2008). Phospholipase C mediated modulation of TRPV1 channels. Mol Neurobiol 37, 153–163. [DOI] [PMC free article] [PubMed] [Google Scholar]
- Rothman S (1941). Physiology of itching. Physiol Rev 21, 357–381. [Google Scholar]
- Selvy PE, Lavieri RR, Lindsley CW & Brown HA (2011). Phospholipase D: enzymology, functionality, and chemical modulation. Chem Rev 111, 6064–6119. [DOI] [PMC free article] [PubMed] [Google Scholar]
- Shim WS, Tak MH, Lee MH, Kim M, Kim M, Koo JY, Lee CH, Kim M & Oh U (2007). TRPV1 mediates histamine‐induced itching via the activation of phospholipase A2 and 12‐lipoxygenase. J Neurosci 27, 2331–2337. [DOI] [PMC free article] [PubMed] [Google Scholar]
- Shimada SG & LaMotte RH (2008). Behavioral differentiation between itch and pain in mouse. Pain 139, 681–687. [DOI] [PMC free article] [PubMed] [Google Scholar]
- Story GM, Peier AM, Reeve AJ, Eid SR, Mosbacher J, Hricik TR, Earley TJ, Hergarden AC, Andersson DA, Hwang SW, McIntyre P, Jegla T, Bevan S & Patapoutian A (2003). ANKTM1, a TRP‐like channel expressed in nociceptive neurons, is activated by cold temperatures. Cell 112, 819–829. [DOI] [PubMed] [Google Scholar]
- Suh BC & Hille B (2008). PIP2 is a necessary cofactor for ion channel function: how and why? Annu Rev Biophys 37, 175–195. [DOI] [PMC free article] [PubMed] [Google Scholar]
- Takahashi N, Hamada‐Nakahara S, Itoh Y, Takemura K, Shimada A, Ueda Y, Kitamata M, Matsuoka R, Hanawa‐Suetsugu K, Senju Y, Mori MX, Kiyonaka S, Kohda D, Kitao A, Mori Y & Suetsugu S (2014). TRPV4 channel activity is modulated by direct interaction of the ankyrin domain to PI(4,5)P2 . Nat Commun 5, 4994. [DOI] [PubMed] [Google Scholar]
- Thomson FJ & Clark MA (1995). Purification of a phosphatidic‐acid‐hydrolysing phospholipase A2 from rat brain. Biochem J 306, 305–309. [DOI] [PMC free article] [PubMed] [Google Scholar]
- Tigyi G (2010). Aiming drug discovery at lysophosphatidic acid targets. Br J Pharmacol 161, 241–270. [DOI] [PMC free article] [PubMed] [Google Scholar]
- Weng HJ, Patel KN, Jeske NA, Bierbower SM, Zou W, Tiwari V, Zheng Q, Tang Z, Mo GC, Wang Y, Geng Y, Zhang J, Guan Y, Akopian AN & Dong X (2015). Tmem100 is a regulator of TRPA1–TRPV1 complex and contributes to persistent pain. Neuron 85, 833–846. [DOI] [PMC free article] [PubMed] [Google Scholar]
- Wilson SR, Gerhold KA, Bifolck‐Fisher A, Liu Q, Patel KN, Dong X & Bautista DM (2011). TRPA1 is required for histamine‐independent, Mas‐related G protein‐coupled receptor‐mediated itch. Nat Neurosci 14, 595–602. [DOI] [PMC free article] [PubMed] [Google Scholar]
- Wilson SR, Thé L Batia LM, Beattie K, Katibah GE, McClain SP, Pellegrino M, Estandian DM & Bautista DM (2013). The epithelial cell‐derived atopic dermatitis cytokine TSLP activates neurons to induce itch. Cell 155, 285–295. [DOI] [PMC free article] [PubMed] [Google Scholar]
- Woo DH, Jung SJ, Zhu MH, Park CK, Kim YH, Oh SB & Lee CJ (2008). Direct activation of transient receptor potential vanilloid 1 (TRPV1) by diacylglycerol (DAG). Mol Pain 4, 42. [DOI] [PMC free article] [PubMed] [Google Scholar]
- Wu LJ, Sweet TB & Clapham DE (2010). International Union of Basic and Clinical Pharmacology. LXXVI. Current progress in the mammalian TRP ion channel family. Pharmacol Rev 62, 381–404. [DOI] [PMC free article] [PubMed] [Google Scholar]
- Zhang X (2015). Targeting TRP ion channels for itch relief. Naunyn Schmiedebergs Arch Pharmacol 388, 389–399. [DOI] [PubMed] [Google Scholar]