Abstract
Key points
Late gestation during pregnancy has been associated with a relatively high prevalence of obstructive sleep apnoea (OSA).
Intermittent hypoxia, a hallmark of OSA, could impose significant long‐term effects on somatic growth, energy homeostasis and metabolic function in offspring.
Here we show that late gestation intermittent hypoxia induces metabolic dysfunction as reflected by increased body weight and adiposity index in adult male offspring that is paralleled by epigenomic alterations and inflammation in visceral white adipose tissue.
Fetal perturbations by OSA during pregnancy impose long‐term detrimental effects manifesting as metabolic dysfunction in adult male offspring.
Abstract
Pregnancy, particularly late gestation (LG), has been associated with a relatively high prevalence of obstructive sleep apnoea (OSA). Intermittent hypoxia (IH), a hallmark of OSA, could impose significant long‐term effects on somatic growth, energy homeostasis, and metabolic function in offspring. We hypothesized that IH during late pregnancy (LG‐IH) may increase the propensity for metabolic dysregulation and obesity in adult offspring via epigenetic modifications. Time‐pregnant female C57BL/6 mice were exposed to LG‐IH or room air (LG‐RA) during days 13–18 of gestation. At 24 weeks, blood samples were collected from offspring mice for lipid profiles and insulin resistance, indirect calorimetry was performed and visceral white adipose tissues (VWAT) were assessed for inflammatory cells as well as for differentially methylated gene regions (DMRs) using a methylated DNA immunoprecipitation on chip (MeDIP‐chip). Body weight, food intake, adiposity index, fasting insulin, triglycerides and cholesterol levels were all significantly higher in LG‐IH male but not female offspring. LG‐IH also altered metabolic expenditure and locomotor activities in male offspring, and increased number of pro‐inflammatory macrophages emerged in VWAT along with 1520 DMRs (P < 0.0001), associated with 693 genes. Pathway analyses showed that genes affected by LG‐IH were mainly associated with molecular processes related to metabolic regulation and inflammation. LG‐IH induces metabolic dysfunction as reflected by increased body weight and adiposity index in adult male offspring that is paralleled by epigenomic alterations and inflammation in VWAT. Thus, perturbations to fetal environment by OSA during pregnancy can have long‐term detrimental effects on the fetus, and lead to persistent metabolic dysfunction in adulthood.
Keywords: epigenetics, gestation, intermittent hypoxia, metabolic syndrome, methylation, sleep apnea
Key points
Late gestation during pregnancy has been associated with a relatively high prevalence of obstructive sleep apnoea (OSA).
Intermittent hypoxia, a hallmark of OSA, could impose significant long‐term effects on somatic growth, energy homeostasis and metabolic function in offspring.
Here we show that late gestation intermittent hypoxia induces metabolic dysfunction as reflected by increased body weight and adiposity index in adult male offspring that is paralleled by epigenomic alterations and inflammation in visceral white adipose tissue.
Fetal perturbations by OSA during pregnancy impose long‐term detrimental effects manifesting as metabolic dysfunction in adult male offspring.
Abbreviations
- DMR
differentially methylated region
- HOMA‐IR
homeostatic model assessment of insulin resistance
- IH
intermittent hypoxia
- IPA
ingenuity pathways analysis
- LG
late gestation
- LG‐IH
late gestation–intermittent hypoxia
- LG‐RA
late gestation–room air
- MAT
model‐based analysis of tilling arrays
- OSA
obstructive sleep apnoea
- RA
room air
- RER
respiratory exchange ratio
- SC
sleep control
- SDB
sleep disordered breathing
- SF
sleep fragmentation
carbon dioxide production
oxygen consumption
- VWAT
visceral white adipose tissue
Introduction
Human health is a highly modifiable state throughout the life span, starting with conception proceeding all the way to adulthood. Obesity has emerged as one of the world's greatest public health challenges in the past decades, and has been shown to impose substantial morbidity and mortality in the form of the metabolic syndrome or its components (Guh et al. 2009; Leon & Maddox, 2015). However, the obesity epidemic may not simply be a consequence of poor dietary habits or sedentary lifestyle, and may involve a number of other environmental and lifestyle factors, such as sleep patterns (Keith et al. 2006).
The environment experienced in utero not only determines the growth trajectory of the fetus, but also contributes to disease susceptibility in later life (Barker, 1995). The Developmental Origins of Health and Disease theory suggests that there are critical periods during perinatal life in which maternal nutrition and other environmental factors can program changes that will affect the offspring, and influence its susceptibility to metabolic disease during adulthood (Martinez et al. 2012; Rinaudo & Wang, 2012; Zou et al. 2012; Blackmore & Ozanne, 2013). However, the mechanisms by which early environmental insults can impose long‐term effects on offspring through epigenetic modifications remain poorly defined (Reynolds et al. 2015).
Epidemiological data and animal models have revealed that imbalanced nutrition during gestation or early postnatal life promotes the risk of type 2 diabetes and hypertension, possibly via metabolic reprogramming of the fetus and neonate (Barker et al. 2007; Armitage et al. 2008; Murabayashi et al. 2013). Furthermore, perturbations during gestation can increase the risk of morbidity and mortality from cardiovascular and metabolic diseases in adult life (Barker, 2007; Gluckman et al. 2007; Ananth & Vintzileos, 2009). For example, changes in maternal diet lead to altered metabolism and body composition in the adult offspring (Bateson et al. 2004; Tamashiro & Moran, 2010; Khalyfa et al. 2013). Pregnancy is associated with significant hormonal, biochemical and physical alterations that may affect sleep duration and continuity, particularly during the third trimester (O'Keeffe & St‐Onge, 2013). In this context, there is a marked increase in the risk of developing sleep‐disordered breathing (SDB) (Bourjeily et al. 2011; O'Brien et al. 2013; Ravishankar et al. 2015). Indeed, during the third trimester of pregnancy, marked increases in the frequency of snoring, disturbed sleep, daytime tiredness, decreased daytime alertness and poor sleep quality are reported in approximately one‐third of all pregnancies (Izci et al. 2005; Frederick et al. 2013; Izci Balserak et al. 2013; Reichmann, 2013; Facco, 2014), and the presence of gestational SDB is associated with pregnancy‐related complications such as pulmonary hypertension, pre‐eclampsia, and gestational diabetes mellitus (Edwards et al. 2002; Champagne et al. 2009). The hallmark features of obstructive sleep apnoea (OSA), the clinically relevant form of SDB, include sleep fragmentation (SF) and intermittent hypoxia (IH). In previous studies, we examined the effects of SF during late gestation (LG‐SF), and found that LG‐SF mimicking SDB promoted marked increases in the risk for metabolic syndrome in adult offspring along with distinct epigenetic alterations in target organs (Khalyfa et al. 2014; Cortese et al. 2015; Mutskov et al. 2015). However, the effects of IH during late gestation (LG‐IH) were not examined. Offspring of pregnant rats exposed to LG‐IH manifest lower birth weight and an increased propensity for higher body weight later in life when compared with offspring of pregnant rats exposed to normal oxygen levels of room air (LG‐RA; Gozal et al. 2003). Although several studies have evaluated the association between SDB symptoms in pregnancy and adverse fetal outcomes, all of these studies were specifically circumscribed to the immediate postnatal period, and did not explore long‐term consequences of SDB during gestation (Bourjeily et al. 2011, 2013; Xu et al. 2014; Pamidi et al. 2015). We therefore hypothesized that LG‐IH may induce an increased propensity for metabolic dysregulation and obesity in the adult offspring via epigenetic modifications. Our aim was to examine the effects of LG‐IH on somatic growth, metabolic rate, serum lipids, insulin sensitivity and methylation changes in the visceral white adipose tissue (VWAT) of adult offspring mice.
Methods
Animal experiments
All experiments were approved by the University of Chicago's animal care committee (IACUC protocol no. 72169). Male and virgin female C57BL/6J mice (3 months of age) were purchased from The Jackson Laboratory (Bar Harbor, ME, USA) for breeding. After arrival, all animals were allowed to recover within the animal care facility for 7 days. Animals were fed with normal chow diet and were housed in a controlled environment with 12 h light–dark cycles (07.00 h–19.00 h) at constant temperature (24 ± 0.2°C) with ad libitum access to food and water. At the end of the experimental period, the mice underwent brief anaesthesia using carbon dioxide (1–2 min) and were killed immediately by cervical dislocation. The abdominal cavity was surgically opened and white (visceral) adipose tissue was dissected from the epididymis within < 5 min, immediately frozen in liquid nitrogen, and stored at −80°C until RNA extraction. All efforts were made to minimize animal suffering and to reduce the number of animals used.
Late gestational intermittent hypoxia
Mice were used for breeding to generate only one generation. Male mice were removed once inspection of the female revealed the presence of a copulation plug, considered as corresponding to day 1 of gestation. Following 13 days of pregnancy, mice were divided into two groups: (1) late gestation–room air (LG‐RA) pregnant mice were housed in standard housing conditions, and (2) late gestation–intermittent hypoxia (LG‐IH) pregnant mice were exposed to IH for 5 days (days 13–18 of gestation). IH consisted of exposures alternating 21% and 6.1% , 20 cycles h−1 for 12 h day−1 during daylight using a commercially available environmental system (80 × 50 × 50 cm; Oxycycler A44XO, BioSpherix, Redfield, NY, USA), as previously reported (Kheirandish et al. 2005; Xu et al. 2009; Li et al. 2011; Nair et al. 2011). The rest of the day (19.00 h–07.00 h), the mice were in normoxic conditions (21% ).
Offspring and body weight
Upon delivery, all litters were immediately culled to six pups. During lactation, mothers were fed with regular low fat chow diet and pups were kept with their mothers until weaning, at which time, male and female offspring were placed in individual cages, had unrestricted access to water and regular chow diet, and were housed in standard conditions in a temperature‐controlled room (24 ± 2°C) with 12:12 h light–dark cycles (lights on at 07.00 h). All animals were periodically monitored for signs of morbidity, mortality and ruffled fur. Body weight and food intake were measured weekly at the same time of the day (09.00 h). Food intake was calculated as the difference between food offered and food recovered from each of the cages at the end of each week. We used 10–12 female mice to generate litters, and each female gave birth to three to five offspring male. For body weights, the total number of males was 24–26 offspring mice, and of females 20 offspring. For each individual experiment we used 6–8 mice per group corresponding to the same number of litters. In general, only one male and one female (when appropriate) were used from each litter for each of the experiments described below.
Metabolic assessments
Energy expenditure was determined by indirect calorimetry using a TSE LabMaster metabolic cage system (TSE Systems, Chesterfield, MO, USA) after 3 days of acclimation. Mice were then monitored for four consecutive days to measure metabolic rate, mouse movement, as well as food and water intake as previously described (Savic et al. 2011). Indirect calorimetric measurements were carried out, whereby the gas inlet to and outlet from the sealed mouse cage were connected to the standard LabMaster System (TSE Systems, Midland, MI, USA) to allow monitoring of oxygen consumption (), CO2 production (), respiratory exchange ratio (RER) and heat production. Metabolic rate, expressed as oxygen consumption, , was normalized to body weight (ml h–1 kg−1). Locomotor activity was monitored through an automatic device using small infrared sensors positioned on the top of each cage. The sensors detected any movement of mice with a frequency of 20 events s–1 (20 Hz). Average scores obtained during 60 min intervals were expressed as counts per hour. The data were averaged for each mouse and then for each treatment group.
Plasma measurements
Mice were fasted for 3 h and blood was collected in vacutainer tubes containing EDTA (Becton Dickinson, Franklin Lakes, NJ, USA), and immediately centrifuged at 2000 g for 20 min at 4°C; subsequently, plasma was centrifuged for 5 min at 50,000 g and frozen at −80°C until further analysis. Plasma insulin, leptin and adiponectin levels were measured using enzyme‐linked immunosorbent assay kits (Millipore, Billerica, MA, USA) according to the manufacturer's protocol. Lipid profiles including total cholesterol and triglycerides were determined using Infinity kits (Thermo Scientific, Pittsburgh, PA, USA). For the insulin assay, the appropriate range of the assay was 0.2–10 ng ml−1, with the limit of sensitivity at 0.2 ng ml−1, and intra‐ and interassay variations at 3.73% and 10.52%, respectively, within the assay range. For the leptin assay, the appropriate range was 0.2–30 ng ml−1, with the sensitivity threshold at 0.05 ng ml−1, and intra‐ and interassay variations at 1.49% and 3.85%, respectively, within the assay range. For the adiponectin assay, the appropriate range was 1–50 ng ml−1, with the sensitivity threshold at 0.2 ng ml−1, and intra‐ and interassay variations at 5.75% and 5.98%, respectively, within the assay range.
Flow cytometry
Visceral white adipose tissues (VWAT) were harvested and minced in Krebs–Ringer bicarbonate buffer supplemented with 1% bovine serum albumin and incubated with collagenase (1 mg ml−1; Worthington Biochemical Corp., Lakewood, NJ, USA) at 37°C for 45 min with shaking. Cell suspensions were filtered through a 100 μm mesh and centrifuged at 500 g for 5 min to separate floating adipocytes from the stromal vascular fraction pellet. These pellets were then re‐suspended in fluorescence‐activated cell sorting buffer (phosphate‐buffered saline plus 2% fetal bovine serum) and 105 cells were used for staining with fluorescence conjugate for macrophage markers – CD11b, F4/80, Ly6c, CD36 and CD64 or control IgGs at 4°C for 30 min. Cells were then washed twice and analysed with a flow cytometer (Canto II; BD Biosciences, San Jose, CA, USA). Data analysis was performed using the FlowJo software (Tree Star, Ashland, OR, USA). Adipose tissue macrophages were defined as F4/80+ and CD11b+ cells, from which M1 and M2 macrophages were identified as CD11c+ or CD206+ cells, respectively. Resident macrophages were defined as F4/80+ CD11b+ CD64hi, and monocyte‐derived infiltrated macrophages were defined as F4/80+ and CD11b+ Ly6chi. All antibodies were from Biolegend (San Diego, CA, USA).
DNA methylation profiling and microarray analysis
DNA methylation profiling was conducted as previously described (Cortese et al. 2015). The sample set for the DNA methylation analysis consisted of eight mice per group, representing a subset of randomly selected male mice out of the sample set used for the phenotype assessment (n = 24–26 mice per group). Briefly, the methylated fraction of the genome was immunoprecipitated from DNA isolated from epididymal VWAT using the methylated DNA immunoprecipitation (MeDIP) protocol, amplified using an adaptor mediated PCR strategy, and subsequently fragmented, biotin‐labelled, and hybridized on Affymetrix GeneChip Mouse Promoter Array 1.0R (Affymetrix, Santa Clara, CA, USA). Microarrays were scanned and raw data (.cel files) were imported into Partek Genomic Suite Software, version 6.6 (Partek Inc., St Louis, MO, USA) and pre‐processed with probe sequence adjustment, robust multichip averaging (RMA) background correction, quantile normalization and log2 transformation. The Model‐based Analysis of Tilling‐arrays (MAT) (Johnson et al. 2006) algorithm was used to detect differentially methylated regions (DMRs) at a sliding window of fixed genomic length (500 bp), requiring at least 10 probes present in a window. Networks and pathways significantly enriched in the genes of interest were identified through Ingenuity Pathways Analysis (IPA) (Ingenuity Systems, Redwood City, CA, USA; www.ingenuity.com). Statistical analyses were further performed using R statistical environment (version 3.2.2). The data generated in this study have been deposited in the NCBI's Gene Expression Omnibus (GEO) with accession number GSE76388.
Microarray data at the Pparg locus were verified by SYBR‐Green‐based real‐time PCR analysis of the adaptor‐mediated PCR products from the MeDIP samples (LG‐IH and LG‐RA groups), using the assays and conditions previously described (Cortese et al. 2015). A fragment within the Actb locus was used as calibrator. Adaptor‐mediated PCR products from the input fractions were used as reference to calculate the IP/INPUT enrichment for the target (IP/IN target) and the calibrator (IP/IN calibrator) loci. Fold change enrichment (FCE) was calculated using the equation: FCE = 2–(IP/INtarget–IP/INcalibrator).
Total RNA extraction and quantitative qRT‐PCR
Total RNA from VWAT was isolated using automated RNA extraction (Promega, Madison, WI, USA) according to manufacturer's protocol. The RNA quality and integrity were determined using the Eukaryote Total RNA Nano 6000 LabChip assay (Agilent Technologies, Santa Clara, CA, USA) utilizing the Agilent 2100 Bioanalyzer. Quantitative reverse transcription–polymerase chain reaction (qRT‐PCR) gene expression assays (TaqMan; Applied Biosystems, Foster City, CA, USA) were performed using TaqMan gene expression. Adiponectin and leptin gene expression was assessed by qRT‐PCR using high‐capacity RNA to complementary DNA (cDNA) Master Mix (Applied Biosystems) and TaqMan PCR Master Mix (Applied Biosystems). Reverse transcription of total RNA was conducted with TaqMan reverse transcription reagents RT‐PCR kit according to the manufacturer's instructions (Applied Biosystems). Reaction conditions consisted of pre‐incubation at 50°C for 2 min and 95°C for 10 min, followed by 40 cycles of 95°C for 15 s and 60°C for 1 min. cDNA was synthesized using one 500 ng sample of total RNA from visceral fat using a High‐Capacity cDNA Archive Kit (Applied Biosystems). Ribosomal 18S rRNA, was used as a reference gene to normalize the expression ratios. All experiments were performed in triplicates. The mean cycle number (C t) values of the 18S C t and the gene of interest C t were calculated. The relative expression of the gene of interest was calculated using the method.
Data analysis
All data are reported as the mean ± SEM. Comparisons of numerical data among LG‐IH and LG‐RA conditions were performed using one‐way ANOVA followed by Student's unpaired t test with Bonferroni correction or using Student's unpaired t test as appropriate. For all comparisons, a P‐value < 0.05 was considered as statistically significant.
Results
LG‐IH effects on body weight, metabolic parameters and adipokines
At birth, there were no significant differences in the mean body weights of LG‐IH and LG‐RA offspring mice (Fig. 1 A), and the litter sizes were similar between the two groups. However, at 24 weeks of age, LG‐IH male mice exhibited increased body weight (P = 0.004), and food intake (P = 0.0001; Fig. 1 B). The differences in body weight emerged around week 11–12 after birth in LG‐IH‐exposed males, but were absent altogether in LG‐IH female offspring at both 12 weeks (LG‐RA: 17.31 ± 0.23 g vs. LG‐RA: 17.62 ± 0.32 g, P > 0.05) and at 24 weeks of age (LG‐RA: 20.56 ± 0.27 g vs. LG‐RA: 21.85 ± 0.49 g, P > 0.05). Visceral and subcutaneous (Sub) fat adipose tissue compartment weights are shown in Table 1. Male LG‐IH mice exhibited higher visceral and subcutaneous masses compared with LG‐RA (VWAT: P = 0.001; Sub: P = 0.003). However, there were no significant differences in adipose tissue depots among female groups (Table 1). The adiposity index, which is calculated as the sum of the weights of various fat depots (visceral or epididymal, subcutaneous, perirenal and mesenteric fats), and is expressed as a percentage of body weight, was also significantly increased in LG‐IH male mice (5.1 ± 0.64) compared with LG‐RA male mice (3.2 ± 0.42, P = 0.005), but no differences were detected in female offspring mice (1.61 ± 0.14 in LG‐IH vs. 1.54 ± 0.13 in LG‐RA; P = 0.36; Table 1). Two‐way analysis of variance showed significant two‐way interactions of gender × treatment (F = 12.33, P < 0.001).
Figure 1. LG‐IH in utero during late gestation leads to increased body weight and food intake in offspring mice.
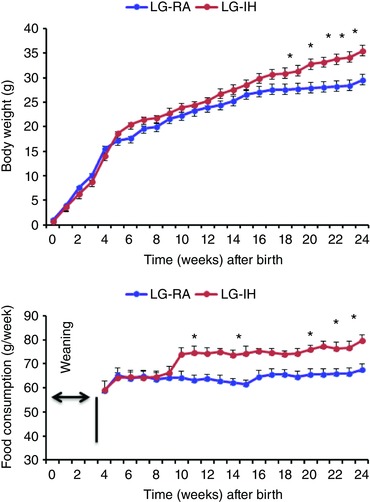
Body weight from birth to 24 weeks of age (A) and food consumption (B) in male offspring mice exposed to LG‐IH or LG‐RA (n = 12/experimental group representing 6–8 different litters). * P = 0.0004 for body weight (expressed in g); * P = 0.0001 for food intake (expressed in g week−1). There were no differences among female mice exposed to LG‐IH or LG‐RA (data not shown). Data are means ± SEM (n = 12/experimental group). [Color figure can be viewed at wileyonlinelibrary.com]
Table 1.
Fat mass, metabolic parameters and adipokines plasma and mRNA expression following LG‐RA and LG‐IH exposures among offspring mice at 24 weeks of age
| Male | Male | Female | Female | |||
|---|---|---|---|---|---|---|
| LG‐RA | LG‐IH | P | LG‐RA | LG‐IH | P | |
| Visceral fat (mg) | 520 ± 5.76 | 982 ± 9.32 | 0.001 | 243.13 ± 43.51 | 250.05 ± 72.83 | 0.74 |
| Subcutaneous fat (mg) | 264 ± 7.16 | 558 ± 8.21 | 0.003 | 134.51 ± 52 | 132.88 ± 32.95 | 0.93 |
| Adiposity index (%) | 3.2 ± 0.42 | 5.1 ± 0.64 | 0.005 | 1.54 ± 0.13 | 1.61 ± 0.14 | 0.36 |
| Triglycerides (mg dl−1) | 84 ± 2.12 | 93 ± 5.46 | 0.002 | 81.3 ± 2.2 | 82.2 ± 2.4 | 0.87 |
| Cholesterol (mg dl−1) | 88 ± 2.31 | 118 ± 5.91 | 0.004 | 86.7 ± 2.6 | 88.1 ± 2.9 | 0.94 |
| HOMA‐IR | 6.0 ± 0.85 | 11 ± 1.24 | 0.001 | 4.2 ± 0.32 | 4.4 ± 0.39 | 0.16 |
| Plasma adiponectin (μg ml−1) | 27 ± 1.87 | 21 ± 1.24 | 0.02 | |||
| Plasma leptin (ng ml−1) | 2.8 ± 0.24 | 4.2 ± 0.87 | 0.01 | |||
| mRNA adiponectin (fold of LG‐RA in VWAT) | 1.00 ± 0.14 | −1.62 ± 0.26 | 0.004 | |||
| mRNA leptin (fold of LG‐RA in VWAT) | 1.00 ± 0.18 | 2.46 ± 0.54 | 0.006 |
At 24 weeks of age, LG‐IH male mice exhibited higher homeostatic model assessment of insulin resistance (HOMA‐IR) values compared with LG‐RA mice (P = 0.001; Table 1). However, no evidence of insulin resistance was apparent among female LG‐IH offspring mice (Table 1).
Total cholesterol levels were significantly higher in LG‐IH male mice (P = 0.004), and triglyceride serum levels were also elevated (P = 0.002) compared with LG‐RA (Table 1), while such findings were not apparent in female offspring (Table 1). Taken together, these data indicate that maternal LG‐IH imposes significant metabolic effects on male, but not on female, offspring by the time they reach adulthood. Therefore, we restricted all subsequent assessments to male offspring mice.
Plasma fasting leptin concentrations were higher also in LG‐IH males (P = 0.004), and conversely adiponectin levels were markedly lower (P = 0.01; Table 1). Gene expression patterns in VWAT using qRT‐PCR for leptin, and adiponectin are shown in Table 1. Concordant with plasma levels, VWAT leptin expression was increased (P = 0.004), and adiponectin was decreased (P = 0.006; Table 1).
Next, we used indirect calorimetry to estimate energy metabolic patterns among male offspring mice by measuring oxygen consumption, heat production and locomotor activity (Table 2; Fig. 2). In LG‐IH mice, dietary intake during the dark cycle was significantly increased compared with LG‐RA mice (P = 0.02). The locomotor activities of LG‐IH, either in XT or Z directions, were significantly decreased in both light and dark cycles (Table 2). LG‐IH male mice also exhibited reduced over a 24 h period (Fig. 2). However, no significant differences emerged in the respiratory exchange ratio (RER) (Table 2).
Table 2.
LG‐IH exposures alter metabolic activity and ingestive activity for LG‐IH exposed mice when compared with LG‐RA mice, as indicated by indirect colorimetry measurements for four consecutive days
| Light/dark cycles | LG‐RA | LG‐IH | P | |
|---|---|---|---|---|
| Food (g (12 h)–1) | Light cycle | 0.67 ± 0.05 | 0.95 ± 0.09 | NS |
| Dark cycle | 2 ± 0.17 | 2.21 ± 0.17 | 0.02 | |
| Water (g (12 h)–1) | Light cycle | 0.69 ± 0.12 | 0.71 ± 0.12 | NS |
| Dark cycle | 1.76 ± 0.12 | 1.96 ± 0.10 | NS | |
| XT (counts) | Light cycle | 21078 ± 1461 | 13187 ± 785 | 0.001 |
| Dark cycle | 49028 ± 3758 | 29994 ± 2497 | 0.002 | |
| Z (counts) | Light cycle | 2770 ± 462 | 1001 ± 271 | 0.007 |
| Dark cycle | 7178 ± 1500 | 2955 ± 473 | 0.017 | |
| RER | Light cycle | 0.76 ± 0.01 | 0.8 ± 0.01 | NS |
| Dark cycle | 0.87 ± 0.01 | 0.88 ± 0.01 | NS |
XT and Z counts represent crossing events on the horizontal and vertical planes, respectively.
Figure 2. LG‐IH exposures in utero significantly alter metabolic activity including oxygen consumption at 24 weeks of age.
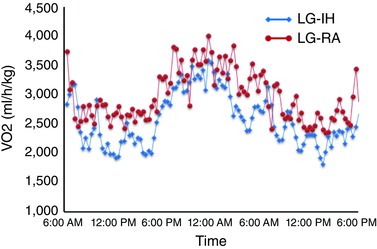
Average tracings shown for n = 8/experimental group. [Color figure can be viewed at wileyonlinelibrary.com]
VWAT macrophage populations
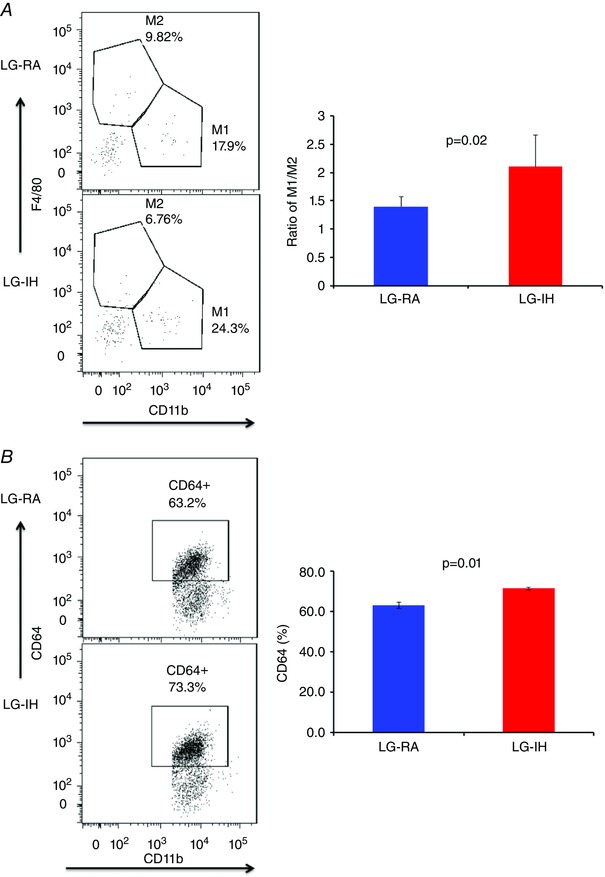
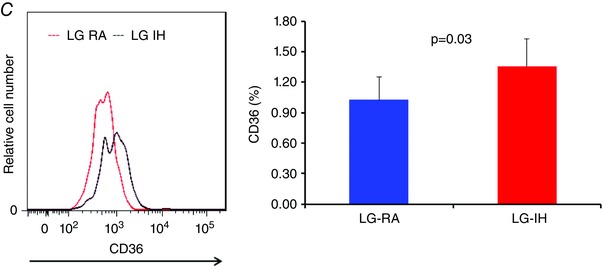
Flow cytometric analyses for the presence of macrophages and their polarity are shown in Fig. 3. We found that male mice exposed to LG‐IH exhibit increased total numbers of macrophages in the VWAT compared with LG‐RA (Fig. 3 A; n = 8/experimental group; P = 0.003). Furthermore, LG‐IH exposures also induced shifts in the VWAT macrophage population toward a pro‐inflammatory phenotype. Indeed, the M1/M2 ratios were significantly increased in LG‐IH vs. LG‐RA (2.1 ± 0.4 vs. 1.4 ± 0.2; P = 0.02), and tissue‐resident macrophages were also more abundant in LG‐IH (73.3 ± 8.9% vs. 63.3 ± 7.9% in LG‐RA; P = 0.01; n = 8/group; Fig. 3 B). Of note, CD64 expression was higher in Ly6clo compared with Ly6chi cells, thus reinforcing the notion of two distinct macrophage populations. In addition, scavenger receptor CD36 expression was increased in the VWAT of LG‐IH mice (mean fluorescence intensity: 895 ± 65 vs. 724 ± 38; P = 0.03), as was the percentage of CD36+ macrophages 1.36 ± 0.38% vs. 1.03 ± 0.17%; P < 0.03; Fig. 3 C).
Figure 3.
At 24 weeks of age, changes in macrophage populations in VWAT of offspring mice exposed to LG‐IH or LG‐RA were examined using flow cytometry. Macrophages were defined as CD11b and F4/80 double positive cells. A, ratio of M1/M2 macrophages in VWAT (n = 12/group); B, VWAT resident macrophages (CD64+) illustrating the increase in bone‐marrow‐derived macrophages in LG‐IH mice; C, LG‐IH is associated with significantly increased expression of CD36 in CD11b and F4/80 positively labelled cells indicating a pro‐inflammatory metabolic phenotype (Kratz et al. 2014). Data are shown as means ± SEM (n = 12/experimental group).
LG‐IH exposures in utero alter macrophage populations in visceral fat.
LG‐IH alters methylation patterns in VWAT
Considering the clear differences found in metabolic parameters among LG‐IH and LG‐RA male mice, we next compared DNA methylation profiles in VWAT harvested from these two groups (n = 8 per group). Using methylated DNA immunoprecipitation coupled to microarrays (MeDIP‐chip), large‐scale DNA methylation profiles were generated. Microarrays underwent extensive quality control and no technical bias was detected after normalization and background correction (Fig. 4). All microarrays were included in the posterior analysis. For probe‐set level analysis we set a cut‐off value at P < 0.01. Samples in the same group exhibited higher correlation values than samples in opposite groups (Fig. 5 A). Principal component analysis of the probe‐level DNA methylation profiles showed two clear clusters of samples, one for the LG‐IH (red shape) and one for the LG‐RA group (blue shape), respectively. However, three samples belonging to the LG‐RA group (LG‐RA01, LG‐RA02 and LG‐RA08) positioned close to the LG‐IH samples (Fig. 5 B). To further identify distinctive DNA methylation profiles, we defined differentially methylated regions (DMRs) between the groups by combining adjacent probes showing statistically significant differential DNA methylation using the MAT algorithm (Johnson et al. 2006). By this approach, we identified 1520 DMRs (P = 0.0001, two‐way ANOVA), which clearly distinguished the LG‐IH and LG‐RA groups (Fig. 5 C). The number of DMRs showing increased DNA methylation in the LG‐IH group compared with the LG‐RA group (n = 338) was significantly lower than those showing decreased DNA methylation in the same comparison (n = 1182) (P = 2.2 × 10⁻¹⁶, odds ratio = 0.291, 95% CI: 0.256–0.330; Fisher's test) (Fig. 5 D). DMRs were associated with 693 genes (160 and 533 hyper‐ and down‐methylated in LG‐IH group compared with LG‐RA, supporting information, Table S1). DMRs showing increased DNA methylation in LG‐IH compared with the LG‐RA groups were significantly shorter (median length were 890 and 954.5 nucleotides, respectively; P = 9.26 × 10⁻⁶; Wilcoxon's rank sum test, Fig. 6 A) and contained significantly fewer probes (median number of probes were 24 and 25, respectively; P = 7.88 × 10⁻⁴; Wilcoxon's rank sum test, Fig. 6 B) than those showing decreased DNA methylation in the same comparison.
Figure 4. Diagnostic plots for microarray data quality control.
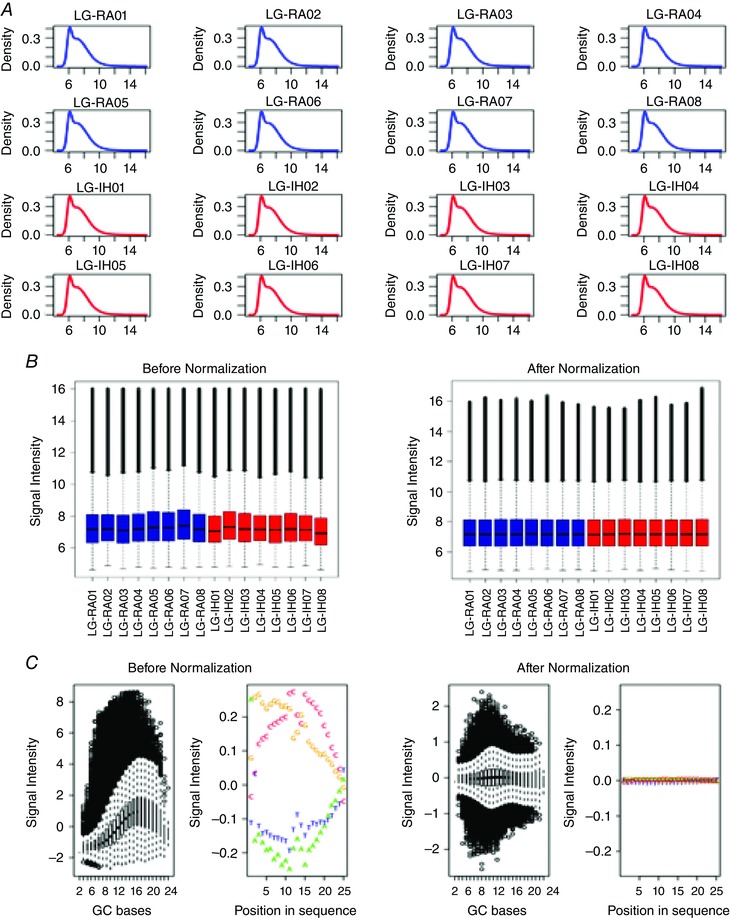
A, signal density plots for all the arrays in the analysis. Signal distribution for each microarray is indicated by blue and red curves for samples belonging to the LG‐IH and LG‐RA groups, respectively. Plots are based in the full probe data sets (n = 4,212,009 probes). B, distribution of microarray signal intensities before (left plot) and after (right plot) quantile normalization. Signal distribution for each microarray is indicated by blue and red boxes for samples belonging to the LG‐IH and LG‐RA groups, respectively. C, correction of signal intensity distribution biases by quantile normalization. Signal intensity distributions according to GC content and position in the sequence before (left plots) and after (right plots) quantile normalization is shown.
Figure 5. Microarray analysis of DNA methylation in VWAT samples.
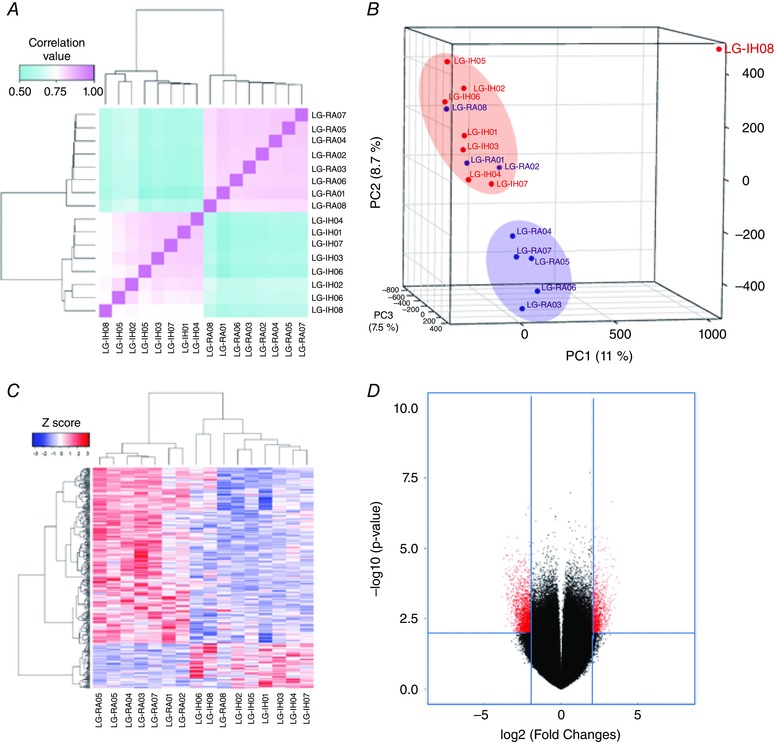
A, pairwise sample correlation heatmap. Probes with P = 0.01 were extracted from the ANOVA results and used for calculating Pearson's correlation coefficient between samples. Bidimensional unsupervised clustering was performed in samples from the LG‐IH and LG‐RA groups. Correlation coefficients are shown as a colour gradient ranging from light blue (0.5) over white (0.75) to light pink (1.0). B, multiple dimensional scaling plot of sample relationships. Principal component analysis was performed using microarray data from LG‐IH (red points) and LG‐RA (blue points) samples. Samples from the same group clustered together, with a few exceptions. Three principal components determine sample clustering: PC1 (11%, x‐axis), PC2 (7%, y‐axis) and PC3 (7%, z‐axis). C, unsupervised clustering of samples in the LG‐IH and LG‐RA groups based on DMR values. Samples are accommodated in columns and DMRs in rows. Z‐score depicting the DNA methylation differences between the groups (DMRs with increased DNA methylation in LG‐IH and LG‐RA groups had positive and negative values, respectively) are shown in a colour gradient ranging from blue (negative Z‐scores) to red (positive scores). D, volcano plot of microarray data. The x‐axis represents fold change differences between the groups, with coefficients expressed in the log2 scale. Samples with increased microarray signals in LG‐IH and LG‐RA groups had positive and negative coefficients, respectively. Probes showing differentially methylated values are shown in red. The y‐axis represents the –log10‐transformed P‐values. The horizontal dashed red line depicts the cut‐off values for the P‐value (–log10 (P < 0.05) = 1.3). The vertical dashed red lines depict the cut‐off values for the fold changes (log2 (4) = 2).
Figure 6. Distribution plots for differentially methylated regions.
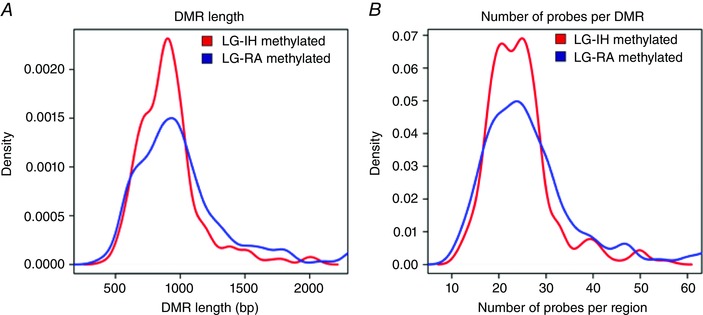
A, density plot of DMR lengths. DMRs with higher methylation in the LG‐IH group (red line) were significantly shorter than those with higher methylation in the LG‐RA group (blue line) (P = 9.26 × 10⁻⁶; Wilcoxon's rank sum test). B, density plots of number of probes per region. The number of probes per DMR was significantly lower in DMRs with increased DNA methylation in the LG‐IH (red line) than in the LG‐RA (blue line) group (P = 7.88 × 10⁻⁴; Wilcoxon's rank sum test). [Color figure can be viewed at wileyonlinelibrary.com]
Next, we sought sought to determine the cellular and molecular functions which might be affected by LG‐IH‐induced differential DNA methylation in VWAT. Using a bioinformatics approach (Ingenuity® Pathway Analysis (IPA), we cross‐referenced the list of DMRs with canonical pathways and identified gene networks that may relate the affected genes. In general, DMRs with higher DNA methylation in the LG‐IH group were associated with biochemical pathways related to energy production through amino acid and fatty acid metabolism (supporting information, Table S2). For example, methionine degradation, methylmalonyl, 2‐oxobutanoate degradation and cysteine biosynthesis pathways were overrepresented in DMRs with high methylation in the LG‐IH group. In turn, DMRs associated with higher DNA methylation in the LG‐IH group were associated with choline degradation and glutaryl‐CoA degradation pathways (supporting information, Table S2). In addition, Fig. 7 shows two examples of gene networks associated to the DMRs. DMRs with higher DNA methylation in the LG‐IH groups (Fig. 7 A) are mainly associated with molecules which participate in inflammatory response (i.e. BHLHE4D, FCGBP4, IFNA4, etc.) and many of them are related to signalling pathways such as IL‐4, ILK, NFκB and IL‐12 signalling pathways. DMRs with higher methylation in the LG‐RA (Fig. 7 B) group were mainly associated with molecules which participate in lipid metabolism (i.e. PLC, GPCR, RGS2, etc.) and many of them are related to phospholipase C, protein kinase A, Gαq signalling and peroxisome proliferator‐activated receptor (PPAR) α/retinoid X receptor α activation pathways.
Figure 7. Gene networks for DMR with higher methylation in the LG‐IH and LG‐RA groups.
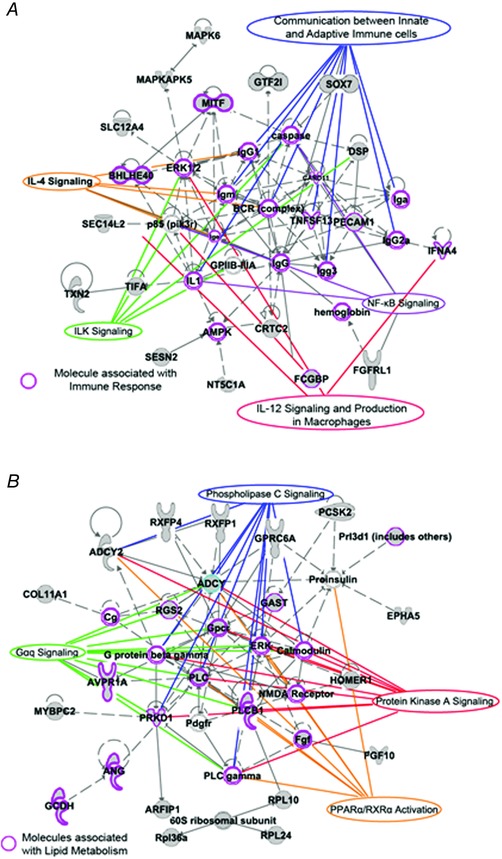
A, gene network corresponding to genes associated to DMRs exhibiting higher DNA methylation in the LG‐IH group compared with the LG‐RA group. Molecules associated with immune response are indicated by a purple shape. B, gene network corresponding to genes associated to DMRs exhibiting higher DNA methylation in the LG‐RA group compared with the LG‐IH group. Purple shapes indicate molecules associated with lipid metabolism. Networks were built using a bioinformatic tool (Ingenuity Pathway Analysis) based on databases relying on experimental evidence of gene functions. Canonical pathways (CP) related to those functions are indicated with labels.
In a previous work, we reported 2148 DMRs in VWAT associated with late gestational sleep fragmentation (LG‐SF), which corresponded to 762 genes. Moreover, using such DMR‐associated genes we built gene networks corresponding to lipid metabolism and inflammatory response (Cortese et al. 2015). Since SF and IH are the major hallmarks of OSA, we studied the extent of the overlap for changes in VWAT epigenetic profiles induced by both perturbations. Out of the 693 differentially methylated genes between the LG‐IH and LG‐RA groups, 162 exhibited differential methylation between the LG‐SF and LG‐SC groups as well, representing an significant overlap (P = 8.33 × 10−98, hypergeometric test). In the vast majority of the overlapped genes (n = 158; supporting information, Table S3) the direction of DNA methylation differences were concordant: genes showing increased or decreased DNA methylation in both LG‐IH and LG‐SF groups when compared with the LG‐RA and the LG‐SC group, respectively. In two of the genes showing opposite DNA methylation differences in LG‐IH/LG‐RA and LG‐SF/LG‐SC comparisons (Urgcp and Gm7361), the corresponding DMRs were located in different location across the genes, whereas in the two remaining genes (Mdga1 and Mapkapk5) the DMRs were partially overlapped (39.6% and 51.5% of the DMRs, respectively). To infer the functional relevance of the genes showing differential methylation‐associated LG‐IH and LG‐SF, as well as those that showed such a difference in only one of the groups, we built gene networks upon the list of intersected (Fig. 8) and non‐intersected (Fig. 9) genes. Functional gene networks were associated to inflammatory response and protein ubiquitination in genes with increased DNA methylation in both LG‐IH and LG‐SF groups when compared with LG‐SC/RA group (Fig. 8 A). In turn, networks associated to carbohydrate and lipid metabolism, as well as insulin receptor signalling and type 2 diabetes mellitus signalling, were identified in genes with decreased DNA methylation in the same comparison (Fig. 8 B). Amongst genes showing differential methylation between the LG‐SF and LG‐IH groups, we identified functional networks associated with adipogenesis pathways and transforming growth factor β (TGFβ) signalling in genes with increased DNA methylation in the LG‐IH group (Fig. 9 A), and networks associated with insulin receptor and PPAR signalling in genes with increased methylation in the LG‐SF group (Fig. 9 B). Taken together these results suggest that even when LG‐IH and LG‐SF may lead to an augmented inflammatory response and altered lipid metabolism, distinctive functional gene networks will be altered in each case.
Figure 8. Gene networks for DMRs with concordant differences in LG‐IH/LG‐RA and LG‐SF/LG‐SC comparisons.
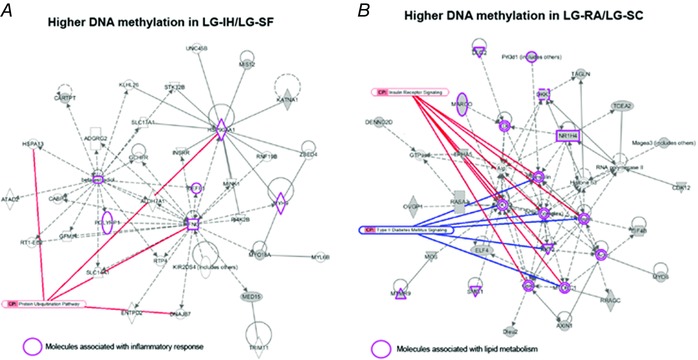
A, DMRs with higher methylation in the LG‐IH and LG‐SF groups; B, DMRs with higher methylation in the LG‐RA/SC groups. Gene networks were built as in Fig. 7. Purple shapes indicate molecules associated with inflammatory response and lipid metabolism in A and B, respectively.
Figure 9. Gene networks for DMRs with differential DNA methylation between the LG‐IH and LG‐SF groups.
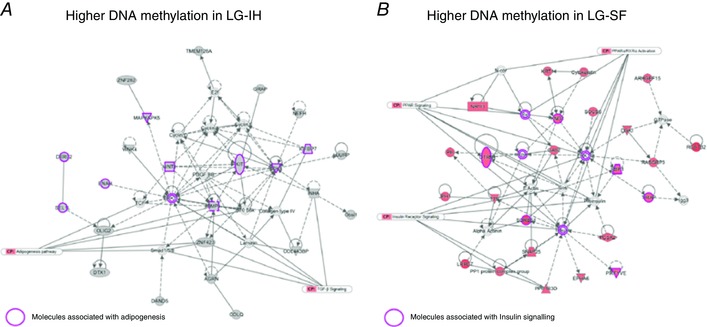
A, DMRs with higher methylation in the LG‐IH group; B, DMRs with higher methylation in the LG‐SF group. Gene networks were built as indicated in Fig. 7. Purple shapes indicate molecules associated with adipogenesis and insulin signalling in A and B, respectively.
One of the key genes in lipid metabolism and immune response in VWAT is the peroxisome proliferator‐activated receptor γ (Pparg). In a previous study, we showed that LG‐SF led to increased DNA methylation in the region surrounding the transcriptional start site (TSS) of the Pparg gene in the offspring VWAT samples, when compared with the control group (LG‐SC) (Cortese et al. 2015). In this study, we detected increased DNA methylation in the same region, in VWAT samples of the LG‐IH group compared with the LG‐RA group, although the significance level was lower than the stringent cut‐off set for DMR selection (P < 0.0001, two‐way ANOVA). To further verify the microarray results, we studied the DNA methylation at six regions of interest (ROI) (Cortese et al. 2015) associated to the TSS of the Pparg gene (Fig. 6), which we have previously shown as hypermethylated in VWAT samples from the LG‐SF group (Cortese et al. 2015). For all the six ROIs, DNA methylation in VWAT samples of the LG‐IH was significantly higher than in samples of the LG‐RA/SC group (P < 0.05, two‐tailed Student's t test). Moreover, DNA methylation in the LG‐IH samples was lower than those of the LG‐SF group (Fig. 10), although the differences were not statistically significant (P < 0.05, two‐tailed Student's t test).
Figure 10. Expression analysis of the Pparg locus.
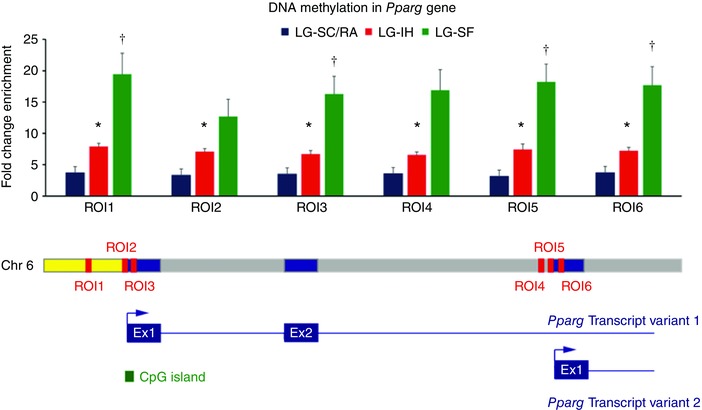
Single locus MeDIP‐qPCR results for the Pparg locus in VWAT samples in LG‐IH (red bars), LG‐SF (green bars) and LG‐RA/SC (blue bars) groups in candidate regions (ROI1–6). Fold change enrichment (FCE) values are shown in the y‐axis as the mean. Error bars corresponds to SEM. * P < 0.05, t test between the LG‐IH and LG‐RA/SC groups. † P > 0.05, t test between the LG‐SF and LG‐RA/SC groups. Lower panel depicts the position of the six ROIs in the Pparg locus in chromosome 6 and the two transcript variants. Exons, introns and the 5′‐UTR are represented as blue, grey and yellow boxes. ROI positions are marked in red. A CpG island associated with the 5′‐UTR is shown in green.
Discussion
In this study, we found that adult male, but not female, offspring of pregnant mice that were exposed to LG‐IH exhibited an altered phenotype manifesting as metabolic dysfunction during adulthood. This altered phenotype was characterized by increased body weight and food consumption along with reduced daily energy expenditure; increased adiposity index; increased insulin resistance and systemic elevations of lipid levels; altered macrophage populations in VWAT; and changes in DNA methylation patterns in VWAT. Accordingly, our findings provide a comprehensive picture of the adverse epigenetic and metabolic consequences associated with OSA during pregnancy in offspring, and expand our understanding of the potential significance of gestational sleep disorders on human health.
Increasing evidence from epidemiological studies and animal models illustrates how early life represents a window of phenotypic plasticity that is critically important for adulthood metabolic health (Gluckman et al. 2008; Burdge & Lillycrop, 2010; Aiken & Ozanne, 2014; Pembrey et al. 2014; Aiken et al. 2016; Padmanabhan et al. 2016). Thus, intrauterine environments can impose a significant long‐term influence on body weight, energy homeostasis and metabolic function in the offspring (Tamashiro & Moran, 2010; Entringer et al. 2012; Khalyfa et al. 2014). In this study, we used standard low‐fat chow diet in both pregnant mice and offspring mice after weaning, and thus focused our inquiry on the isolated effects of LG‐IH, rather than introduce additional dietary confounders. Additional precautions were implemented to randomize the culling process, such that gender distribution in litters would be a priori uncontrolled, and ascertained that inclusion of mice derived from multiple litters in each of the experiments would occur to further reduce the potential inclusion of biases that could affect our findings.
The occurrence of IH mimicking OSA for a duration corresponding to late gestation, a time when OSA is more likely to occur in up to 35% of pregnant women (Facco, 2014), induced metabolic dysfunction in male offspring mice, but not in female offspring. Gender dimorphic transgenerational manifestations of gestational perturbations are now well recognized (Mischke et al. 2013; Sullivan et al. 2014; Khalyfa et al. 2015). Next, to determine the mechanisms underlying the body phenotype changes, we comprehensively evaluated metabolic activity, and found that compared with LG‐RA, LG‐IH resulted in increased food intake in both light and dark cycles, reduced and , with enhanced heat dissipation, but reduced locomotor activity (Table 2).
Expansion of adipose tissues, particularly VWAT, can lead to chronic low‐grade inflammation that contributes to the development of metabolic disorders, including dyslipidaemia, insulin resistance, and type‐2 diabetes (Ng et al. 2010). VWAT cells express receptors for most of these factors indicating extensive crosstalk at a local and systemic level in response to specific external stimuli or metabolic changes (Gorla‐Bajszczak et al. 2000). Indeed, adipocyte‐derived factors can be dysregulated in alterations accompanying VWAT mass changes, such as overfeeding (Fruhbeck, 2008) or gestational high fat diet (Khalyfa et al. 2013; Murabayashi et al. 2013; Isganaitis et al. 2014; Parlee & MacDougald, 2014). In line with our previous findings using LG‐SF (Khalyfa et al. 2014), we now found that body weight, as well as visceral and subcutaneous fat mass, plasma cholesterol, triglycerides and HOMA‐IR values were all increased in male offspring of mothers exposed to LG‐IH compared with LG‐RA. At the cellular level, macrophages, lymphocytes and adipocytes are known to interact and regulate the inflammatory cascade and metabolism (Shaul et al. 2010). Furthermore, polarization of VWAT macrophages into a pro‐inflammatory M1 phenotype will gradually replace M2‐polarized macrophages, and de facto provides a reporter balance status between adipose tissue inflammation and glucose intolerance (Lumeng et al. 2007). The increases in M1/M2 macrophage ratios in LG‐IH support such assumptions, and although the underlying mechanisms are probably multiple and currently unknown, epigenetic changes induced by LG‐IH may provide an explanation.
Several mechanisms have been proposed to explain the developmental origins of adult disease, among them epigenetic phenomena (Dick et al. 2014). Here, we provide evidence that alterations in methylation within the VWAT are associated with the presence of the metabolic disturbance among LG‐IH mice. Using an unbiased method for the enrichment of the DNA methylated fraction of the genome of VWAT samples from both experimental groups coupled to a microarray platform covering all annotated promoter regions in the mouse genome, we achieved a large‐scale scan of putative regulatory regions for gene expression, and identified over 1500 DMRs, which were associated with 693 genes. Bioinformatic analyses showed that in general, DMRs with higher DNA methylation in the LG‐IH group were associated with biochemical pathways related to energy production through amino acid and fatty acid metabolism, in particular methionine degradation and cysteine biosynthesis, whereas DMRs with reduced DNA methylation were associated with choline degradation and glutaryl‐CoA degradation pathways. Thus, these findings emphasize the effect of IH‐induced epigenetic alterations on biochemical pathways involved in obesity and the metabolic syndrome. For example, it is known that metabolism of dietary methionine plays a key role in adipogenesis, insulin sensitivity and inflammation (Hasek et al. 2013), the three physiological hallmarks of metabolic syndrome. IH‐induced epigenetic variations alter such pathways in a direction consistent with the development of an obesogenic and metabolically altered phenotype in the offspring, and thus the methylome differences coincide with the phenotypic findings. It is worth noting, however, than even when though the effect of DNA methylation on gene expression is widely accepted as predictable, in this study we did not systematically explore whether DMRs are associated with altered expression of the corresponding cognate genes. Hence, we cannot rule out the possibility that other factors contributing to the development of the phenotype might be involved, and further investigation in this area is warranted.
Intermittent hypoxia (IH) and sleep fragmentation (SF) are two fundamental characteristics of OSA (Dempsey et al. 2010), a frequent condition in pregnancy, particularly during late gestation (Nodine & Matthews, 2013). Present study results concur and extend the findings of a previous study from our laboratory, whereby we showed differential DNA methylation in VWAT samples of offspring of mothers subjected to (LG‐SF) (Cortese et al. 2015). Interestingly, we now identify a remarkable overlap among the differentially methylated genes in the VWAT of LG‐IH and LG‐SF male offspring. Gene network and pathway analyses on these overlapping genes revealed that LG‐IH may concomitantly act upon metabolic pathways also affected by LG‐SF, such as molecular processes related to metabolic regulation and inflammatory responses. However, analysis of differentially methylated genes between LG‐IH and LG‐SF groups showed that LG‐IH also affects biochemical processes underlying energy production in VWAT of the male offspring. Thus, while the two main components of gestational OSA may share epigenetic effects on the VWAT of the offspring, our results suggest that distinctive pathways are also affected. Future research efforts will determine the relative contributions of OSA components (IH and SF) in the development of the altered metabolic phenotype in the offspring. Notwithstanding, the data support the concept that an effect of late‐gestational OSA in the epigenomes of metabolically active tissues of the offspring is leading to metabolic dysfunction. We reasoned that the targeted exploration of the epigenome might not only provide evidence that a perturbed sleep environment during pregnancy such as IH affects fetal development, but may also be associated to a specific phenotype in the offspring, thus demonstrating a role for the sleep‐disordered‐breathing intrauterine environment in the predisposition to adiposity and metabolic dysfunction.
Conclusions
LG‐IH exposures in utero lead to a metabolically altered phenotype in the male offspring that includes epigenetic modifications manifesting as extensive methylation differences in VWAT. Given the increasing prevalence of obesity and metabolic disease in the last few decades, it is of crucial importance to understand the mechanisms underlying such a process. We believe our findings provide a comprehensive map of epigenomic modifications associated with LG‐IH in VWAT, as well as a robust line of evidence linking sleep perturbations during intrauterine life and metabolic fate in adult male offspring.
Additional information
Competing interests
The authors have no conflicts of interest to declare.
Author contributions
A.K. was involved in the conceptual framework of the project, performed experiments, analysed data, and drafted the initial version of the manuscript. R.C. participated in study design, performed experiments, analysed data, and drafted components of the initial version of the manuscript. Z.Q. and H.Y. performed experiments, analysed data, and served as blinded observers. R.B. and J.A. performed bioinformatics analyses. D.G. conceptualized the project, provided critical input in all phases of the experiments, analysed data, drafted the ulterior versions of the manuscript, and is responsible for the financial support of the project and the manuscript content. All authors have reviewed and approved the final version of the manuscript, all persons designated as authors qualify for authorship, and all those who qualify for authorship are listed.
Funding
D.G. is supported by the Herbert T. Abelson Chair in Pediatrics.
Supporting information
Disclaimer: Supporting information has been peer‐reviewed but not copyedited.
Table S1. Differentially methylated regions between LG‐IH and LG‐RA groups.
Table S2. Canonical pathways associated with DMRs between LG‐IH and LG‐RA groups.
Table S3. Genes showing concordant differential DNA methylation in LG‐IH and LG‐SF groups.
A. Khalyfa and R. Cortese contributed equally to the work.
This is an Editor's Choice article from the 15 April 2017 issue.
References
- Aiken CE & Ozanne SE (2014). Transgenerational developmental programming. Hum Reprod Update 20, 63–75. [DOI] [PubMed] [Google Scholar]
- Aiken CE, Tarry‐Adkins JL & Ozanne SE (2016). Transgenerational effects of maternal diet on metabolic and reproductive ageing. Mamm Genome 27, 430–439. [DOI] [PMC free article] [PubMed] [Google Scholar]
- Ananth CV & Vintzileos AM (2009). Distinguishing pathological from constitutional small for gestational age births in population‐based studies. Early Hum Dev 85, 653–658. [DOI] [PubMed] [Google Scholar]
- Armitage JA, Poston L & Taylor PD (2008). Developmental origins of obesity and the metabolic syndrome: the role of maternal obesity. Front Horm Res 36, 73–84. [DOI] [PubMed] [Google Scholar]
- Barker DJ (1995). Intrauterine programming of adult disease. Mol Med Today 1, 418–423. [DOI] [PubMed] [Google Scholar]
- Barker DJ (2007). The origins of the developmental origins theory. J Int Med 261, 412–417. [DOI] [PubMed] [Google Scholar]
- Barker DJ, Osmond C, Forsen TJ, Kajantie E & Eriksson JG (2007). Maternal and social origins of hypertension. Hypertension 50, 565–571. [DOI] [PubMed] [Google Scholar]
- Bateson P, Barker D, Clutton‐Brock T, Deb D, D'Udine B, Foley RA, Gluckman P, Godfrey K, Kirkwood T, Lahr MM, McNamara J, Metcalfe NB, Monaghan P, Spencer HG & Sultan SE (2004). Developmental plasticity and human health. Nature 430, 419–421. [DOI] [PubMed] [Google Scholar]
- Blackmore HL & Ozanne SE (2013). Maternal diet‐induced obesity and offspring cardiovascular health. J Dev Orig Health Dis 4, 338–347. [DOI] [PubMed] [Google Scholar]
- Bourjeily G, Ankner G & Mohsenin V (2011). Sleep‐disordered breathing in pregnancy. Clin Chest Med 32, 175–189. [DOI] [PubMed] [Google Scholar]
- Bourjeily G, El Sabbagh R, Sawan P, Raker C, Wang C, Hott B & Louis M (2013). Epworth sleepiness scale scores and adverse pregnancy outcomes. Sleep Breath 17, 1179–1186. [DOI] [PubMed] [Google Scholar]
- Burdge GC & Lillycrop KA (2010). Nutrition, epigenetics, and developmental plasticity: implications for understanding human disease. Ann Rev Nutr 30, 315–339. [DOI] [PubMed] [Google Scholar]
- Champagne K, Schwartzman K, Opatrny L, Barriga P, Morin L, Mallozzi A, Benjamin A & Kimoff RJ (2009). Obstructive sleep apnoea and its association with gestational hypertension. Eur Respir J 33, 559–565. [DOI] [PubMed] [Google Scholar]
- Cortese R, Khalyfa A, Bao R, Andrade J & Gozal D (2015). Epigenomic profiling in visceral white adipose tissue of offspring of mice exposed to late gestational sleep fragmentation. Int J Obes (Lond) 39, 1432. [DOI] [PubMed] [Google Scholar]
- Dempsey JA, Veasey SC, Morgan BJ & O'Donnell CP (2010). Pathophysiology of sleep apnea. Physiol Rev 90, 47–112. [DOI] [PMC free article] [PubMed] [Google Scholar]
- Dick KJ, Nelson CP, Tsaprouni L, Sandling JK, Aissi D, Wahl S, Meduri E, Morange PE, Gagnon F, Grallert H, Waldenberger M, Peters A, Erdmann J, Hengstenberg C, Cambien F, Goodall AH, Ouwehand WH, Schunkert H, Thompson JR, Spector TD, Gieger C, Tregouet DA, Deloukas P & Samani NJ (2014). DNA methylation and body‐mass index: a genome‐wide analysis. Lancet 383, 1990–1998. [DOI] [PubMed] [Google Scholar]
- Edwards N, Middleton PG, Blyton DM & Sullivan CE (2002). Sleep disordered breathing and pregnancy. Thorax 57, 555–558. [DOI] [PMC free article] [PubMed] [Google Scholar]
- Entringer S, Buss C, Swanson JM, Cooper DM, Wing DA, Waffarn F & Wadhwa PD (2012). Fetal programming of body composition, obesity, and metabolic function: the role of intrauterine stress and stress biology. J Nutr Metab 2012, 632548. [DOI] [PMC free article] [PubMed] [Google Scholar]
- Facco F (2014). Sleep‐disordered breathing in pregnancy: a brief summary of current knowledge. BJOG 121, 1694. [DOI] [PMC free article] [PubMed] [Google Scholar]
- Frederick IO, Qiu C, Sorensen TK, Enquobahrie DA & Williams MA (2013). The prevalence and correlates of habitual snoring during pregnancy. Sleep Breath 17, 541–547. [DOI] [PubMed] [Google Scholar]
- Fruhbeck G (2008). Overview of adipose tissue and its role in obesity and metabolic disorders. Methods Mol Biol 456, 1–22. [DOI] [PubMed] [Google Scholar]
- Gluckman PD, Hanson MA & Beedle AS (2007). Non‐genomic transgenerational inheritance of disease risk. BioEssays 29, 145–154. [DOI] [PubMed] [Google Scholar]
- Gluckman PD, Hanson MA, Cooper C & Thornburg KL (2008). Effect of in utero and early‐life conditions on adult health and disease. New Engl J Med 359, 61–73. [DOI] [PMC free article] [PubMed] [Google Scholar]
- Gorla‐Bajszczak A, Siegrist‐Kaiser C, Boss O, Burger AG & Meier CA (2000). Expression of peroxisome proliferator‐activated receptors in lean and obese Zucker rats. Eur J Endocrinol 142, 71–78. [DOI] [PubMed] [Google Scholar]
- Gozal D, Reeves SR, Row BW, Neville JJ, Guo SZ & Lipton AJ (2003). Respiratory effects of gestational intermittent hypoxia in the developing rat. Am J Respir Crit Care Med 167, 1540–1547. [DOI] [PubMed] [Google Scholar]
- Guh DP, Zhang W, Bansback N, Amarsi Z, Birmingham CL & Anis AH (2009). The incidence of co‐morbidities related to obesity and overweight: a systematic review and meta‐analysis. BMC Public Health 9, 88. [DOI] [PMC free article] [PubMed] [Google Scholar]
- Hasek BE, Boudreau A, Shin J, Feng D, Hulver M, Van NT, Laque A, Stewart LK, Stone KP, Wanders D, Ghosh S, Pessin JE & Gettys TW (2013). Remodeling the integration of lipid metabolism between liver and adipose tissue by dietary methionine restriction in rats. Diabetes 62, 3362–3372. [DOI] [PMC free article] [PubMed] [Google Scholar]
- Isganaitis E, Woo M, Ma H, Chen M, Kong W, Lytras A, Sales V, Decoste‐Lopez J, Lee KJ, Leatherwood C, Lee D, Fitzpatrick C, Gall W, Watkins S & Patti ME (2014). Developmental programming by maternal insulin resistance: hyperinsulinemia, glucose intolerance, and dysregulated lipid metabolism in male offspring of insulin‐resistant mice. Diabetes 63, 688–700. [DOI] [PMC free article] [PubMed] [Google Scholar]
- Izci B, Martin SE, Dundas KC, Liston WA, Calder AA & Douglas NJ (2005). Sleep complaints: snoring and daytime sleepiness in pregnant and pre‐eclamptic women. Sleep Med 6, 163–169. [DOI] [PubMed] [Google Scholar]
- Izci Balserak B, Jackson N, Ratcliffe SA, Pack AI & Pien GW (2013). Sleep‐disordered breathing and daytime napping are associated with maternal hyperglycemia. Sleep Breath 17, 1093–1102. [DOI] [PMC free article] [PubMed] [Google Scholar]
- Johnson WE, Li W, Meyer CA, Gottardo R, Carroll JS, Brown M & Liu XS (2006). Model‐based analysis of tiling‐arrays for ChIP‐chip. Proc Natl Acad Sci USA 103, 12457–12462. [DOI] [PMC free article] [PubMed] [Google Scholar]
- Keith SW, Redden DT, Katzmarzyk PT, Boggiano MM, Hanlon EC, Benca RM, Ruden D, Pietrobelli A, Barger JL, Fontaine KR, Wang C, Aronne LJ, Wright SM, Baskin M, Dhurandhar NV, Lijoi MC, Grilo CM, DeLuca M, Westfall AO & Allison DB (2006). Putative contributors to the secular increase in obesity: exploring the roads less traveled. Int J Obes (Lond) 30, 1585–1594. [DOI] [PubMed] [Google Scholar]
- Khalyfa A, Carreras A, Almendros I, Hakim F & Gozal D (2015). Sex dimorphism in late gestational sleep fragmentation and metabolic dysfunction in offspring mice. Sleep 38, 545–557. [DOI] [PMC free article] [PubMed] [Google Scholar]
- Khalyfa A, Carreras A, Hakim F, Cunningham JM, Wang Y & Gozal D (2013). Effects of late gestational high‐fat diet on body weight, metabolic regulation and adipokine expression in offspring. Int J Obes (Lond) 37, 1481–1489. [DOI] [PMC free article] [PubMed] [Google Scholar]
- Khalyfa A, Mutskov V, Carreras A, Khalyfa AA, Hakim F & Gozal D (2014). Sleep fragmentation during late gestation induces metabolic perturbations and epigenetic changes in adiponectin gene expression in male adult offspring mice. Diabetes 63, 3230–3241. [DOI] [PMC free article] [PubMed] [Google Scholar]
- Kheirandish L, Row BW, Li RC, Brittian KR & Gozal D (2005). Apolipoprotein E‐deficient mice exhibit increased vulnerability to intermittent hypoxia‐induced spatial learning deficits. Sleep 28, 1412–1417. [DOI] [PubMed] [Google Scholar]
- Kratz M, Coats BR, Hisert KB, Hagman D, Mutskov V, Peris E, Schoenfelt KQ, Kuzma JN, Larson I, Billing PS, Landerholm RW, Crouthamel M, Gozal D, Hwang S, Singh PK & Becker L (2014). Metabolic dysfunction drives a mechanistically distinct proinflammatory phenotype in adipose tissue macrophages. Cell Metab 20, 614–625. [DOI] [PMC free article] [PubMed] [Google Scholar]
- Leon BM & Maddox TM (2015). Diabetes and cardiovascular disease: Epidemiology, biological mechanisms, treatment recommendations and future research. World J Diabetes 6, 1246–1258. [DOI] [PMC free article] [PubMed] [Google Scholar]
- Li RC, Haribabu B, Mathis SP, Kim J & Gozal D (2011). Leukotriene B4 receptor‐1 mediates intermittent hypoxia‐induced atherogenesis. Am J Respir Crit Care Med 184, 124–131. [DOI] [PMC free article] [PubMed] [Google Scholar]
- Lumeng CN, Bodzin JL & Saltiel AR (2007). Obesity induces a phenotypic switch in adipose tissue macrophage polarization. J Clin Invest 117, 175–184. [DOI] [PMC free article] [PubMed] [Google Scholar]
- Martinez JA, Cordero P, Campion J & Milagro FI (2012). Interplay of early‐life nutritional programming on obesity, inflammation and epigenetic outcomes. Proc Nutr Soc 71, 276–283. [DOI] [PubMed] [Google Scholar]
- Mischke M, Pruis MG, Boekschoten MV, Groen AK, Fitri AR, van de Heijning BJ, Verkade HJ, Muller M, Plosch T & Steegenga WT (2013). Maternal Western‐style high fat diet induces sex‐specific physiological and molecular changes in two‐week‐old mouse offspring. PloS One 8, e78623. [DOI] [PMC free article] [PubMed] [Google Scholar]
- Murabayashi N, Sugiyama T, Zhang L, Kamimoto Y, Umekawa T, Ma N & Sagawa N (2013). Maternal high‐fat diets cause insulin resistance through inflammatory changes in fetal adipose tissue. Eur J Obstet Gynecol Reprod Biol 169, 39–44. [DOI] [PubMed] [Google Scholar]
- Mutskov V, Khalyfa A, Wang Y, Carreras A, Nobrega MA & Gozal D (2015). Early‐life physical activity reverses metabolic and Foxo1 epigenetic misregulation induced by gestational sleep disturbance. Am J Physiol Regul Integr Comp Physiol 308, R419–R430. [DOI] [PMC free article] [PubMed] [Google Scholar]
- Nair D, Dayyat EA, Zhang SX, Wang Y & Gozal D (2011). Intermittent hypoxia‐induced cognitive deficits are mediated by NADPH oxidase activity in a murine model of sleep apnea. PloS One 6, e19847. [DOI] [PMC free article] [PubMed] [Google Scholar]
- Ng SF, Lin RC, Laybutt DR, Barres R, Owens JA & Morris MJ (2010). Chronic high‐fat diet in fathers programs β‐cell dysfunction in female rat offspring. Nature 467, 963–966. [DOI] [PubMed] [Google Scholar]
- Nodine PM & Matthews EE (2013). Common sleep disorders: management strategies and pregnancy outcomes. J Midwifery Womens Health 58, 368–377. [DOI] [PubMed] [Google Scholar]
- O'Brien LM, Bullough AS, Owusu JT, Tremblay KA, Brincat CA, Chames MC, Kalbfleisch JD & Chervin RD (2013). Snoring during pregnancy and delivery outcomes: a cohort study. Sleep 36, 1625–1632. [DOI] [PMC free article] [PubMed] [Google Scholar]
- O'Keeffe M & St‐Onge MP (2013). Sleep duration and disorders in pregnancy: implications for glucose metabolism and pregnancy outcomes. Int J Obes (Lond) 37, 765–770. [DOI] [PMC free article] [PubMed] [Google Scholar]
- Padmanabhan V, Cardoso RC & Puttabyatappa M (2016). Developmental programming, a pathway to disease. Endocrinology 157, 1328–1340. [DOI] [PMC free article] [PubMed] [Google Scholar]
- Pamidi S, Wroblewski K, Stepien M, Sharif‐Sidi K, Kilkus J, Whitmore H & Tasali E (2015). Eight hours of nightly continuous positive airway pressure treatment of obstructive sleep apnea improves glucose metabolism in patients with prediabetes. A randomized controlled trial. Am J Respir Crit Care Med 192, 96–105. [DOI] [PMC free article] [PubMed] [Google Scholar]
- Parlee SD & MacDougald OA (2014). Maternal nutrition and risk of obesity in offspring: the Trojan horse of developmental plasticity. Biochim Biophys Acta 1842, 495–506. [DOI] [PMC free article] [PubMed] [Google Scholar]
- Pembrey M, Saffery R, Bygren LO; Network in Epigenetic Epidemiology (2014). Human transgenerational responses to early‐life experience: potential impact on development, health and biomedical research. J Med Genet 51, 563–572. [DOI] [PMC free article] [PubMed] [Google Scholar]
- Ravishankar S, Bourjeily G, Lambert‐Messerlian G, He M, De Paepe ME & Gundogan F (2015). Evidence of placental hypoxia in maternal sleep disordered breathing. Pediatr Dev Pathol 18, 380–386. [DOI] [PubMed] [Google Scholar]
- Reichmann JP (2013). Pregnancy‐onset habitual snoring, gestational hypertension, and preeclampsia: prospective cohort study. Am J Obstet Gyn 208, 507. [DOI] [PubMed] [Google Scholar]
- Reynolds CM, Gray C, Li M, Segovia SA & Vickers MH (2015). Early life nutrition and energy balance disorders in offspring in later life. Nutrients 7, 8090–8111. [DOI] [PMC free article] [PubMed] [Google Scholar]
- Rinaudo P & Wang E (2012). Fetal programming and metabolic syndrome. Annu Rev Physiol 74, 107–130. [DOI] [PMC free article] [PubMed] [Google Scholar]
- Savic D, Ye H, Aneas I, Park SY, Bell GI & Nobrega MA (2011). Alterations in TCF7L2 expression define its role as a key regulator of glucose metabolism. Genome Res 21, 1417–1425. [DOI] [PMC free article] [PubMed] [Google Scholar]
- Shaul ME, Bennett G, Strissel KJ, Greenberg AS & Obin MS (2010). Dynamic, M2‐like remodeling phenotypes of CD11c+ adipose tissue macrophages during high‐fat diet‐induced obesity in mice. Diabetes 59, 1171–1181. [DOI] [PMC free article] [PubMed] [Google Scholar]
- Sullivan EL, Nousen EK & Chamlou KA (2014). Maternal high fat diet consumption during the perinatal period programs offspring behavior. Physiol Behav 123, 236–242. [DOI] [PMC free article] [PubMed] [Google Scholar]
- Tamashiro KL & Moran TH (2010). Perinatal environment and its influences on metabolic programming of offspring. Physiol Behav 100, 560–566. [DOI] [PMC free article] [PubMed] [Google Scholar]
- Xu J, Long YS, Gozal D & Epstein PN (2009). β‐cell death and proliferation after intermittent hypoxia: role of oxidative stress. Free Radic Biol Med 46, 783–790. [DOI] [PubMed] [Google Scholar]
- Xu T, Feng Y, Peng H, Guo D & Li T (2014). Obstructive sleep apnea and the risk of perinatal outcomes: a meta‐analysis of cohort studies. Sci Rep 4, 6982. [DOI] [PMC free article] [PubMed] [Google Scholar]
- Zou M, Arentson EJ, Teegarden D, Koser SL, Onyskow L & Donkin SS (2012). Fructose consumption during pregnancy and lactation induces fatty liver and glucose intolerance in rats. Nutr Res 32, 588–598. [DOI] [PMC free article] [PubMed] [Google Scholar]
Associated Data
This section collects any data citations, data availability statements, or supplementary materials included in this article.
Supplementary Materials
Disclaimer: Supporting information has been peer‐reviewed but not copyedited.
Table S1. Differentially methylated regions between LG‐IH and LG‐RA groups.
Table S2. Canonical pathways associated with DMRs between LG‐IH and LG‐RA groups.
Table S3. Genes showing concordant differential DNA methylation in LG‐IH and LG‐SF groups.


