

Abstract
Mitochondria play key roles in cellular immunity. How mitochondria contribute to organismal immunity remains poorly understood. Here, we show that HSP‐60/HSPD1, a major mitochondrial chaperone, boosts anti‐bacterial immunity through the up‐regulation of p38 MAP kinase signaling. We first identify 16 evolutionarily conserved mitochondrial components that affect the immunity of Caenorhabditis elegans against pathogenic Pseudomonas aeruginosa (PA14). Among them, the mitochondrial chaperone HSP‐60 is necessary and sufficient to increase resistance to PA14. We show that HSP‐60 in the intestine and neurons is crucial for the resistance to PA14. We then find that p38 MAP kinase signaling, an evolutionarily conserved anti‐bacterial immune pathway, is down‐regulated by genetic inhibition of hsp‐60, and up‐regulated by increased expression of hsp‐60. Overexpression of HSPD1, the mammalian ortholog of hsp‐60, increases p38 MAP kinase activity in human cells, suggesting an evolutionarily conserved mechanism. Further, cytosol‐localized HSP‐60 physically binds and stabilizes SEK‐1/MAP kinase kinase 3, which in turn up‐regulates p38 MAP kinase and increases immunity. Our study suggests that mitochondrial chaperones protect host eukaryotes from pathogenic bacteria by up‐regulating cytosolic p38 MAPK signaling.
Keywords: Caenorhabditis elegans, HSP‐60, mitochondria, p38 MAP kinase, Pseudomonas aeruginosa
Subject Categories: Immunology, Signal Transduction
Introduction
Emerging evidence indicates that mitochondria play key roles in anti‐viral and anti‐bacterial innate immunity in mammalian cells (West et al, 2011). For example, mitochondria protect cells from pathogens by the generation of reactive oxygen species (ROS) that eliminate bacteria. Mitochondria also provide a membrane platform on which pathogen‐responsive immune effector proteins boost inflammatory signals. However, mechanisms by which mitochondria modulate immunity remain largely unknown, in particular, at the organism level.
Caenorhabditis elegans has been used as an excellent model to study organismal innate immunity against pathogenic microbes (Ewbank, 2006; Irazoqui et al, 2010; Kim & Ewbank, 2015; Ewbank & Pujol, 2016). Previous studies have identified important immune regulators against bacterial pathogens; these include PMK‐1/p38 mitogen‐activated protein kinase (p38 MAPK) (Kim et al, 2002), and transcription factors, SKN‐1 (Papp et al, 2012), ZIP‐2 (Estes et al, 2010), and DAF‐16/FOXO (Garsin et al, 2003; Evans et al, 2008). Among them, PMK‐1 is essential for resistance against infection by various pathogenic bacteria, including Pseudomonas aeruginosa (Kim et al, 2002, 2004; Troemel et al, 2006; Powell et al, 2009; Ren et al, 2009; Shivers et al, 2009, 2010; Bolz et al, 2010; Richardson et al, 2010; Pukkila‐Worley & Ausubel, 2012; Kim, 2013). PMK‐1 is activated via phosphorylation by the upstream kinase cascade, composed of SEK‐1/MKK3 (MAPK kinase) and NSY‐1/ASK1 (MAPK kinase kinase), which also mediate immunity against pathogenic bacteria. The activation of the PMK‐1 signaling cascade by P. aeruginosa infection is dependent on Toll‐interleukin‐1 receptor (TIR) domain‐containing protein TIR‐1/SARM (Couillault et al, 2004; Liberati et al, 2004).
Mitochondria also play roles in the resistance of C. elegans against pathogenic bacteria by regulating ROS production, mitophagy, and mitochondrial unfolded protein response (UPRMT) (Hwang et al, 2014; Liu et al, 2014; Pellegrino et al, 2014; Kirienko et al, 2015; Ewbank & Pujol, 2016). Under stress conditions, UPRMT sends signals to the nucleus through HAF‐1, a mitochondrial peptide exporter (Haynes et al, 2010), and up‐regulates transcription factors including ATFS‐1 (Haynes et al, 2010), DVE‐1 (Haynes et al, 2007), its cofactor UBL‐5 (Benedetti et al, 2006), and chromatin remodeling factors (Merkwirth et al, 2016; Tian et al, 2016). This leads to the induction of genes such as mitochondrial chaperones, which help alleviate perturbed protein homeostasis in mitochondria (Pellegrino et al, 2013). UPRMT also increases the expression of several anti‐microbial genes in C. elegans in an ATFS‐1‐dependent manner, and contributes to anti‐bacterial immunity (Nargund et al, 2012; Pellegrino et al, 2014). In addition, inhibition of mitochondrial complex I up‐regulates PMK‐1 signaling (Chikka et al, 2016). Despite these advances, the link between mitochondrial factors and immune signaling pathways in C. elegans remains elusive.
In this study, we aim to identify evolutionarily conserved mitochondrial factors that contribute to organismal immunity using C. elegans and P. aeruginosa as the host and pathogen, respectively. We find that the mitochondrial chaperone HSP‐60 enhances C. elegans immunity against P. aeruginosa. We demonstrate that HSP‐60 in the intestine and neurons is crucial for the resistance to PA14. We then show that HSP‐60 up‐regulates the PMK‐1 signaling pathway, which confers the increased immunity. Using cultured human cells, we find that the activity of p38 MAPK is increased by HSPD1, the ortholog of HSP‐60. Furthermore, we show that a fraction of HSP‐60 in the cytosol increases the PA14 immunity by binding and stabilizing SEK‐1/MKK3, which up‐regulates p38 MAP kinase. Our study raises the possibility that mitochondrial chaperones protect hosts from pathogens by the up‐regulation of cytosolic PMK‐1/p38 MAPK signaling, which is an evolutionarily conserved immune process.
Results
A genetic screen identifies mitochondrial components that regulate Caenorhabditis elegans immunity
We sought to identify mitochondrial factors that were critical for immunity using C. elegans as the host animal and PA14 as the pathogenic bacteria. We specifically focused on evolutionarily conserved nuclear‐encoded mitochondrial components because of their potential implication in mammalian immunity (Appendix Fig S1A; also see Materials and Methods). We knocked down 220 such mitochondrial components with available RNAi clones and measured the survival of C. elegans fed on PA14 by using a standard infection (“slow killing”) assay (Appendix Fig S1A) (Tan et al, 1999). As potential immune‐regulatory genes, we identified 16 RNAi clones that reproducibly increased or decreased the survival of animals following PA14 infection (arbitrary cutoff: ±10% change in mean survival, and P‐value < 0.001, Fig 1A and Table 1).
Figure 1. Targeted RNAi screen for mitochondrial components that affect anti‐PA14 immunity in Caenorhabditis elegans .

-
AA volcano plot exhibits mean survival changes and P‐values on PA14 after pre‐treatment with each of RNAi clones targeting evolutionarily conserved mitochondrial components. P‐values were calculated by using log‐rank test. pmk‐1 RNAi (red diamond) was used as a positive control.
-
B, CHeat maps were generated based on the effects of RNAi clones on the survival of animals in different genetic backgrounds upon PA14 infection (average values of % changes in mean survival obtained from two independent trials) (B) and on the expression levels of GFP reporters for known immune effector proteins (C). Asterisk indicates effects by empty vector controls.
-
DGenes in the heat maps shown in panels (B) and (C) were randomly clustered into three groups (clusters I, II, and III) by using Cluster 3.0.
Table 1.
List of mitochondrial genes whose knockdown reproducibly influences the survival of Caenorhabditis elegans on PA14
| Gene | Description | % Change in mean survival | ||
|---|---|---|---|---|
| Human | C. elegans | RNAi screen | 2nd repeat | |
| HSPD1 | hsp‐60 | Mitochondria‐specific chaperone | −31.9 | −36.9 |
| AGP5 | ads‐1 | Alkyldihydroxyacetonephosphate synthase, peroxisomal | −29.9 | −26.0 |
| GLRX5 | glrx‐5 | Glutaredoxin‐related protein 5 (mitochondrial), involved in the biogenesis of iron–sulfur clusters and normal iron homeostasis | −19.4 | −25.9 |
| DBT | ZK669.4 | Dihydrolipoamide branched chain transacylase | −30.6 | −18.8 |
| IDH2 | idh‐2 | Mitochondria isocitrate dehydrogenase | −60.6 | −12.4 |
| NDUFS4 | lpd‐5 | An accessory subunit of the mitochondrial membrane respiratory chain NADH dehydrogenase (complex I), or NADH | 22.1 | 10.2 |
| ALDH5A1 | alh‐7 | Aldehyde dehydrogenase | 32.5 | 16.7 |
| NDUFV2 | F53F4.10 | NADH dehydrogenase [ubiquinone] flavoprotein 2 | 22.5 | 20.6 |
| GRPEL1 | C34C12.8 | GrpE protein homolog 1, Hsp70 cochaperone | 35.4 | 26.8 |
| LARS2 | lars‐2 | Leucyl amino‐acyl tRNA synthetase | 17.9 | 27.9 |
| MRPS5 | mrps‐5 | Mitochondrial ribosomal protein | 30 | 29.0 |
| MRPL3 | mrps‐18C | Mitochondrial ribosomal protein | 34.1 | 32.0 |
| DAP3 | dap‐3 | Death‐associated protein 3, mitochondrial ribosomal protein that promotes apoptosis | 47.0 | 34.5 |
| MRPL22 | mrpl‐22 | Mitochondrial ribosomal protein | 24.6 | 39.8 |
| SLC25A37 | mfn‐1 | Mitoferrin, iron importer for the synthesis of mitochondrial heme and iron–sulfur clusters | 32.0 | 41.0 |
| MRPS35 | mrps‐35 | Mitochondrial ribosomal protein | 32.1 | 43.2 |
We classified these 16 genes based on the effects of their RNAi knockdown on known immune‐regulatory signaling pathways against PA14 infection, including PMK‐1/p38 MAPK (Kim et al, 2002), and the three transcription factors, ZIP‐2 (Estes et al, 2010), SKN‐1/Nrf (Papp et al, 2012), and DAF‐16/FOXO (Garsin et al, 2003; Evans et al, 2008) (Fig 1B–D and Appendix Fig S1A). We measured the survival of pmk‐1, zip‐2, and daf‐16 mutants after PA14 infection upon treatment with each of the 16 RNAi clones (Fig 1B). We also examined the effects of the RNAi clones on downstream target gene GFP reporters for these regulators, including T24B8.5 for PMK‐1 (Shivers et al, 2009), irg‐1 for ZIP‐2 (Estes et al, 2010), gst‐4 for SKN‐1 (Kahn et al, 2008), and sod‐3 for DAF‐16 (Honda & Honda, 1999; Libina et al, 2003) (Fig 1C). We analyzed the results using a heat map, which exhibited three clusters (Fig 1B–D and Appendix Fig S1B; see Appendix Fig S1 legend for the detailed description of these clusters). RNAi knockdown of the cluster I genes decreased the survival of worms following PA14 infection in a pmk‐1‐dependent manner as well as the expression levels of the PMK‐1 reporter, T24B8.5p::GFP (Fig 1B and C). The RNAi clones targeting cluster II genes tended to decrease the survival of worms infected with PA14 in a zip‐2‐dependent manner (Fig 1B). Knockdown of many cluster III genes, which are implicated in mitochondrial mRNA translation and respiration, increased the survival of animals following PA14 infection partly in zip‐2‐ and daf‐16‐dependent manners (Fig 1B). The cluster III RNAi clones also generally decreased the induction of irg‐1p::GFP, but increased the expression of the gst‐4p::GFP upon PA14 infection (Fig 1C). Overall, the mitochondrial components in these three different clusters appear to influence PA14 susceptibility by acting through different immune regulators.
The mitochondrial chaperone HSP‐60 in the intestine and neurons is required for immunity against Pseudomonas aeruginosa
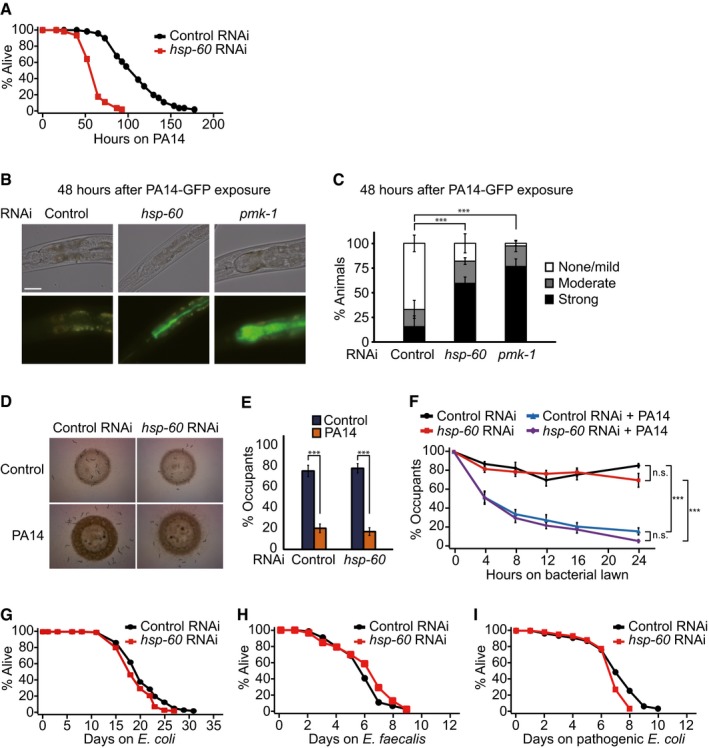
We found that the knockdown of the hsp‐60 had the most robust effect on PA14 resistance, which was up to a 43% decrease (Table 1 and Fig 2A). The accumulation of GFP‐labeled PA14 in the intestinal lumen was also increased by hsp‐60 RNAi (Fig 2B and C). This result indicates that hsp‐60 is required for the clearance of PA14. In contrast, hsp‐60 RNAi did not affect the avoidance behavior of worms to PA14 (Fig 2D–F). hsp‐60 RNAi also had little effect on the lifespan of the worms following standard Escherichia coli (E. coli) diet feeding (Fig 2G), or on the survival upon pathogenic Enterococcus faecalis (E. faecalis) or pathogenic E. coli infection (Fig 2H and I). Together, these data suggest that HSP‐60 is specifically required for resistance to PA14 infection by affecting intrinsic immunity, without altering lifespan or behavioral responses to pathogens.
Figure 2. HSP‐60 is required for resistance against PA14 in Caenorhabditis elegans .
-
ARNAi knockdown of hsp‐60 decreased the survival of animals on PA14. See Appendix Fig S2A for results showing that hsp‐60 RNAi reduced survival on PA14 without 5‐fluoro‐2′‐deoxyuridine (FUdR) treatment.
-
BShown are representative images of worms, which were pre‐treated with control RNAi, hsp‐60 RNAi or pmk‐1 RNAi, after PA14‐GFP exposure for 48 h. Scale bar indicates 40 μm.
-
CSemi‐quantification of PA14‐GFP levels in panel (B) (n ≥ 23 from three independent experiments). Error bars represent standard error of the mean (SEM). P‐values were calculated by using chi‐squared test (***P < 0.001). pmk‐1 RNAi, which increases the accumulation of PA14‐GFP in the intestinal lumen (Kim et al, 2002), was used as a positive control.
-
DBacterial lawn occupancy of wild‐type animals pre‐treated with control or hsp‐60 RNAi upon Escherichia coli (HT115) or PA14 exposure for 16 h.
-
EQuantification of data in panel (D) (n ≥ 100 from three independent experiments). Error bars represent SEM. P‐values were obtained by using two‐tailed Student's t‐test (***P < 0.001).
-
FTime‐course data of the PA14 avoidance assays indicate that worms treated with hsp‐60 RNAi did not display defects in PA14 avoidance (n = 3). Error bars represent SEM. P‐values were calculated by two‐way ANOVA test (***P < 0.001).
-
Ghsp‐60 RNAi had a small effect on the lifespan of animals on a normal E. coli (HT115) diet.
-
H, IKnockdown of hsp‐60 had little or no effect on the survival of worms infected with Enterococcus faecalis without 5‐fluoro‐2′‐deoxyuridine (FUdR) treatment (H) or pathogenic E. coli (I). pmk‐1 RNAi that decreases the survival of animals on both E. faecalis (Shivers et al, 2010) and pathogenic E. coli was used as a positive control (Appendix Fig S2B and C). See Appendix Fig S2D and E for data showing that treatment with E. faecalis or pathogenic E. coli did not induce mitochondrial chaperone genes hsp‐6 or hsp‐60.
Next, we determined in which tissues HSP‐60 was required for the resistance to PA14. By performing tissue‐specific RNAi experiments (Qadota et al, 2007; Calixto et al, 2010), we found that intestine‐ or neuron‐specific hsp‐60 knockdown robustly increased the susceptibility of animals to PA14 (Fig 3A and B). In contrast, treatment with hsp‐60 RNAi specifically in the hypodermis, muscle, or in control animals did not influence survival upon PA14 infection (Fig 3C–F). Thus, HSP‐60 expression in the intestine and neurons contributes to the anti‐PA14 immunity.
Figure 3. hsp‐60 in the intestine and neurons is required for anti‐PA14 immunity.

-
A–DIntestine (A)‐ or neuron (B)‐specific hsp‐60 RNAi increased PA14 susceptibility, whereas muscle (C)‐ or hypodermis (D)‐specific hsp‐60 RNAi did not. rde‐1(ne219) mutant animals that expressed rde‐1 under the control of an intestine‐specific nhx‐2 promoter, a muscle‐specific hlh‐1 promoter or a hypodermis‐specific lin‐26 promoter, and sid‐1 mutant animals that expressed sid‐1 driven by a neuron‐specific unc‐119 promoter were used for tissue‐specific RNAi experiments (Qadota et al, 2007; Calixto et al, 2010).
-
E, FUpon PA14 infection, hsp‐60 RNAi did not affect the survival of RNAi‐defective rde‐1(ne219) (E) or systemic RNAi‐defective sid‐1(pk3321) (F) mutants.
The mitochondrial unfolded protein response is required for the resistance of Caenorhabditis elegans against PA14
We tested whether the PA14 susceptibility was affected by knockdown of UPRMT components other than HSP‐60, including DVE‐1 (Haynes et al, 2007), UBL‐5 (Benedetti et al, 2006), and ATFS‐1, and the mitochondrial peptide exporter HAF‐1 (Haynes et al, 2010). We found that the genetic inhibition of dve‐1 or ubl‐5 significantly increased susceptibility to PA14 (Fig EV1A and B). Mutations in atfs‐1 increased susceptibility to PA14 as well (Fig EV1C), as shown previously (Pellegrino et al, 2014). Our data are consistent with the findings that these factors transcriptionally up‐regulate HSP‐60 (Benedetti et al, 2006; Haynes et al, 2007, 2010). In contrast, the haf‐1 mutation did not affect the survival following PA14 infection (Fig EV1D). Thus, HAF‐1 might not participate in the resistance to PA14, although the result can be interpreted with different reasons such as redundancy. Together, these data indicate that UPRMT, in general, is required for the PA14 resistance.
Figure EV1. The effects of genetic inhibition of various UPRMT components on the survival of animals infected with PA14.

-
A, Bdve‐1 RNAi (A)‐ or ubl‐5 RNAi (B)‐treated animals displayed increased susceptibility to PA14 infection.
-
C, Datfs‐1(gk3094) mutant animals (C) displayed increased susceptibility to PA14 infection, whereas haf‐1(ok705) mutant animals (D) did not.
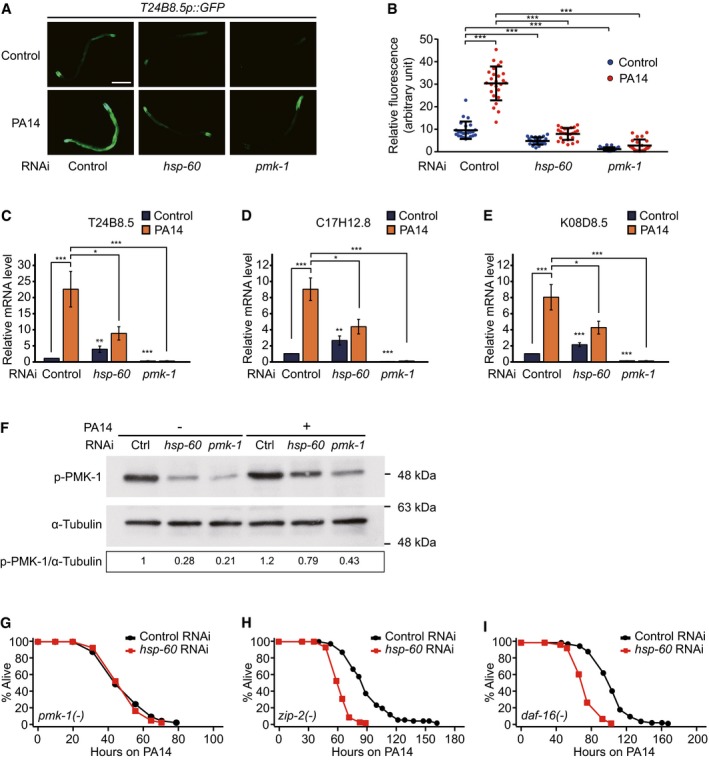
HSP‐60 regulates immunity against PA14 via PMK‐1 signaling pathway
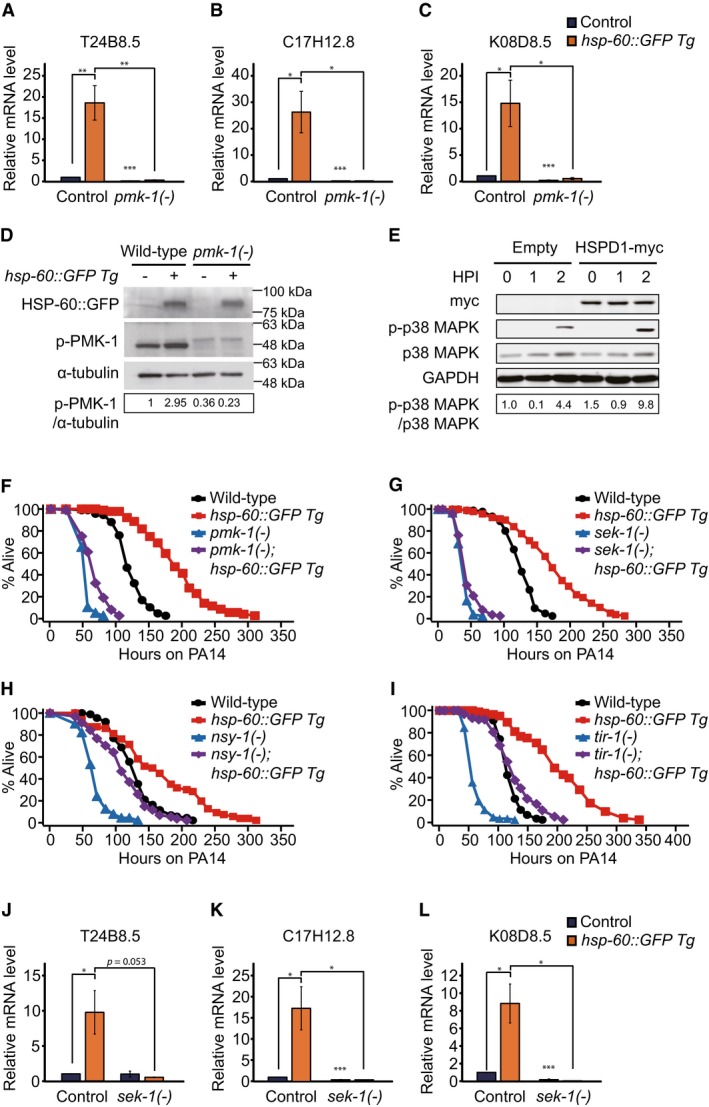
We examined whether UPRMT components affected the activity of known immunity factors. Consistent with our heat map data (Fig 1C), hsp‐60 RNAi decreased the induction of the T24B8.5p::GFP, a PMK‐1 activity reporter, upon PA14 infection (Fig 4A and B). Knockdown of dve‐1 or ubl‐5 also suppressed the PA14‐induced T24B8.5p::GFP (Fig EV2A and B). In addition, hsp‐60 RNAi reduced the levels of F35E12.5p::GFP, another PMK‐1 reporter (Fig EV2C and D) (Bolz et al, 2010), and three selected PMK‐1‐regulated target mRNAs (T24B8.5, C17H12.8 and K08D8.5) (Shivers et al, 2010) following PA14 infection (Fig 4C–E). Further, knockdown of hsp‐60 reduced the level of active phospho‐PMK‐1 under both control and PA14‐infected conditions (Figs 4F and EV2G). These data indicate that hsp‐60 is required for maintaining the basal levels of active PMK‐1. Consistently, knockdown of hsp‐60 did not further reduce the survival of pmk‐1 mutants following infection with PA14 (Fig 4G), but robustly decreased the survival of zip‐2 and daf‐16 mutants (Fig 4H and I). Together, these data suggest that HSP‐60 contributes to the resistance against PA14 by up‐regulating PMK‐1.
Figure 4. hsp‐60 is required for maintaining the basal levels of PMK‐1.
-
Ahsp‐60 RNAi decreased the expression of T24B8.5p::GFP. Scale bar indicates 200 μm.
-
BQuantification of data in panel (A) (n ≥ 23). Note that the same data for control RNAi and pmk‐1 RNAi are also shown in Fig EV2A and B for comparison.
-
C–EqRT–PCR analysis data that show mRNA levels of three selected PMK‐1‐regulated genes, T24B8.5 (C), C17H12.8 (D), and K08D8.5 (E) upon knocking down hsp‐60 with or without PA14 treatment (n ≥ 7).
-
FWestern blot assays showed that hsp‐60 RNAi decreased the level of phospho‐PMK‐1 (p‐PMK‐1) with or without PA14 treatment, which is comparable to pmk‐1 RNAi. The blot is a representative one from four repeats that showed consistent results. α‐tubulin was used as a loading control. The numbers indicate relative intensities of the p‐PMK‐1 bands normalized to α‐tubulin. See Fig EV2G for the quantification data.
-
G–IUpon PA14 infection, hsp‐60 knockdown did not influence the survival of pmk‐1(km25) mutants (G), but significantly decreased the survival of zip‐2(tm4067) (H) and daf‐16(mu86) mutants (I).
Figure EV2. The effects of genetic inhibition of various UPRMT components on the expression of PMK‐1 target genes.
- Upon PA14 infection, RNAi knockdown of dve‐1 or ubl‐5 decreased the expression of T24B8.5p::GFP, a downstream reporter of PMK‐1.
- Quantification of data in panel (A) (n ≥ 23 from three independent experiments). The data for control RNAi and pmk‐1 RNAi are the same as the ones shown in Fig 4B and shown here for comparison.
- hsp‐60 RNAi decreased the elevated level of F35E12.5p::GFP, a downstream reporter of PMK‐1 upon PA14 infection.
- Quantification of data in panel (C) (n ≥ 20 from three independent experiments).
- Mutations in atfs‐1 or haf‐1 did not affect the level of T24B8.5p::GFP on PA14, but atfs‐1 mutations induced T24B8.5p::GFP without PA14 infection.
- Quantification of data in panel (E) (n ≥ 25 from three independent experiments).
- Quantification of Western blot data in Fig 4F (n ≥ 4).
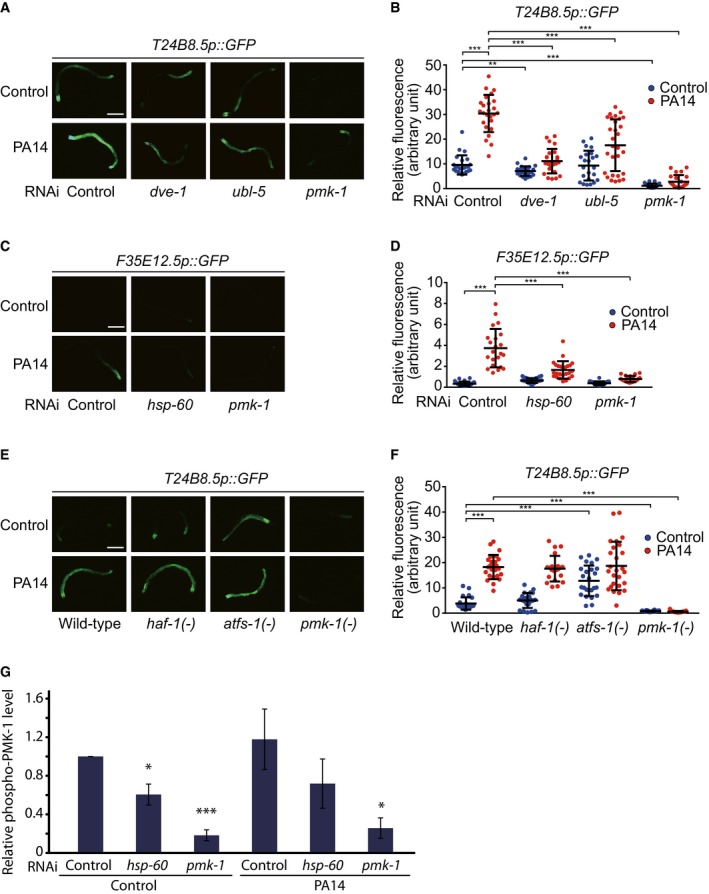
TIR‐1/SARM is a positive upstream regulator of PMK‐1 signaling (Liberati et al, 2004), and gain‐of‐function (gf) mutations of tir‐1/SARM increase anti‐PA14 immunity (Xie et al, 2013). We found that hsp‐60 RNAi suppressed the induction of T24B8.5p::GFP conferred by tir‐1(gf) mutations (Fig 5A and B). In addition, enhanced PA14 resistance conferred by tir‐1(gf) mutations was largely suppressed by hsp‐60 RNAi (Fig 5C). These data indicate that HSP‐60 may act downstream of or in parallel with TIR‐1 to regulate PMK‐1 activity and immunity against PA14.
Figure 5. hsp‐60 is required for increased PA14 resistance and PMK‐1 activity in tir‐1(gf) animals.
- Induction of T24B8.5p::GFP conferred by a tir‐1 gain‐of‐function (gf) mutation (yz68) was largely suppressed by knockdown of hsp‐60. Scale bar indicates 200 μm.
- Quantification of data in panel (A) (n ≥ 20). Error bars represent SEM. P‐values were calculated by two‐tailed Student's t‐test (***P < 0.001).
- hsp‐60 RNAi largely suppressed the increased resistance of tir‐1(gf) mutants to PA14.
Increased expression of HSP‐60 is sufficient for enhancing immunity
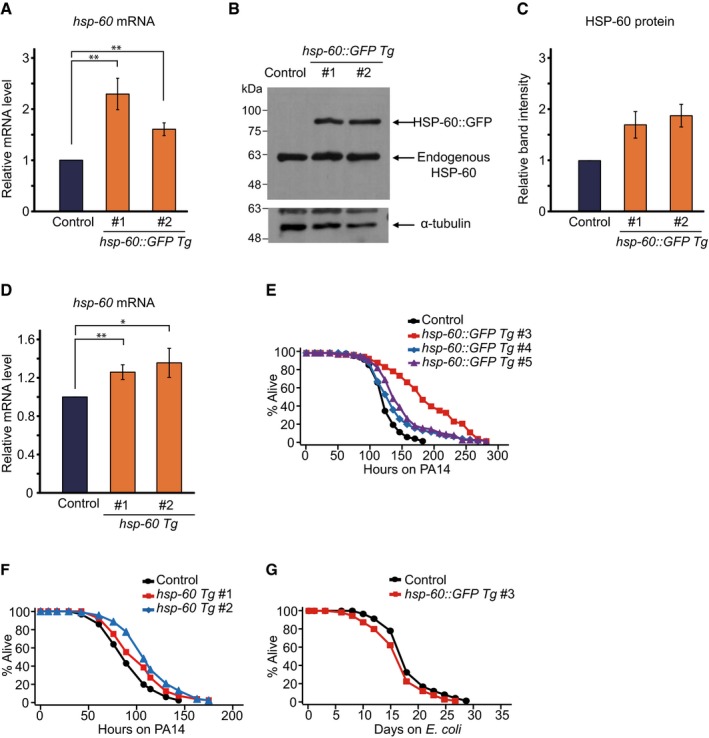
We then asked whether increased expression of hsp‐60 affected anti‐PA14 immunity by generating transgenic worms that expressed hsp‐60 with or without a GFP tag (hsp‐60::GFP Tg or hsp‐60 Tg). We first confirmed that these transgenes increased the levels of hsp‐60 mRNA (Fig EV3A and D) and HSP‐60::GFP protein (Fig EV3B and C). We then showed that the GFP‐fused HSP‐60 was mainly localized to the mitochondria of cells in multiple tissues (Fig 6A–F; but see also Fig 9B and legends). Importantly, both hsp‐60::GFP Tg and hsp‐60 Tg significantly increased resistance to PA14 (Figs 6G, and EV3E and F), which was abolished by hsp‐60 RNAi (Fig 6H). The lifespan on a standard E. coli diet was not extended by hsp‐60::GFP Tg (Figs 6I and EV3G), suggesting the specific role of hsp‐60 in survival upon PA14 infection.
Figure EV3. hsp‐60::GFP expression increases the survival of animals infected with PA14, while not extending lifespan.
-
AqRT–PCR results indicate that transgenic hsp‐60::GFP expression (hsp‐60::GFP Tg) increased the level of hsp‐60 mRNA in the two independent transgenic animals.
-
B, CWestern blot data show the levels of both endogenous HSP‐60 and GFP‐fused HSP‐60 in two independent transgenic lines (B). HSP‐60 antibody was used for the detection of both endogenous and GFP‐fused HSP‐60. Total HSP‐60 protein levels were quantified by adding band intensities of endogenous HSP‐60 and GFP‐fused HSP‐60 (n = 2) (C).
-
DqRT–PCR data indicate that transgenic expression of hsp‐60 without a tag (hsp‐60 Tg) slightly but significantly increased the level of hsp‐60 mRNA in two independent lines of transgenic animals (#1 and #2; see Materials and Methods).
-
EThree independent lines (#3, #4, and #5; see Materials and Methods) of transgenic animals that carried extrachromosomal arrays of hsp‐60::GFP (hsp‐60::GFP Tg) displayed significant increases in resistance to PA14 (P < 0.001). We noticed that the effects of hsp‐60::GFP Tg #4 and #5 on the survival of worms on PA14 were smaller than those of hsp‐60::GFP Tg #3. We currently do not know the basis of this variability among the transgenic lines.
-
FTwo independent lines of transgenic animals with extrachromosomal arrays of hsp‐60 (hsp‐60 Tg #1 and #2) showed significant increases in PA14 resistance (P < 0.01 and P < 0.001, respectively). The effects of hsp‐60 Tg on PA14 resistance tend to be smaller than those of hsp‐60::GFP Tg (Fig 6G). Note that the levels of hsp‐60 mRNA were significantly increased by 1.2‐ to 1.4‐fold in hsp‐60 Tg animals and by 2.3‐fold in hsp‐60::GFP Tg animals (A and B). Thus, it seems likely that the levels of hsp‐60 mRNA correlate with the survival time of animals on PA14.
-
GA line of transgenic animals with an extrachromosomal array of hsp‐60::GFP (#3) lived slightly shorter than control animals on Escherichia coli (OP50).
Figure 6. Increased expression of hsp‐60 is sufficient for increasing immunity against PA14.

-
A, BGFP fluorescence images of L4 larval animals that expressed hsp‐60::GFP. GFP expression was observed in multiple tissues including neurons, the hypodermis, the muscles (A), and the intestine (B). Scale bar indicates 100 μm.
-
C–FImages of an L2 larval animal expressing HSP‐60::GFP driven by an hsp‐60 promoter. HSP‐60::GFP (C) and MitoTracker that stained mitochondria (D) were co‐localized (E). Boxed areas were magnified in each panel. Scale bars indicate 10 μm. (F) HSP‐60::GFP and MitoTracker signals (arbitrary units) in the boxed area in panel (E) showed significant correlation (Pearson's correlation coefficient: r = 0.917, P < 0.001). We also found that correlation between HSP‐60::GFP and MitoTracker signals was significant by using the images of all 12 animals (Pearson's correlation coefficient: r = 0.906, P < 0.001).
-
GTwo independent integrant lines of animals that expressed hsp‐60::GFP (hsp‐60::GFP Tg) were resistant to PA14.
-
Hhsp‐60 RNAi abolished the increased survival of hsp‐60::GFP Tg animals on PA14.
-
Ihsp‐60::GFP Tg animals lived slightly shorter on a normal Escherichia coli (OP50) diet.
-
JDay 6 post‐reproductive hsp‐60::GFP Tg animals displayed increased survival on PA14 without 5‐fluoro‐2′‐deoxyuridine (FUdR) treatment.
Figure 9. A fraction of HSP‐60 is localized in the cytosol and physically interacts with SEK‐1.

-
A, BWestern blot analyses showed that endogenous HSP‐60 (A) and GFP‐fused HSP‐60 (B) were detected in both mitochondrial (MT) and post‐mitochondrial supernatant (PMS) fractions upon infection with PA14 for 12 h. WCL indicates whole‐cell lysate. α‐tubulin and VDAC‐1 were used as markers of PMS and mitochondria, respectively. The blots in these two panels are representative ones out of five (A) and three repeats (B), respectively. Note that the levels of HSP‐60 in the PMS were reproducibly higher than those in MT, but the majority of GFP‐fused HSP‐60 signals are localized to mitochondria (Fig 6C–F). It seems likely that the volume of the mitochondria is smaller than that of the non‐mitochondrial parts, and this may underlie the strong GFP‐fused HSP‐60 signals in the mitochondria.
-
C–EImages of an L2 larval animal expressing HSP‐60::GFP lacking mitochondrial targeting sequence at the N‐terminus (cytHSP‐60::GFP) driven by an hsp‐60 promoter. cytHSP‐60::GFP (C) was not co‐localized with mitochondria stained by using MitoTracker (D) as shown in the merged image (E). Scale bar indicates 25 μm.
-
FThree independent lines of transgenic animals that expressed cythsp‐60::GFP (cythsp‐60::GFP Tg) were resistant to PA14 infection. The transgenic animals that expressed hsp‐60::GFP with intact mitochondrial targeting sequence (hsp‐60::GFP Tg) were used as a positive control.
-
G–IBright field (G) and fluorescence (H) images of the animals that expressed an N‐terminal GFP fragment fused with HSP‐60 (HSP‐60::spGFPN) and/or a C‐terminal GFP fragment fused with SEK‐1 (SEK‐1::spGFPC) driven by an intestine‐specific vha‐6 promoter. Among siblings from the same hermaphrodite, transgenic animals that expressed both HSP‐60::spGFPN and SEK‐1::spGFPC displayed the GFP signals in the cytosol (I) (n = 10). Arrowheads indicate odr‐1p::RFP, a co‐injection marker for HSP‐60::spGFPN. Arrows indicate coel::RFP, a co‐injection marker for SEK‐1::spGFPC. Scale bars indicate 50 μm.
-
J, KRepresentative bright field (J) and fluorescence (K) images of the animals that expressed HSP‐60::spGFPN and/or C‐terminal GFP fragment (spGFPC) driven by the intestine‐specific vha‐6 promoter. None of these transgenic animals displayed green fluorescence signals. Arrowheads indicate odr‐1p::RFP, a co‐injection marker for HSP‐60::spGFPN. Arrows indicate coel::RFP, a co‐injection marker for spGFPC. Scale bars indicate 50 μm.
As overexpression of exogenous proteins in subcellular organelles can result in stresses (Gibson et al, 2013), we considered the possibility that transgenic expression of hsp‐60 may have elicited mitochondrial unfolded protein response (UPRMT) to increase immunity. Several lines of evidence argue against this possibility. First, overexpression of only GFP in mitochondria (GFPMT) driven by hsp‐60 promoter with mitochondria‐targeting sequence (MTS) of hsp‐60 (Appendix Fig S3A–C) did not increase the survival of animals on PA14 (Appendix Fig S3D). Second, hsp‐60::GFP transgenes did not affect the expression of hsp‐6 (Appendix Fig S4A), another mitochondrial chaperone that is induced by UPRMT (Yoneda et al, 2004). Third, hsp‐60::GFP transgenes had little effect on development, whereas mitochondrial stresses caused by treatment with spg‐7/spastic paraplegia‐7 RNAi or cco‐1/cytochrome C oxidase‐1 RNAi, or with ethidium bromide (EtBr) substantially delayed the development (Appendix Fig S4B and C). hsp‐60::GFP Tg animals displayed impaired reproduction, which is known to correlate with increased resistance against PA14 (Miyata et al, 2008). However, day 6 post‐reproductive hsp‐60::GFP Tg animals displayed increased survival on PA14, suggesting that hsp‐60::GFP transgene‐mediated PA14 resistance is not due to reduced fertility (Fig 6J). Together, these data suggest that enhanced survival on PA14 by increased expression of hsp‐60 is not due to overexpression artifacts or reduced fertility.
Increased expression of HSP‐60/HSPD1 up‐regulates PMK‐1 signaling
We asked whether the PMK‐1 signaling pathway mediated the effect of hsp‐60 on immunity. We found that hsp‐60::GFP transgenes induced three PMK‐1 downstream genes, in a pmk‐1‐dependent manner (Fig 7A–C). hsp‐60::GFP transgenes also increased the level of active phospho‐PMK‐1 (Fig 7D and Appendix Fig S5A). These data suggest that increased HSP‐60 levels are sufficient for up‐regulating PMK‐1 signaling.
Figure 7. HSP‐60 up‐regulates PMK‐1 signaling and immunity against PA14 via SEK‐1/MKK3.
-
A–CqRT–PCR analysis showed that three selected PMK‐1 target genes, T24B8.5 (A), C17H12.8 (B) and K08D8.5 (C), were induced by hsp‐60::GFP Tg in a pmk‐1‐dependent manner without PA14 infection (n = 4).
-
Dhsp‐60::GFP Tg increased phospho‐PMK‐1 (p‐PMK‐1) level. α‐tubulin was used as a loading control. GFP antibody was used for blotting HSP‐60::GFP. The numbers below bands indicate relative intensities of the p‐PMK‐1 normalized to those of α‐tubulin. The blot is a representative one out of four repeats that showed consistent results. See Appendix Fig S5A for quantification data.
-
EWestern blot analyses were carried out by using HeLa cells expressing a myc‐tagged human HSPD1 or a control plasmid (Empty: pcDNA3.1 pCMV‐MYC). HSPD1‐myc overexpression further increased the level of phospho‐p38 MAP kinase (p‐p38 MAPK), upon PA14 exposure for 2 h, but had little effect on the level of p38 MAP kinase (p38 MAPK). GAPDH was used as a loading control. HPI: hours post‐infection. The numbers indicate relative intensities of the phospho‐p38 MAPK level normalized to p38 MAPK level. The blot is a representative one of six repeats that showed consistent results. All six Western blot data are shown in the source data. See Appendix Fig S5B for quantification data.
-
F, GEnhanced PA14 resistance conferred by hsp‐60::GFP Tg was largely suppressed by pmk‐1(km25) mutation (F) or sek‐1(km4) mutation (G).
-
H, Ihsp‐60::GFP Tg increased the survival of animals fed with PA14 in nsy‐1(ok593) (H) and tir‐1(tm3036) (I) mutants.
-
J–LqRT–PCR analysis showed that sek‐1 mutations largely suppressed the induction of three selected PMK‐1 target genes, T24B8.5 (J), C17H12.8 (K) and K08D8.5 (L), by hsp‐60::GFP Tg without PA14 infection (n ≥ 3).
Mammalian HSPD1, the ortholog of C. elegans HSP‐60, is also crucial for protein quality control in mitochondria. Therefore, we asked whether the regulation of p38 MAPK signaling by HSPD1 was conserved in mammals. Overexpression of human HSPD1 accelerated the increase in the level of active phospho‐p38 MAPK in cultured human cells at 2 h post‐PA14 infection (HPI) (Fig 7E and Appendix Fig S5B). As p38 MAPK signaling plays key roles in mammalian immunity, this result raises a possibility that HSPD1/HSP‐60 exerts immune functions in mammals as well as in C. elegans.
HSP‐60 increases PA14 resistance via stabilization of SEK‐1/MKK3
We then examined the requirement of PMK‐1 signaling components pmk‐1, sek‐1/MKK3, nsy‐1/ASK1, and tir‐1/SARM for the effect of hsp‐60::GFP transgenes on susceptibility to PA14. We found that pmk‐1 or sek‐1 mutations largely suppressed the enhanced PA14 resistance conferred by hsp‐60::GFP transgenes (Fig 7F and G), whereas nsy‐1 or tir‐1 mutations did not (Fig 7H and I). sek‐1 mutations also largely suppressed the induction of PMK‐1‐regulated genes conferred by hsp‐60::GFP transgenes (Fig 7J–L). Thus, HSP‐60 appears to act upstream of SEK‐1 and PMK‐1 to confer anti‐PA14 resistance.
We further tested whether HSP‐60 regulated the level or the localization of SEK‐1 or PMK‐1 proteins using tagRFP fusions expressed in the intestine. Importantly, we found that hsp‐60::GFP transgenes increased the level of SEK‐1::tagRFP, whereas transgenic expression of only GFP in the mitochondria (GFPMT) did not (Fig 8A and B). We also showed that hsp‐60::GFP transgenes did not affect the level of PMK‐1::tagRFP (Fig 8C and D), or tagRFP in the intestine (Fig 8E and F). These data suggest that the increase in SEK‐1::tagRFP level by hsp‐60::GFP transgenesis specific.
Figure 8. HSP‐60 stabilizes SEK‐1 in the cytosol of intestinal cells.

-
A, BRepresentative images of young adult animals expressing SEK‐1::tagRFP (A) driven by an intestine‐specific vha‐6 promoter in wild‐type, hsp‐60::GFP Tg or GFP MT Tg backgrounds. Quantification of data is shown in (B) (n ≥ 19 from two independent trials).
-
C, DRepresentative images of young adult animals expressing PMK‐1::tagRFP (C) driven by an intestine‐specific vha‐6 promoter in wild‐type, hsp‐60::GFP Tg or GFP MT Tg backgrounds. Quantification of data is shown in (D) (n ≥ 22 from two independent trials).
-
E, FRepresentative images of young adult animals expressing tagRFP (E) driven by an intestine‐specific vha‐6 promoter in wild‐type, hsp‐60::GFP Tg or GFP MT Tg backgrounds. Quantification of data is shown in (F) (n ≥ 28 from two independent trials).
HSP‐60 in the cytosol binds SEK‐1/MKK3 and confers PA14 resistance
We then asked how mitochondrial HSP‐60 increased the level of cytosolic SEK‐1. A fraction of HSP‐60 in yeast and cultured mammalian cells is known to be localized in the cytosol (Soltys & Gupta, 1996; Chun et al, 2010; Kalderon et al, 2015). Thus, we tested the possibility that a fraction of C. elegans HSP‐60 in the cytosol up‐regulated SEK‐1. We first found that both endogenous and GFP‐fused HSP‐60 proteins were detected in the cytosol as well as in the mitochondria (Fig 9A and B). We then determined the functional importance of the HSP‐60 in the cytosol, by expressing HSP‐60::GFP lacking MTS, which was indeed localized in the cytosol (cytHSP‐60::GFP; Fig 9C–E). Importantly, we found that this cythsp‐60::GFP enhanced PA14 resistance (Fig 9F).
Next, we asked whether the cytosolic HSP‐60 physically interacted with SEK‐1 by using a split GFP (spGFP) system (Ghosh et al, 2000; Hu et al, 2002; Zhang et al, 2004; Feinberg et al, 2008; Hiatt et al, 2008; Shyu et al, 2008). We detected green fluorescent signals in transgenic animals that expressed both N‐terminal GFP fragment (spGFPN)‐fused HSP‐60 and C‐terminal GFP fragment (spGFPC)‐fused SEK‐1 (Fig 9G and H). This result indicates that HSP‐60 binds SEK‐1 (Fig EV4A). We used spGFPC fused with mitochondrial chaperone Y22D7AL.10, whose mammalian homolog HSPE1 interacts with HSPD1/HSP60 in the mitochondria (Bukau & Horwich, 1998) and spGFPC, respectively, as positive and negative controls for HSP‐60 binding (Figs EV4B–D, and 9J and K). We also noticed that the green fluorescence signals were located in the cytosol in the transgenic animals expressing spGFPN‐fused HSP‐60 and spGFPC‐fused SEK‐1 (Fig 9I). These results are consistent with the possibility that HSP‐60 binds SEK‐1 in the cytosol and stabilizes SEK‐1. Altogether, our data suggest that HSP‐60 in the cytosol binds and stabilizes SEK‐1 to confer anti‐bacterial defense in host animals.
Figure EV4. HSP‐60 and Y22D7AL.10/HSPE1 physically interact with each other.

-
AA schematic showing in vivo protein interaction using split GFP (spGFP) systems shown in Fig 9G–I. Physical interaction between HSP‐60 and SEK‐1 leads to the emission of green fluorescence.
-
B–DBright field (B) and fluorescence (C) images of the animals that expressed an N‐terminal GFP fragment fused with HSP‐60 (HSP‐60::spGFPN) and/or a C‐terminal GFP fragment fused with Y22D7AL.10 (Y22D7AL.10::spGFPC) driven by an intestine‐specific vha‐6 promoter. Among siblings from the same hermaphrodite, transgenic animals that expressed both HSP‐60::spGFPN and Y22D7AL.10::spGFPC displayed GFP signals (C) (n = 5). The GFP signals were concentrated in punctae (D), which appear to be mitochondria. Arrowheads indicate odr‐1p::RFP, a co‐injection marker for HSP‐60::spGFPN. Arrows indicate coel::RFP, a co‐injection marker for Y22D7AL.10::spGFPC. Scale bars indicate 50 μm.
Discussion
In this report, we showed that the mitochondrial chaperone HSP‐60 was necessary and sufficient for increasing immunity against P. aeruginosa by up‐regulation of SEK‐1/PMK‐1 signaling. It is surprising that a single mitochondrial chaperone acted as the key effector and mediated immune signaling for the host defense. One possibility is that inhibition of mitochondrial chaperones impairs overall mitochondrial function, which in turn leads to reduced immunity against bacterial pathogens. However, this seems unlikely because genetic modulation that decreases mitochondrial function can actually increase anti‐bacterial immunity (Hwang et al, 2014; Pellegrino et al, 2014). In addition, our data using hsp‐60::GFP transgenic animals indicate that HSP‐60 was sufficient to enhance immunity and immune‐regulatory SEK‐1/PMK‐1 signaling. Thus, HSP‐60 appears to increase SEK‐1/PMK‐1 pathway in the cytosol to modulate immunity against bacterial pathogens.
Our data suggest that HSP‐60 located in the cytosol can play a role in immune responses. The effects of cytosolic HSP‐60 on immunity led us to speculate that PA14 infection stress might trigger the translocation of HSP‐60 from mitochondria to the cytosol. However, it does not seem to be the case, because PA14 infection did not alter the level of cytosolic HSP‐60 or the ratio of cytosolic/mitochondrial HSP‐60 levels (Figs 9A and B, and EV5A–C). In addition, cytosolic GFP signals obtained from the interaction between HSP‐60::spGFPN and SEK‐1::spGFPC were not increased by PA14 (Fig EV5D). These data suggest that a fraction of HSP‐60 is localized in the cytosol under normal conditions and maintains SEK‐1/PMK‐1 signaling. A recent study using yeast showed that cytosolic HSP‐60 inhibits 20S proteasome activity (Kalderon et al, 2015) in a chaperone function‐independent manner. It will be interesting to test whether HSP‐60 up‐regulates SEK‐1 through its chaperone function or through the inhibition of proteasome activity in C. elegans.
Figure EV5. PA14 infection does not alter the subcellular distribution of HSP‐60.

-
A, BTime‐course data of the PA14 infection followed by subcellular fractionation and Western blot analyses indicate that the level of HSP‐60 in post‐mitochondrial supernatant (PMS) was not significantly changed by PA14 infection (n = 4). The levels of HSP‐60/α‐tubulin in the PMS were quantified at different time points of PA14 infection as indicated. WCL and MT indicate whole‐cell lysate and mitochondria, respectively. α‐tubulin and VDAC‐1 were used as markers for the PMS and mitochondria, respectively. HPI: hours postPA14 infection.
-
CRelative cytosolic/mitochondrial HSP‐60 levels were quantified from the Western blot data in Fig 9A (n = 3). The ratio of cytosolic and mitochondrial HSP‐60 was not significantly changed by PA14 infection (12 h).
-
DBright field (left) and fluorescence (right) images of double transgenic animals that expressed both HSP‐60::spGFPN and SEK‐1::spGFPC in the intestine. PA14 infection for 12 h did not increase the fluorescent signals. Scale bars indicate 50 μm.
Intriguingly, a fraction of HSPD1/HSP60 in mammalian cells is shown to be localized in the extracellular space as well (Gupta & Knowlton, 2007; Cappello et al, 2008; Swaroop et al, 2016). Therefore, HSP‐60 that is secreted to the extracellular space may also mediate immunity perhaps by acting as a cell‐nonautonomous infection signal. We tested this possibility by measuring the tagRFP‐fused HSP‐60 signals in coelomocytes, which take up secreted proteins in C. elegans (Fares & Greenwald, 2001). We therefore expressed HSP‐60::tagRFP specifically in the intestine or neurons, but did not detect the RFP signals in the coelomocytes (Appendix Fig S6A–D). Thus, we currently do not have data supporting the secretion of HSP‐60 to extracellular space in C. elegans.
PA14 infection triggers mitochondrial stresses in C. elegans, and this in turn increases the level of HSP‐60 at the transcription level through UPRMT (Pellegrino et al, 2014). One interesting finding of our current study was that some components of UPRMT, including DVE‐1 and UBL‐5, were required for the up‐regulation of PMK‐1, whereas other components, HAF‐1 and ATFS‐1, were not (Fig EV2E and F). This is actually consistent with the previous report showing that ATFS‐1 enhances immunity against PA14 by the induction of anti‐microbial genes independently of PMK‐1 (Pellegrino et al, 2014). Thus, different UPRMT components (e.g., ATFS‐1 vs. HSP‐60) appear to exert anti‐bacterial functions via distinct immune signaling axes. In addition, Pellegrino et al (2014) concluded that activation of UPRMT increases immunity independently of PMK‐1, based on the results showing that RNAi targeting spg‐7 increases the survival of pmk‐1 mutants as well as wild‐type animals on PA14. However, spg‐7 RNAi up‐regulates many stress‐responsive genes other than mitochondrial chaperones and increases lifespan (Curran and Ruvkun, 2007; Chen et al, 2007; Nargund et al, 2012). Thus, spg‐7 RNAi may increase the survival of pmk‐1 mutants through the activation of longevity and stress‐responsive pathways independently of pmk‐1 signaling. Overall, UPRMT appears to regulate at least two branches of anti‐PA14 immune responses; one pathway acts through the induction of PMK‐1‐independent anti‐microbial genes and the other pathway acts through the induction of mitochondrial chaperone genes, including hsp‐60 that increases immunity via pmk‐1 signaling.
The potential regulatory role of HSPD1/HSP60 in p38 MAP kinase‐dependent innate immune responses in mammals has been reported, but several key findings have been controversial. Treatment of immune cells such as macrophages and monocytes with recombinant human HSPD1/HSP60 (rhHSP60) purified from bacteria induces inflammatory cytokines (Chen et al, 1999), whose pro‐inflammatory effects act through Toll‐like receptor 4 (TLR4) and p38 MAP kinase signaling (Kol et al, 2000; Ohashi et al, 2000). However, several of these findings have been challenged by a report showing that the effects of the rhHSP60 were due to contamination with lipopolysaccharide (LPS) during protein purification processes from bacteria (Gao & Tsan, 2003). This finding has been supported by a subsequent study showing that a domain of HSPD1/HSP60 tightly binds to LPS (Habich et al, 2005). As LPS is a ligand for TLR4 and activates p38 MAP kinase signaling (O'Neill et al, 2013), the rhHSP60‐dependent regulation of p38 MAP kinase signaling and immune functions remained controversial (Tsan & Gao, 2009; Quintana & Cohen, 2011). Our current study provides crucial in vivo evidence for addressing this issue. First, our data with hsp‐60 RNAi indicate that endogenous HSPD1/HSP60 is required for the maintenance of p38 MAP kinase signaling. Second, we showed that genetic up‐regulation of HSP60/HSPD1, which is free from LPS contamination, increased p38 MAP kinase signaling both in C. elegans, and cultured mammalian cells. Thus, our study strongly supports the notion that HSPD1/HSP60 enhances immunity.
Mammalian HSPD1/HSP60 elicits immune responses via immune regulators other than p38 MAP kinase signaling as well. The induction of mitochondrial HSPD1/HSP60 is implicated in TNF‐α‐mediated activation of NF‐κB, a key immunity transcription factor in mammalian cells (Amberger et al, 1997; Chun et al, 2010). HSPD1/HSP60 activates interferon‐regulatory factor 3 (IRF3) and increases interferon production in cultured cells (Lin et al, 2014). Overall, these studies and our current work suggest that both C. elegans and mammals share common mechanisms that employ the mitochondrial chaperone HSP‐60/HSPD1 to boost immunity.
Materials and Methods
Caenorhabditis elegans strains
All strains were maintained as previously described (Stiernagle, 2006). Some strains were obtained from Caenorhabditis Genetics Center, which is funded by the NIH National Center for Resources (P40 OD010440). Strains analyzed in this study were listed as follows: N2 wild‐type, IJ130 pmk‐1(km25) IV obtained by outcrossing KU25 four times to Lee laboratory N2, IJ134 zip‐2(tm4067) III obtained by outcrossing TM4067 four times to Lee laboratory N2, IJ382 daf‐16(mu86) I obtained by outcrossing CF1042 six times to Kenyon laboratory N2, which is the same as Lee laboratory N2, AU78 agIs219[T24B8.5p::GFP] a gift from D.H. Kim laboratory, AU133 agIs17[irg‐1p::GFP] a gift from E. Troemel laboratory, CL2166 dvIs19[gst‐4p::GFP::NLS], CF1553 muIs84[sod‐3p::gfp], WM27 rde‐1(ne219) V, VP303 rde‐1(ne219) V; kzIs7[nhx‐2p::rde‐1; rol‐6(su1006)], NR350 rde‐1(ne219) V; kzIs20[hlh‐1p::rde‐1; sur‐5p::NLS::GFP], NR222 rde‐1(ne219) V; kzIs9[lin‐26p::rde‐1; lin‐26p::nls::GFP; rol‐6(su1006)], NL3321 sid‐1(pk3321) V, TU3401 sid‐1(pk3321) V; uIs69[myo‐2p::mCherry; unc‐119p::sid‐1], IJ574 haf‐1(ok705) V obtained from outcrossing RB867 four times to Lee laboratory N2, IJ575 atfs‐1(gk3094) V obtained from outcrossing VC3201 four times to Lee laboratory N2, IJ283 tir‐1(yz68) III obtained from outcrossing tir‐1(yz68), a gift from J.Y. Sze laboratory, four times to Lee laboratory N2, IJ698 haf‐1(ok705) V; agIs219[T24B8.5p::GFP; ttx‐3p::GFP], IJ702 atfs‐1(gk3094) V; agIs219[T24B8.5p::GFP; ttx‐3p::GFP], IJ819 tir‐1(yz68) III; agIs219[T24B8.5p::GFP; ttx‐3p::GFP], AY101 acIs101[F35E12.5p::GFP; rol‐6(su1006)], IJ530 yhEx121[odr‐1p::RFP], IJ788 yhEx188[hsp‐60p::hsp‐60::GFP; odr‐1p::RFP] marked as #3 in Fig EV3E and G, IJ789 yhEx189[hsp‐60p::hsp‐60::GFP; odr‐1p::RFP] marked as #4 in Fig EV3E, IJ790 yhEx190[hsp‐60p::hsp‐60::GFP; odr‐1p::RFP] marked as #5 in Fig EV3E, IJ939 yhIs62[hsp‐60p::hsp‐60::GFP; odr‐1p::RFP] marked as #1 in Figs 6G–I and EV3A–C, obtained from integration of yhEx188 and subsequent outcrossing four times to Lee laboratory N2, IJ940 yhIs63[hsp‐60p::hsp‐60::GFP; odr‐1p::RFP] marked as #2 in Figs 6G–I and EV3A–C, obtained from integration of yhEx188 and subsequent outcrossing four times to Lee laboratory N2, IJ1141 yhEx253[hsp‐60p::GFP MT ; odr‐1p::RFP] marked as GFP MT Tg #1 in Appendix Fig S3D, IJ1142 yhEx254[hsp‐60p::GFP MT ; odr‐1p::RFP] marked as GFP MT Tg #2 in Appendix Fig S3D, IJ1143 yhEx255[hsp‐60p::GFP MT ; odr‐1p::RFP] marked as GFP MT Tg #3 in Appendix Fig S3D, IJ941 pmk‐1(km25) IV; yhIs62[hsp‐60p::hsp‐60::GFP; odr‐1p::RFP], IJ1324 sek‐1(km4) X; yhIs62[hsp‐60p::hsp‐60::GFP; odr‐1p::RFP], IJ1325 nsy‐1(ok593) II; yhIs62[hsp‐60p::hsp‐60::GFP; odr‐1p::RFP], IJ942 tir‐1(tm3036) III; yhIs62[hsp‐60p::hsp‐60::GFP; odr‐1p::RFP], IJ1307 yhEx332[vha‐6p::tagRFP; ofm‐1p::GFP], IJ1310 yhEx335[vha‐6p::pmk‐1::tagRFP; ofm‐1p::GFP], IJ1313 yhEx338[vha‐6p::sek‐1::tagRFP; ofm‐1p::GFP], IJ1360 yhIs62[hsp‐60p::hsp‐60::GFP; odr‐1p::RFP]; yhEx332[vha‐6p::tagRFP; ofm‐1p::GFP], IJ1361 yhIs62[hsp‐60p::hsp‐60::GFP; odr‐1p::RFP]; yhEx335[vha‐6p::pmk‐1::tagRFP; ofm‐1p::GFP], IJ1362 yhIs62[hsp‐60p::hsp‐60::GFP; odr‐1p::RFP]; yhEx338[vha‐6p::sek‐1::tagRFP; ofm‐1p::GFP], IJ1363 yhEx253[hsp‐60p::GFP MT ; odr‐1p::RFP]; yhEx332[vha‐6p::tagRFP; ofm‐1p::GFP], IJ1364 yhEx253[hsp‐60p::GFP MT ; odr‐1p::RFP]; yhEx335[vha‐6p::pmk‐1::tagRFP; ofm‐1p::GFP], IJ1365 yhEx253[hsp‐60p::GFP MT ; odr‐1p::RFP]; yhEx338[vha‐6p::sek‐1::tagRFP; ofm‐1p::GFP], IJ650 yhEx153[fasn‐1p::GFP; odr‐1p::RFP], IJ1464 yhEx399[hsp‐60p::hsp‐60; fasn‐1p::GFP] marked as hsp‐60 Tg #1 in Fig EV3D and F, IJ1464 yhEx399[hsp‐60p::hsp‐60; fasn‐1p::GFP] marked as hsp‐60 Tg #2 in Fig EV3D and F, IJ1169 yhEx260[hsp‐60p::cythsp‐60::GFP; odr‐1p::RFP] marked as cythsp‐60::GFP Tg #1 in Fig 9F, IJ1170 yhEx261[hsp‐60p::cythsp‐60::GFP; odr‐1p::RFP] marked as cythsp‐60::GFP Tg #2 in Fig 9F, IJ1171 yhEx262[hsp‐60p::cythsp‐60::GFP; odr‐1p::RFP] marked as cythsp‐60::GFP Tg #3 in Fig 9F, IJ1420 yhEx381[vha‐6p::hsp‐60::tagRFP; odr‐1p::RFP], IJ1423 yhEx384[unc‐119p::hsp‐60::tagRFP; fasn‐1p::GFP], IJ1436 yhEx389[vha‐6p::hsp‐60::spGFPN; odr‐1p::RFP]; yhEx391[vha‐6p::sek‐1::spGFPC; coel::RFP], IJ1438 yhEx389[vha‐6p::hsp‐60::spGFPN; odr‐1p::RFP]; yhEx395[vha‐6p::spGFPC; coel::RFP], IJ1441 yhEx389[vha‐6p::hsp‐60::spGFPN; odr‐1p::RFP]; yhEx397[vha‐6p:: Y22D7AL.10::spGFPC; coel::RFP].
Selection of evolutionarily conserved mitochondrial genes
By using the HomoloGene (build 25) database of NCBI (National Center for Biotechnology Information), a total of 3,147 C. elegans genes that have single orthologous human genes were selected (WormBase web site, http://www.wormbase.org, WS229, released on December 15th, 2011). When more than two C. elegans genes were matched to a single human gene, these genes were excluded from further study to avoid potential limitations in data interpretation due to genetic redundancy. Subsequently, 313 mitochondrial genes were selected for the ones that were annotated with mitochondria in human MitoCarta database (Pagliarini et al, 2008) (https://www.broadinstitute.org/pubs/MitoCarta/human.mitocarta.html) and with mitochondrial Gene Ontology terms (Ashburner et al, 2000; Gene Ontology Consortium, 2015); 0000266 (mitochondrial fission), 0005739 (mitochondrion), 0005740 (mitochondrial envelope), 0005741 (mitochondrial outer membrane), 0005743 (mitochondrial inner membrane), 0005759 (mitochondrial matrix), 0008053 (mitochondrial fusion), 0030061 (mitochondrial crista), 0031966 (mitochondrial membrane), and 0044429 (mitochondrial part) from “gene_info” file and “gene2go” file of NCBI FTP database.
RNAi screen
RNAi clones targeting 244 genes of the 313 mitochondrial genes that we selected were available in two commercial C. elegans RNAi feeding libraries generated by Ahringer laboratory (Geneservice Ltd., Cambridge, UK) or by Vidal laboratory (Source BioScience, Nottingham, UK). We initially tested these 244 RNAi clones for developmental phenotypes and selected 220 RNAi clones that did not cause severe developmental delay or lethality for further studies (see Dataset EV1). RNAi bacteria were cultured overnight at 37°C in Luria Broth (LB) media containing 50 μg/ml ampicillin (USB, Santa Clara, CA, USA), seeded onto nematode‐growth media (NGM) containing 50 μg/ml ampicillin, and then incubated overnight at 37°C. The bacteria were treated with 1 mM isopropyl β‐D‐1‐thiogalactopyranoside (IPTG: GOLDBIO, St. Louis, MO, USA) overnight at 37°C for the induction of double‐stranded RNA (dsRNA). Wild‐type N2 worms were then fed with the RNAi bacteria and grown to L4 or young adult stages. Approximately 100 worms at L4 or young adult stage were subjected to PA14 standard slow killing assays at 25°C (see pathogen killing assays described below for detail). Worms that were moving were counted as alive every 12–24 h until all the worms were dead. From our initial screen, we chose 46 out of the 220 RNAi clones that substantially altered the susceptibility of animals to PA14 infection (arbitrary cutoff: % change in mean survival vs. control group > ±10%, P‐value < 0.001). Subsequent experiments confirmed that 16 RNAi clones reproducibly increased or decreased the survival of wild‐type animals on PA14. OASIS (Online Application of Survival analysIS, http://sbi.postech.ac.kr/oasis) was used for statistical analysis of survival data, and P‐values were calculated by using log‐rank (Mantel–Cox method) test (Yang et al, 2011).
Characterization and clustering analysis of candidate genes
Changes in mean survival and GFP reporter levels for known immune effectors were measured for the initial analysis of the 16 RNAi clones obtained from our screen. First, upon knocking down each of the 16 RNAi clones, two independent trials of PA14 standard slow killing assays were performed by using worms in different genetic backgrounds; pmk‐1(km25), zip‐2(tm4067), and daf‐16(mu86). OASIS (http://sbi.postech.ac.kr/oasis) was used for statistical analysis of survival data, which uses log‐rank (Mantel–Cox method) test for calculating P‐values (Yang et al, 2011). Second, GFP reporter transgenic animals for known immune effector proteins (T24B8.5p::GFP for PMK‐1, irg‐1p::GFP for ZIP‐2, gst‐4p::GFP for SKN‐1, and sod‐3p::GFP for DAF‐16) were fed with the RNAi bacteria from egg to L4 or young adult stages and subsequently transferred to the corresponding dsRNA‐expressing E. coli‐ or PA14‐seeded plates. After 24 h, the effects of each of the 16 RNAi clones on the expression of the GFP reporters were scored by three researchers at least three times independently. By using Cluster 3.0 (de Hoon et al, 2004), the genes were hierarchically clustered (clustering method: complete linkage, similarity matrix: City Block) based on the effects of RNAi clones on the survival of animals on PA14 and the GFP reporter expression as shown in the heat maps (Fig 1C and D).
Pathogen killing assays
PA14 standard slow killing assay was performed as previously described (Reddy et al, 2009) with minor modifications. PA14 was cultured in LB media at 37°C overnight, and 5 μl of the culture was seeded onto the center of the NGM plates containing 0.35% peptone. PA14‐seeded plates were then incubated at 37°C for 24 h and stored at room temperature for at least 8 h before use. Worms were grown from egg to L4/young adult stages on RNAi bacteria‐ or OP50‐seeded plates at 20°C. The worms were then transferred to PA14‐seeded plates containing 50 μM 5‐fluoro‐2′‐deoxyuridine (FUdR; Sigma, St Louis, MO, USA, or bioWORLD, Dublin, OH, USA), which prevents progeny from hatching, at 25°C. The worms were scored twice or three times a day and counted as dead if the worms did not respond to prodding. For PA14 killing assays without FUdR, the animals were transferred twice a day to fresh PA14‐seeded plates for removing the progeny. Animals that showed internal hatching were counted as dead, while those that crawled off the plates, exploded or burrowed were censored but included in the subsequent statistical analysis. OASIS (http://sbi.postech.ac.kr/oasis) was used for statistical analysis of survival data, and P‐values were calculated by using log‐rank (Mantel–Cox method) test (Yang et al, 2011). Pathogen resistance assays against E. faecalis or pathogenic E. coli were performed as previously described (Garsin et al, 2001; Hwang et al, 2014).
Microscopy
Transgenic animals that expressed GFP or tagRFP were anesthetized by using 100 mM sodium azide (DAEJUNG, Siheung, Korea) and subsequently imaged by using AxioCam HRc (Zeiss Corporation, Jena, Germany) camera mounted on a Zeiss Axioscope A.1 microscope (Zeiss Corporation, Jena, Germany). The fluorescence intensity of the animals was quantified by using ImageJ software (Rasband, W.S., ImageJ, U. S. National Institutes of Health, Bethesda, MD, USA, http://rsb.info.nih.gov/ij/) and displayed by using GraphPad Prism 7 software (http://www.graphpad.com/scientific-software/prism/). Mitochondrial staining with MitoTracker Red CMXRos (catalogue number: M7512, Life Technologies™, Eugene, OR, USA) was conducted as described previously (Govindan et al, 2015) with minor modifications. The MitoTracker was added to OP50‐seeded NGM plates at a final concentration of 10 μM. After the plates were dried, hsp‐60p::hsp‐60::GFP, hsp‐60p::GFP MT, and hsp‐60p::cythsp‐60::GFP worms were transferred to the plates. Six hours after this initial transfer, the animals were transferred again to fresh OP50‐seeded NGM plates to remove the MitoTracker from the intestinal lumen for 1–2 h. The animals were subsequently transferred onto a 2% agarose pad and were photographed by using the Nikon A1si/Ni‐E upright confocal microscope with 60×, 1.4 NA oil‐immersion objective lens. Confocal microscopy data were acquired at the Advanced Neural Imaging Center in Korea Brain Research Institute (KBRI). To measure developmental rates, synchronized wild‐type eggs were grown on control, spg‐7, or cco‐1 RNAi bacterial plates or EtBr (30 μg/ml)‐treated control RNAi bacterial plates for 3 days. The eggs of hsp‐60p::hsp‐60::GFP worms were grown on control RNAi plates for 3 days. The images of the animals on the plates were captured by using a DIMIS‐M camera (Siwon Optical Technology, Anyang, Korea).
Intestinal PA14‐GFP accumulation assays
Intestinal PA14‐GFP accumulation assays were performed as previously described (Kim et al, 2002) with minor modification. To measure the amount of accumulated PA14 in the C. elegans intestine, L4 worms that were pre‐treated with control RNAi or hsp‐60 RNAi were infected with PA14 that expressed GFP (PA14‐GFP) for 48 h. Five microliters of overnight culture of PA14‐GFP in LB media containing 50 μg/ml kanamycin (Sigma, St Louis, MO, USA) was seeded onto the center of NGM plates that contained 0.35% peptone and 50 μM FUdR. Plates were incubated at 37°C for 24 h and then stored at room temperature at least for 8 h before use. P‐values were calculated by using chi‐squared test.
PA14 avoidance assays
PA14 avoidance assays were performed as previously described (Pradel et al, 2007; Gaglia et al, 2012) with some modifications. Wild‐type animals were allowed to develop on control or hsp‐60 RNAi bacteria from egg to L4 stages. Five microliters of overnight PA14 culture was seeded onto the center of 0.35% peptone NGM. Plates were incubated at 37°C for 24 h and subsequently at room temperature for over 8 h before use. At least 20 L4 stage worms were transferred to a control E. coli‐ or a PA14‐seeded plate, and the number of occupants on the bacterial lawn was counted at indicated time points.
Lifespan analyses
Lifespan analyses were performed as previously described (Lee et al, 2015). Briefly, synchronized wild‐type eggs were allowed to develop on control and hsp‐60 RNAi plates to young adult stage and then transferred to 5 μM FUdR‐containing control and hsp‐60 RNAi plates, respectively. The number of worms that were alive was counted at 2 or 3 day intervals. Control animals or transgenic animals that expressed hsp‐60p::hsp‐60::GFP were grown on OP50 plates and subjected to lifespan assays. odr‐1p::RFP (an injection marker) animals were used as a control for transgenic animals that expressed extrachromosomal arrays of hsp‐60p::hsp‐60::GFP or hsp‐60p::GFP MT. Wild‐type (N2) animals were used as a control for integrated lines of hsp‐60p::hsp‐60::GFP animals, as integrated lines of odr‐1p::RFP were not available. The animals that crawled off the plates, displayed ruptured vulvae, burrowed, or displayed internal hatching were censored but included in the subsequent statistical analysis. Statistical analysis of lifespan data was performed by using OASIS (http://sbi.postech.ac.kr/oasis), which calculates P‐values using log‐rank (Mantel–Cox method) test (Yang et al, 2011).
Western blot assays
Western blot assays were conducted as described previously (Hwang et al, 2014) with minor modifications. Synchronized eggs were placed on control RNAi, hsp‐60 RNAi, or pmk‐1 RNAi bacteria‐seeded NGM plates containing 50 μg/ml ampicillin and 1 mM IPTG. Worms were then allowed to develop to L4 or young adult animals. Mixed L4 and young adult animals were washed three times by using M9 buffer and subsequently transferred onto corresponding RNAi bacteria‐ or PA14‐seeded plates (0.35% peptone NGM plates). After 1 h of PA14 exposure, the worms were washed at least three times with M9 and immediately frozen in liquid nitrogen with 2× SDS sample buffer. The samples were subsequently boiled for 10 min at 95°C and vortexed for 10 min at room temperature for protein extraction. The lysates were further centrifuged for 30 min at 15,700 g, and supernatants without debris were used for 8% SDS–PAGE. After electrophoresis, proteins were transferred to PVDF membrane (Whatman Inc, Sanford, ME, USA). Five percent BSA or skim milk in TBS‐T [20 mM Tris–HCl (pH 7.6), 140 mM NaCl, 0.1% Tween‐20] was used for blocking the PVDF membrane for an hour. The PVDF membrane was then incubated with primary antibodies against α‐tubulin (1:1,000, Santa Cruz Biotechnology, sc‐32293, Dallas, TX, USA), phospho‐p38 MAPK (1:1,000, Cell Signaling, #9211, Beverly, MA, USA), HSP‐60 (1:100,000, Enzo Life Sciences, ADI‐SPA‐807, Farmingdale, NY, USA) or GFP (1:5,000, in‐house rabbit polyclonal antibody). Anti‐mouse secondary antibody conjugated with horseradish peroxidase (1:5,000, Thermo, Rockford, IL, USA) was used for detecting anti‐α‐tubulin, and anti‐rabbit secondary antibody (1:7,500, Thermo, Rockford, IL, USA) was used for detecting anti‐phospho‐p38 MAPK and anti‐GFP primary antibodies. The PVDF membrane was treated with chemoluminescent horseradish peroxidase substrate (Thermo, Rockford, IL, USA) for detecting protein bands. For Western blot analysis using transgenic animals overexpressing hsp‐60::GFP, synchronized eggs of wild‐type animals, pmk‐1 mutant animals, and the hsp‐60::GFP transgenic animals were allowed to develop to young adults on OP50 plates and then were harvested as described above after washing three times with M9 buffer. For Western blot assays using a cultured cell line, HeLa cells were maintained in DMEM (LonZa, Walkersville, MD, USA) supplemented with 10% fetal bovine serum (HyClone™, GE Healthcare Life Sciences, South Logan, UT, USA) and transfected with pCMV‐MYC or pCMV‐HSPD1‐MYC by using Effectene (Qiagen, Valencia, CA, USA) following the manufacturer's protocol. Primary antibodies against GAPDH (Merck Millipore, Darmstadt, Germany) and α‐tubulin (Santa Cruz, CA, USA) were used for the detection of GAPDH and α‐tubulin, respectively. MYC antibody (Santa Cruz, CA, USA) was used for the detection of MYC‐tagged HSPD1.
Fractionation of mitochondria
Mitochondrial fractionation was performed as previously described (Jonassen et al, 2002) with minor modifications. Experimental samples for synchronized wild‐type or hsp‐60p::hsp‐60::GFP animals under E. coli‐ or PA14‐fed conditions were prepared as described above. The animals were harvested after washing at least three times with M9 buffer. The worm samples were transferred to pre‐cooled mitochondria isolation buffer [MIB; 210 mM mannitol, 70 mM sucrose, 0.1 mM EDTA, 5 mM Tris–HCl (pH 7.4), 1 mM PMSF] and then subjected to homogenization. The samples were homogenized by using pre‐cooled glass homogenizer with 20 strokes. The supernatants were transferred to new microtubes, and remaining worm pellets were resuspended with the MIB and homogenized. The supernatants were collected by centrifugation for 10 min at 800 relative centrifugal force (rcf), transferred to new microtubes and kept as whole‐cell lysates (WCL). The WCL were further centrifuged for 10 min at 22,250 g, and the supernatants were collected without touching the pellets and stored as post‐mitochondrial supernatants (PMS). Remaining pellets were resuspended with MIB and then centrifuged again at 22,250 g for 10 min. The supernatants were discarded, and remaining pellets were resuspended with MIB and stored as mitochondrial fraction (MT). Western blot analyses with WCL, PMS, and MT proteins were performed as described above. Primary antibodies against α‐tubulin (1:1,000, Santa Cruz Biotechnology, Dallas, TX, USA), VDAC‐1 (1:1,000, Santa Cruz Biotechnology, sc‐8828, Dallas, TX, USA), HSP‐60 (1:100,000, ADI‐SPA‐807, Enzo Life Sciences, Farmingdale, NY, USA), or GFP (1:5,000, in‐house rabbit polyclonal antibody) were used for the Western blot analyses.
RNA extraction and quantitative real‐time PCR
RNA extraction and qRT–PCR were performed as previously described with minor modifications (Seo et al, 2015). Worms fed with control RNAi, pmk‐1 RNAi, or hsp‐60 RNAi bacteria were grown to L4 stage and then transferred to PA14‐seeded plates after washing with M9 buffer 3–4 times. Wild‐type, pmk‐1(−), and sek‐1(−) animals or transgenic animals expressing hsp‐60p::hsp‐60::GFP were allowed to develop on OP50‐seeded plates to young (day 1) adults. Worms were harvested by washing three or four times with M9 buffer to remove residual bacteria 8 h after PA14 exposure. Total RNA in the animals was isolated by using RNAiso plus (Takara, Seta, Kyoto, Japan) and was used for synthesizing cDNA with ImProm‐II™ Reverse Transcriptase kit (Promega, Madison, WI, USA). Quantitative real‐time PCR was performed by using StepOne Real‐Time PCR System (Applied Biosystems, Foster City, CA, USA) as described in the manufacturer's protocol. Comparative C T method was used for the quantitative analysis of mRNAs. For all biological data sets, ama‐1 mRNA, which encodes an RNA polymerase II large subunit, was used as a normalization control. The primer sequences used for qRT–PCR analysis are as follows: 5′‐TGGAACTCTGGAGTCACACC (forward) and 5′‐CATCCTCCTTCATTGAACGG (reverse) for ama‐1, 5′‐TGTTAGACAATGCCATGATGAA (forward) and 5′‐ATTGGCTGTGCAGTTGTACC (reverse) for T24B8.5, 5′‐GAACAATAGTGTCAAGCCGATCTGC (forward) and 5′‐TTCTGAATGATGAATGCATGTTTAC (reverse) for C17H12.8 1, 5′‐TCTGGTCAAAATATCCTCCGGGAAG (forward) and 5′‐GAGCATCACTCGATTGATTGCAGTG (reverse) for K08D8.5, 5′‐GTTCAAAAGGACTTAAAGGTCGTTC (forward) and 5′‐ GGGAATACACTTTTCCTTGAGCCTC (reverse) for hsp‐6, 5′‐CTATGGGCCCAAAAGGAAGAAACGTG (forward) and 5′‐GGATTTCGCGACGGTGACTCCGTCC (reverse) for hsp‐60.
Generation of transgenic animals
To generate translational hsp‐60p::hsp‐60::GFP fusion construct, hsp‐60 cDNA fragment (hsp‐60cDNA) amplified from C. elegans cDNA was PCR‐fused with a 2 kb hsp‐60 promoter fragment (hsp‐60p) amplified from C. elegans genomic DNA. XbaI and XmaI sites were used to insert the hsp‐60p::hsp‐60cDNA fragment into a GFP‐containing pPD95.75 vector. Translational hsp‐60p::hsp‐60cDNA without a tag was generated by performing site‐directed mutagenesis to remove GFP from the hsp‐60p::hsp‐60::GFP‐containing vector. Only two different lines of transgenic hsp‐60p::hsp‐60cDNA animals, which displayed slight induction of hsp‐60 (Fig EV5B), were obtained over 150 microinjected animals with a low concentration of DNA (5 ng/μl). We therefore speculate that too high level of hsp‐60 may be toxic, and that may be the reason why obtaining hsp‐60‐overexpressing animals was difficult. To generate hsp‐60p::GFP MT construct, the 2 kb hsp‐60 promoter and the N‐terminal mitochondrial targeting sequence (MTS, predicted by MitoProt II) (Claros & Vincens, 1996) of hsp‐60 amplified from C. elegans genomic DNA was inserted into pPD95.75 vector by using EZ fusion™ cloning method (Enzynomics, Daejeon, Korea). The resulting plasmids containing hsp‐60p::hsp‐60cDNA::GFP (5 ng/μl), hsp‐60p::hsp‐60cDNA (5 ng/μl), or hsp‐60p::GFP MT (5 ng/μl) were co‐injected with an injection marker odr‐1p::RFP (75 ng/μl) into the gonad of young (day 1) adult wild‐type worms. To generate vha‐6p::tagRFP transcriptional fusion construct, GFP in pPD95.75 was replaced by tagRFP amplified from PSD‐95‐pTagRFP, a gift from Johannes Hell (Addgene plasmid # 52671), by using the EZ fusion™ cloning method. A PCR‐amplified 850 bp vha‐6 promoter fragment was inserted into the tagRFP‐containing pPD95.75 (pIJ559) by using the EZ fusion™ cloning method. To generate vha‐6p::pmk‐1::tagRFP and vha‐6p::sek‐1::tagRFP translational fusion constructs, pmk‐1 and sek‐1 cDNAs were PCR‐amplified from C. elegans cDNA samples and inserted into the tagRFP‐containing pPD95.75 (pIJ559) by using the EZ fusion™ cloning method. Subsequently, the 850 bp vha‐6 promoter fragment was inserted into pmk‐1::tagRFP‐ or sek‐1::tagRFP‐containing plasmids by using the EZ fusion™ cloning method. The resulting plasmids that contain vha‐6p::tagRFP (25 ng/μl), vha‐6p::pmk‐1::tagRFP (25 ng/μl), or vha‐6p::sek‐1::tagRFP (25 ng/μl) were injected with the co‐injection marker ofm‐1p::GFP (75 ng/μl) into the gonad of day 1 adult wild‐type worms. To generate intestine‐specific hsp‐60::tagRFP construct, pmk‐1 cDNA in the vha‐6p::pmk‐1::tagRFP‐containing vector was replaced by hsp‐60 cDNA by using the EZ fusion™ method. vha‐6 promoter in the resulting plasmid was further replaced by unc‐119 promoter for neuron‐specific hsp‐60::tagRFP construct. Intestinal and neuronal hsp‐60::tagRFP translational fusion constructs (5 ng/μl) were injected with co‐injection markers, odr‐1p::RFP (75 ng/μl) and fasn‐1p::GFP (75 ng/μl), respectively. To generate hsp‐60::spGFPN and sek‐1::spGFPC constructs, tagRFP in the vha‐6p::hsp‐60::tagRFP‐ and vha‐6p::sek‐1::tagRFP‐containing vectors was replaced by spGFPN and spGFPC, respectively, by using the EZ fusion™ method. sek‐1 cDNA in the vha‐6p::sek‐1::tagRFP‐containing vector was replaced by Y22D7AL.10 cDNA by using the EZ fusion™ method to generate vha‐6p::Y22D7AL.10::spGFPC construct. To generate vha‐6p::spGFPC construct, tagRFP in the vha‐6p::tagRFP‐containing vector was replaced by spGFPC by using the EZ fusion™ method. The vha‐6p::hsp‐60::spGFPN‐containing vector (5 ng/μl) was injected with the co‐injection marker odr‐1p::RFP (75 ng/μl). Each of the vha‐6p::sek‐1::spGFPC (25 ng/μl)‐, vha‐6p::Y22D7AL.10::spGFP (5 ng/μl)‐, or vha‐6p::spGFPC (25 ng/μl)‐containing vectors was injected with the co‐injection marker coel::RFP (75 ng/μl) into the gonad of day 1 adult worms. The primer sequences used for cloning are as follows: 5′‐GTAGTTTTTCAGACACAAAAGATGCTTCGCCTCGCCAGAAAG (forward) 5′‐GTACCCCGGGTGAATCCCATTCCTCCCATAC (reverse) for hsp‐60 cDNA, 5′‐GCTCTAGAGCCGCGGAAGATTGAGTATTCC (forward) and 5′‐ATGCTTCGCCTCGCCAGAAAGCTTTTGTGTCTGAAAAACTAC (reverse) for hsp‐60 promoter, 5′‐GAATGGGATTCTAGCATTCGTAGAATTCCAACTGAGCGCCGG (forward) and 5′‐CGAATGCTAGAATCCCATTCCTCCCATACCGCCCATTCCAC (reverse) for site‐directed mutagenesis to generate hsp‐60p::hsp‐60cDNA, 5′‐CTGCAGGTCGACTCTAGACGCGGAAGATTGAGTATTCC (forward) and 5′‐CCTTTGGCCAATCCCGGGTTCCCCACGACTGCTCGATGATC (reverse) for hsp‐60 promoter‐MTS. 5′‐GGACCCTTGGAGGGTACCATGGTGTCTAAGGGCGAAGAG (forward) and 5′‐GGCGCTCAGTTGGAATTCTCAATTAAGTTTGTGCCCCAGTTTG (reverse) for tagRFP, 5′‐TGGAAATGAAATAAGCTTAGCACAGAACTGCATTAAG (forward) and 5′‐CTTAGACACCATGGTACCTTTTTATGGGTTTTGGTAGG (reverse) for vha‐6 promoter, 5′‐CTGCAGGTCGACTCTAGAATGTTTCCACAGACAACAATGG (forward) and CCTTTGGCCAATCCCGGGATCGATTCCATTTTCTCCTC (reverse) for pmk‐1 cDNA, 5′‐GCGCCAGGATACTCTAGAATGGAGCGAAAAGGACGTGAGC (forward) and 5′‐CCTTTGGCCAATCCCGGGATCGTCGCCAAACAGTGTCGAG (reverse) for sek‐1 cDNA, 5′‐TGGAAATGAAATAAGCTTAGCACAGAACTGCATTAAG (forward) and 5′‐CTGTGGAAACATTCTAGATTTTTATGGGTTTTGGTAGG (reverse) for vha‐6 promoter for vha‐6p::pmk‐1::tagRFP, 5′‐TGGAAATGAAATAAGCTTAGCACAGAACTGCATTAAG (forward) and 5′‐TTTTCGCTCCATTCTAGATTTTTATGGGTTTTGGTAGG (reverse) for vha‐6 promoter for vha‐6p::sek‐1::tagRFP, 5′‐AACCCATAAAAATCTAGAATGCTTCGCCTCGCCAGAAAG (forward) and 5′‐ CCTTTGGCCAATCCCGGGATGAATCCCATTCCTCCCATAC (reverse) for hsp‐60 cDNA for vha‐6p::hsp‐60::tagRFP, 5′‐GATTCATTAATGCAGCTGGTGTCAAGTCTCTCAAAATTC (forward) and 5′‐GAGGCGAAGCATTCTAGAATATGCTGTTGTAGCTGAAAATTTTG (reverse) for unc‐119 promoter for unc‐119p::hsp‐60::tagRFP, 5′‐GGACCCTTGGAGGGTACCATGTCCAAAGGAGAAGAAC (forward) and 5′‐GGCGCTCAGTTGGAATTCTTATGTTCCTTTTTCATTTGG (reverse) for spGFPN for vha‐6p::hsp‐60::spGFPN, 5′‐GGACCCTTGGAGGGTACCAGAGATCATATGGTGTTG (forward) and 5′‐GGCGCTCAGTTGGAATTCTTATCCAGTAATACCTGCAGC (reverse) for spGFPC for vha‐6p::sek‐1::spGFPC, 5′‐AACCCATAAAAATCTAGAATGTTCCTCACCGCTGTCC (forward) and 5′‐CCTTTGGCCAATCCCGGGATATGGAAGACTCCGAGAAGATC (reverse) for Y22D7AL.10 cDNA for vha‐6p::Y22D7AL.10::spGFPC, 5′‐AACCCATAAAAAGGTACCATGAGAGATCATATGGTGTTG (forward) and 5′‐GGCGCTCAGTTGGAATTCTTATCCAGTAATACCTGCAGC (reverse) for spGFPC for vha‐6p::spGFPC.
Author contributions
D‐EJ, DL, S‐YH, J‐YY, and S‐JVL designed the experiments and prepared the manuscript. D‐EJ, DL, S‐YH, and YL performed the majority of experiments. D‐EJ, DL, S‐YH, YL, MS, WH, KS, ABH, MA, HGS, HB, and S‐JVL performed RNAi screen. J‐EL and J‐HJ performed experiments using cultured HeLa cells. YMO performed initial bioinformatics analysis for mitochondrial genes. D‐EJ, YR, H‐JK, and CMH performed confocal microscopy experiments.
Conflict of interest
The authors declare that they have no conflict of interest.
Supporting information
Appendix
Expanded View Figures PDF
Dataset EV1
Dataset EV2
Review Process File
Source Data for Figure 7
Acknowledgements
We thank Drs. D.H. Kim, E. Troemel, and J.Y. Sze, and the Caenorhabditis Genetics Center, for providing some bacteria, and C. elegans strains. We also thank Drs. D.H. Kim and M. Shapira for helpful comments on our figures and manuscript. This study was supported by the Basic Research Laboratory grant (NRF‐2012R1A4A1028200) funded by the Ministry of Science, ICT, and Future Planning to J.‐Y.Y. and S.‐J.V.L., and by KBRI basic research program through Korea Brain Research Institute funded by the Ministry of Science, ICT & Future Planning (No. 2231‐415) to C.M.H. and H.J.K. D.‐E.J. is a recipient of National Junior Research Fellowship (NRF‐2013H1A8A1003751) of Ministry of Education, Republic of Korea.
The EMBO Journal (2017) 36: 1046–1065
Footnotes
Correction added on 13 April 2017, after first online publication: The gene name C17H11.8 was corrected to C17H12.8.
Contributor Information
Joo‐Yeon Yoo, Email: jyoo@postech.ac.kr.
Seung‐Jae V Lee, Email: seungjaelee@postech.ac.kr.
References
- Amberger A, Maczek C, Jurgens G, Michaelis D, Schett G, Trieb K, Eberl T, Jindal S, Xu Q, Wick G (1997) Co‐expression of ICAM‐1, VCAM‐1, ELAM‐1 and Hsp60 in human arterial and venous endothelial cells in response to cytokines and oxidized low‐density lipoproteins. Cell Stress Chaperones 2: 94–103 [DOI] [PMC free article] [PubMed] [Google Scholar]
- Ashburner M, Ball CA, Blake JA, Botstein D, Butler H, Cherry JM, Davis AP, Dolinski K, Dwight SS, Eppig JT, Harris MA, Hill DP, Issel‐Tarver L, Kasarskis A, Lewis S, Matese JC, Richardson JE, Ringwald M, Rubin GM, Sherlock G (2000) Gene ontology: tool for the unification of biology. The Gene Ontology Consortium. Nat Genet 25: 25–29 [DOI] [PMC free article] [PubMed] [Google Scholar]
- Benedetti C, Haynes CM, Yang Y, Harding HP, Ron D (2006) Ubiquitin‐like protein 5 positively regulates chaperone gene expression in the mitochondrial unfolded protein response. Genetics 174: 229–239 [DOI] [PMC free article] [PubMed] [Google Scholar]
- Bolz DD, Tenor JL, Aballay A (2010) A conserved PMK‐1/p38 MAPK is required in Caenorhabditis elegans tissue‐specific immune response to Yersinia pestis infection. J Biol Chem 285: 10832–10840 [DOI] [PMC free article] [PubMed] [Google Scholar]
- Bukau B, Horwich AL (1998) The Hsp70 and Hsp60 chaperone machines. Cell 92: 351–366 [DOI] [PubMed] [Google Scholar]
- Calixto A, Chelur D, Topalidou I, Chen X, Chalfie M (2010) Enhanced neuronal RNAi in C. elegans using SID‐1. Nat Methods 7: 554–559 [DOI] [PMC free article] [PubMed] [Google Scholar]
- Cappello F, Conway de Macario E, Marasa L, Zummo G, Macario AJ (2008) Hsp60 expression, new locations, functions and perspectives for cancer diagnosis and therapy. Cancer Biol Ther 7: 801–809 [DOI] [PubMed] [Google Scholar]
- Chen D, Pan KZ, Palter JE, Kapahi P (2007) Longevity determined by developmental arrest genes in Caenorhabditis elegans. Aging Cell 6: 525–533 [DOI] [PMC free article] [PubMed] [Google Scholar]
- Chen W, Syldath U, Bellmann K, Burkart V, Kolb H (1999) Human 60‐kDa heat‐shock protein: a danger signal to the innate immune system. J Immunol 162: 3212–3219 [PubMed] [Google Scholar]
- Chikka MR, Anbalagan C, Dvorak K, Dombeck K, Prahlad V (2016) The mitochondria‐regulated immune pathway activated in the C. elegans intestine is neuroprotective. Cell Rep 16: 2399–2414 [DOI] [PMC free article] [PubMed] [Google Scholar]
- Chun JN, Choi B, Lee KW, Lee DJ, Kang DH, Lee JY, Song IS, Kim HI, Lee SH, Kim HS, Lee NK, Lee SY, Lee KJ, Kim J, Kang SW (2010) Cytosolic Hsp60 is involved in the NF‐kappaB‐dependent survival of cancer cells via IKK regulation. PLoS One 5: e9422 [DOI] [PMC free article] [PubMed] [Google Scholar]
- Claros MG, Vincens P (1996) Computational method to predict mitochondrially imported proteins and their targeting sequences. Eur J Biochem 241: 779–786 [DOI] [PubMed] [Google Scholar]
- Couillault C, Pujol N, Reboul J, Sabatier L, Guichou JF, Kohara Y, Ewbank JJ (2004) TLR‐independent control of innate immunity in Caenorhabditis elegans by the TIR domain adaptor protein TIR‐1, an ortholog of human SARM. Nat Immunol 5: 488–494 [DOI] [PubMed] [Google Scholar]
- Curran SP, Ruvkun G (2007) Lifespan regulation by evolutionarily conserved genes essential for viability. PLoS Genet 3: e56 [DOI] [PMC free article] [PubMed] [Google Scholar]
- Estes KA, Dunbar TL, Powell JR, Ausubel FM, Troemel ER (2010) bZIP transcription factor zip‐2 mediates an early response to Pseudomonas aeruginosa infection in Caenorhabditis elegans . Proc Natl Acad Sci USA 107: 2153–2158 [DOI] [PMC free article] [PubMed] [Google Scholar]
- Evans EA, Kawli T, Tan MW (2008) Pseudomonas aeruginosa suppresses host immunity by activating the DAF‐2 insulin‐like signaling pathway in Caenorhabditis elegans . PLoS Pathog 4: e1000175 [DOI] [PMC free article] [PubMed] [Google Scholar]
- Ewbank JJ (2006) Signaling in the immune response. In The C. elegans Research Community, WormBook. WormBook (ed). doi: 10.1895/wormbook.1.83.1, http://www.wormbook.org [DOI] [PMC free article] [PubMed] [Google Scholar]
- Ewbank JJ, Pujol N (2016) Local and long‐range activation of innate immunity by infection and damage in C. elegans . Curr Opin Immunol 38: 1–7 [DOI] [PubMed] [Google Scholar]
- Fares H, Greenwald I (2001) Genetic analysis of endocytosis in Caenorhabditis elegans: coelomocyte uptake defective mutants. Genetics 159: 133–145 [DOI] [PMC free article] [PubMed] [Google Scholar]
- Feinberg EH, Vanhoven MK, Bendesky A, Wang G, Fetter RD, Shen K, Bargmann CI (2008) GFP Reconstitution Across Synaptic Partners (GRASP) defines cell contacts and synapses in living nervous systems. Neuron 57: 353–363 [DOI] [PubMed] [Google Scholar]
- Gaglia MM, Jeong DE, Ryu EA, Lee D, Kenyon C, Lee SJ (2012) Genes that act downstream of sensory neurons to influence longevity, dauer formation, and pathogen responses in Caenorhabditis elegans . PLoS Genet 8: e1003133 [DOI] [PMC free article] [PubMed] [Google Scholar]
- Gao B, Tsan MF (2003) Recombinant human heat shock protein 60 does not induce the release of tumor necrosis factor alpha from murine macrophages. J Biol Chem 278: 22523–22529 [DOI] [PubMed] [Google Scholar]
- Garsin DA, Sifri CD, Mylonakis E, Qin X, Singh KV, Murray BE, Calderwood SB, Ausubel FM (2001) A simple model host for identifying Gram‐positive virulence factors. Proc Natl Acad Sci USA 98: 10892–10897 [DOI] [PMC free article] [PubMed] [Google Scholar]
- Garsin DA, Villanueva JM, Begun J, Kim DH, Sifri CD, Calderwood SB, Ruvkun G, Ausubel FM (2003) Long‐lived C. elegans daf‐2 mutants are resistant to bacterial pathogens. Science 300: 1921 [DOI] [PubMed] [Google Scholar]
- Gene Ontology Consortium (2015) Gene Ontology Consortium: going forward. Nucleic Acids Res 43: D1049–D1056 [DOI] [PMC free article] [PubMed] [Google Scholar]
- Ghosh I, Hamilton AD, Regan L (2000) Antiparallel leucine zipper‐directed protein reassembly: application to the green fluorescent protein. J Am Chem Soc 122: 5568–5569 [Google Scholar]
- Gibson TJ, Seiler M, Veitia RA (2013) The transience of transient overexpression. Nat Methods 10: 715–721 [DOI] [PubMed] [Google Scholar]
- Govindan JA, Jayamani E, Zhang X, Mylonakis E, Ruvkun G (2015) Dialogue between E. coli free radical pathways and the mitochondria of C. elegans . Proc Natl Acad Sci USA 112: 12456–12461 [DOI] [PMC free article] [PubMed] [Google Scholar]
- Gupta S, Knowlton AA (2007) HSP60 trafficking in adult cardiac myocytes: role of the exosomal pathway. Am J Physiol Heart Circ Physiol 292: H3052–H3056 [DOI] [PubMed] [Google Scholar]
- Habich C, Kempe K, van der Zee R, Rumenapf R, Akiyama H, Kolb H, Burkart V (2005) Heat shock protein 60: specific binding of lipopolysaccharide. J Immunol 174: 1298–1305 [DOI] [PubMed] [Google Scholar]
- Haynes CM, Petrova K, Benedetti C, Yang Y, Ron D (2007) ClpP mediates activation of a mitochondrial unfolded protein response in C. elegans . Dev Cell 13: 467–480 [DOI] [PubMed] [Google Scholar]
- Haynes CM, Yang Y, Blais SP, Neubert TA, Ron D (2010) The matrix peptide exporter HAF‐1 signals a mitochondrial UPR by activating the transcription factor ZC376.7 in C. elegans . Mol Cell 37: 529–540 [DOI] [PMC free article] [PubMed] [Google Scholar]
- Hiatt SM, Shyu YJ, Duren HM, Hu CD (2008) Bimolecular fluorescence complementation (BiFC) analysis of protein interactions in Caenorhabditis elegans . Methods 45: 185–191 [DOI] [PMC free article] [PubMed] [Google Scholar]
- Honda Y, Honda S (1999) The daf‐2 gene network for longevity regulates oxidative stress resistance and Mn‐superoxide dismutase gene expression in Caenorhabditis elegans . FASEB J 13: 1385–1393 [PubMed] [Google Scholar]
- de Hoon MJ, Imoto S, Nolan J, Miyano S (2004) Open source clustering software. Bioinformatics 20: 1453–1454 [DOI] [PubMed] [Google Scholar]
- Hu CD, Chinenov Y, Kerppola TK (2002) Visualization of interactions among bZIP and Rel family proteins in living cells using bimolecular fluorescence complementation. Mol Cell 9: 789–798 [DOI] [PubMed] [Google Scholar]
- Hwang AB, Ryu EA, Artan M, Chang HW, Kabir MH, Nam HJ, Lee D, Yang JS, Kim S, Mair WB, Lee C, Lee SS, Lee SJ (2014) Feedback regulation via AMPK and HIF‐1 mediates ROS‐dependent longevity in Caenorhabditis elegans . Proc Natl Acad Sci USA 111: E4458–E4467 [DOI] [PMC free article] [PubMed] [Google Scholar]
- Irazoqui JE, Urbach JM, Ausubel FM (2010) Evolution of host innate defence: insights from Caenorhabditis elegans and primitive invertebrates. Nat Rev Immunol 10: 47–58 [DOI] [PMC free article] [PubMed] [Google Scholar]
- Jonassen T, Marbois BN, Faull KF, Clarke CF, Larsen PL (2002) Development and fertility in Caenorhabditis elegans clk‐1 mutants depend upon transport of dietary coenzyme Q8 to mitochondria. J Biol Chem 277: 45020–45027 [DOI] [PubMed] [Google Scholar]
- Kahn NW, Rea SL, Moyle S, Kell A, Johnson TE (2008) Proteasomal dysfunction activates the transcription factor SKN‐1 and produces a selective oxidative‐stress response in Caenorhabditis elegans . Biochem J 409: 205–213 [DOI] [PubMed] [Google Scholar]
- Kalderon B, Kogan G, Bubis E, Pines O (2015) Cytosolic Hsp60 can modulate proteasome activity in yeast. J Biol Chem 290: 3542–3551 [DOI] [PMC free article] [PubMed] [Google Scholar]
- Kim DH, Feinbaum R, Alloing G, Emerson FE, Garsin DA, Inoue H, Tanaka‐Hino M, Hisamoto N, Matsumoto K, Tan MW, Ausubel FM (2002) A conserved p38 MAP kinase pathway in Caenorhabditis elegans innate immunity. Science 297: 623–626 [DOI] [PubMed] [Google Scholar]
- Kim DH, Liberati NT, Mizuno T, Inoue H, Hisamoto N, Matsumoto K, Ausubel FM (2004) Integration of Caenorhabditis elegans MAPK pathways mediating immunity and stress resistance by MEK‐1 MAPK kinase and VHP‐1 MAPK phosphatase. Proc Natl Acad Sci USA 101: 10990–10994 [DOI] [PMC free article] [PubMed] [Google Scholar]
- Kim DH (2013) Bacteria and the aging and longevity of Caenorhabditis elegans . Annu Rev Genet 47: 233–246 [DOI] [PubMed] [Google Scholar]
- Kim DH, Ewbank JJ (2015) Signaling in the innate immune response. In The C. elegans Research Community, WormBook. WormBook (ed). doi: 10.1895/wormbook.1.83.2, http://www.wormbook.org [DOI] [PMC free article] [PubMed] [Google Scholar]
- Kirienko NV, Ausubel FM, Ruvkun G (2015) Mitophagy confers resistance to siderophore‐mediated killing by Pseudomonas aeruginosa . Proc Natl Acad Sci USA 112: 1821–1826 [DOI] [PMC free article] [PubMed] [Google Scholar]
- Kol A, Lichtman AH, Finberg RW, Libby P, Kurt‐Jones EA (2000) Cutting edge: heat shock protein (HSP) 60 activates the innate immune response: CD14 is an essential receptor for HSP60 activation of mononuclear cells. J Immunol 164: 13–17 [DOI] [PubMed] [Google Scholar]
- Lee D, Jeong DE, Son HG, Yamaoka Y, Kim H, Seo K, Khan AA, Roh TY, Moon DW, Lee Y, Lee SJ (2015) SREBP and MDT‐15 protect C. elegans from glucose‐induced accelerated aging by preventing accumulation of saturated fat. Genes Dev 29: 2490–2503 [DOI] [PMC free article] [PubMed] [Google Scholar]
- Liberati NT, Fitzgerald KA, Kim DH, Feinbaum R, Golenbock DT, Ausubel FM (2004) Requirement for a conserved Toll/interleukin‐1 resistance domain protein in the Caenorhabditis elegans immune response. Proc Natl Acad Sci USA 101: 6593–6598 [DOI] [PMC free article] [PubMed] [Google Scholar]
- Libina N, Berman JR, Kenyon C (2003) Tissue‐specific activities of C. elegans DAF‐16 in the regulation of lifespan. Cell 115: 489–502 [DOI] [PubMed] [Google Scholar]
- Lin L, Pan S, Zhao J, Liu C, Wang P, Fu L, Xu X, Jin M, Zhang A (2014) HSPD1 interacts with IRF3 to facilitate interferon‐beta induction. PLoS One 9: e114874 [DOI] [PMC free article] [PubMed] [Google Scholar]
- Liu Y, Samuel BS, Breen PC, Ruvkun G (2014) Caenorhabditis elegans pathways that surveil and defend mitochondria. Nature 508: 406–410 [DOI] [PMC free article] [PubMed] [Google Scholar]
- Merkwirth C, Jovaisaite V, Durieux J, Matilainen O, Jordan SD, Quiros PM, Steffen KK, Williams EG, Mouchiroud L, Tronnes SU, Murillo V, Wolff SC, Shaw RJ, Auwerx J, Dillin A (2016) Two conserved histone demethylases regulate mitochondrial stress‐induced longevity. Cell 165: 1209–1223 [DOI] [PMC free article] [PubMed] [Google Scholar]
- Miyata S, Begun J, Troemel ER, Ausubel FM (2008) DAF‐16‐dependent suppression of immunity during reproduction in Caenorhabditis elegans . Genetics 178: 903–918 [DOI] [PMC free article] [PubMed] [Google Scholar]
- Nargund AM, Pellegrino MW, Fiorese CJ, Baker BM, Haynes CM (2012) Mitochondrial import efficiency of ATFS‐1 regulates mitochondrial UPR activation. Science 337: 587–590 [DOI] [PMC free article] [PubMed] [Google Scholar]
- Ohashi K, Burkart V, Flohe S, Kolb H (2000) Cutting edge: heat shock protein 60 is a putative endogenous ligand of the toll‐like receptor‐4 complex. J Immunol 164: 558–561 [DOI] [PubMed] [Google Scholar]
- O'Neill LA, Golenbock D, Bowie AG (2013) The history of Toll‐like receptors ‐ redefining innate immunity. Nat Rev Immunol 13: 453–460 [DOI] [PubMed] [Google Scholar]
- Pagliarini DJ, Calvo SE, Chang B, Sheth SA, Vafai SB, Ong SE, Walford GA, Sugiana C, Boneh A, Chen WK, Hill DE, Vidal M, Evans JG, Thorburn DR, Carr SA, Mootha VK (2008) A mitochondrial protein compendium elucidates complex I disease biology. Cell 134: 112–123 [DOI] [PMC free article] [PubMed] [Google Scholar]
- Papp D, Csermely P, Soti C (2012) A role for SKN‐1/Nrf in pathogen resistance and immunosenescence in Caenorhabditis elegans . PLoS Pathog 8: e1002673 [DOI] [PMC free article] [PubMed] [Google Scholar]
- Pellegrino MW, Nargund AM, Haynes CM (2013) Signaling the mitochondrial unfolded protein response. Biochim Biophys Acta 1833: 410–416 [DOI] [PMC free article] [PubMed] [Google Scholar]
- Pellegrino MW, Nargund AM, Kirienko NV, Gillis R, Fiorese CJ, Haynes CM (2014) Mitochondrial UPR‐regulated innate immunity provides resistance to pathogen infection. Nature 516: 414–417 [DOI] [PMC free article] [PubMed] [Google Scholar]
- Powell JR, Kim DH, Ausubel FM (2009) The G protein‐coupled receptor FSHR‐1 is required for the Caenorhabditis elegans innate immune response. Proc Natl Acad Sci USA 106: 2782–2787 [DOI] [PMC free article] [PubMed] [Google Scholar]
- Pradel E, Zhang Y, Pujol N, Matsuyama T, Bargmann CI, Ewbank JJ (2007) Detection and avoidance of a natural product from the pathogenic bacterium Serratia marcescens by Caenorhabditis elegans . Proc Natl Acad Sci USA 104: 2295–2300 [DOI] [PMC free article] [PubMed] [Google Scholar]
- Pukkila‐Worley R, Ausubel FM (2012) Immune defense mechanisms in the Caenorhabditis elegans intestinal epithelium. Curr Opin Immunol 24: 3–9 [DOI] [PMC free article] [PubMed] [Google Scholar]
- Qadota H, Inoue M, Hikita T, Koppen M, Hardin JD, Amano M, Moerman DG, Kaibuchi K (2007) Establishment of a tissue‐specific RNAi system in C. elegans . Gene 400: 166–173 [DOI] [PMC free article] [PubMed] [Google Scholar]
- Quintana FJ, Cohen IR (2011) The HSP60 immune system network. Trends Immunol 32: 89–95 [DOI] [PubMed] [Google Scholar]
- Reddy KC, Andersen EC, Kruglyak L, Kim DH (2009) A polymorphism in npr‐1 is a behavioral determinant of pathogen susceptibility in C. elegans . Science 323: 382–384 [DOI] [PMC free article] [PubMed] [Google Scholar]
- Ren M, Feng H, Fu Y, Land M, Rubin CS (2009) Protein kinase D is an essential regulator of C. elegans innate immunity. Immunity 30: 521–532 [DOI] [PMC free article] [PubMed] [Google Scholar]
- Richardson CE, Kooistra T, Kim DH (2010) An essential role for XBP‐1 in host protection against immune activation in C. elegans . Nature 463: 1092–1095 [DOI] [PMC free article] [PubMed] [Google Scholar]
- Seo M, Seo K, Hwang W, Koo HJ, Hahm JH, Yang JS, Han SK, Hwang D, Kim S, Jang SK, Lee Y, Nam HG, Lee SJ (2015) RNA helicase HEL‐1 promotes longevity by specifically activating DAF‐16/FOXO transcription factor signaling in Caenorhabditis elegans . Proc Natl Acad Sci USA 112: E4246–E4255 [DOI] [PMC free article] [PubMed] [Google Scholar]
- Shivers RP, Kooistra T, Chu SW, Pagano DJ, Kim DH (2009) Tissue‐specific activities of an immune signaling module regulate physiological responses to pathogenic and nutritional bacteria in C. elegans . Cell Host Microbe 6: 321–330 [DOI] [PMC free article] [PubMed] [Google Scholar]
- Shivers RP, Pagano DJ, Kooistra T, Richardson CE, Reddy KC, Whitney JK, Kamanzi O, Matsumoto K, Hisamoto N, Kim DH (2010) Phosphorylation of the conserved transcription factor ATF‐7 by PMK‐1 p38 MAPK regulates innate immunity in Caenorhabditis elegans . PLoS Genet 6: e1000892 [DOI] [PMC free article] [PubMed] [Google Scholar]
- Shyu YJ, Hiatt SM, Duren HM, Ellis RE, Kerppola TK, Hu CD (2008) Visualization of protein interactions in living Caenorhabditis elegans using bimolecular fluorescence complementation analysis. Nat Protoc 3: 588–596 [DOI] [PubMed] [Google Scholar]
- Soltys BJ, Gupta RS (1996) Immunoelectron microscopic localization of the 60‐kDa heat shock chaperonin protein (Hsp60) in mammalian cells. Exp Cell Res 222: 16–27 [DOI] [PubMed] [Google Scholar]
- Stiernagle T (2006) Maintenance of C. elegans . In The C. elegans Research Community, WormBook. WormBook (ed). doi: 10.1895/wormbook.1.101.1,http://www.wormbook.org [Google Scholar]
- Swaroop S, Sengupta N, Suryawanshi AR, Adlakha YK, Basu A (2016) HSP60 plays a regulatory role in IL‐1beta‐induced microglial inflammation via TLR4‐p38 MAPK axis. J Neuroinflammation 13: 27 [DOI] [PMC free article] [PubMed] [Google Scholar]
- Tan MW, Mahajan‐Miklos S, Ausubel FM (1999) Killing of Caenorhabditis elegans by Pseudomonas aeruginosa used to model mammalian bacterial pathogenesis. Proc Natl Acad Sci USA 96: 715–720 [DOI] [PMC free article] [PubMed] [Google Scholar]
- Tian Y, Garcia G, Bian Q, Steffen KK, Joe L, Wolff S, Meyer BJ, Dillin A (2016) Mitochondrial stress induces chromatin reorganization to promote longevity and UPRmt . Cell 165: 1197–1208 [DOI] [PMC free article] [PubMed] [Google Scholar]
- Troemel ER, Chu SW, Reinke V, Lee SS, Ausubel FM, Kim DH (2006) p38 MAPK regulates expression of immune response genes and contributes to longevity in C. elegans . PLoS Genet 2: e183 [DOI] [PMC free article] [PubMed] [Google Scholar]
- Tsan MF, Gao B (2009) Heat shock proteins and immune system. J Leukoc Biol 85: 905–910 [DOI] [PubMed] [Google Scholar]
- West AP, Shadel GS, Ghosh S (2011) Mitochondria in innate immune responses. Nat Rev Immunol 11: 389–402 [DOI] [PMC free article] [PubMed] [Google Scholar]
- Xie Y, Moussaif M, Choi S, Xu L, Sze JY (2013) RFX transcription factor DAF‐19 regulates 5‐HT and innate immune responses to pathogenic bacteria in Caenorhabditis elegans . PLoS Genet 9: e1003324 [DOI] [PMC free article] [PubMed] [Google Scholar]
- Yang JS, Nam HJ, Seo M, Han SK, Choi Y, Nam HG, Lee SJ, Kim S (2011) OASIS: online application for the survival analysis of lifespan assays performed in aging research. PLoS One 6: e23525 [DOI] [PMC free article] [PubMed] [Google Scholar]
- Yoneda T, Benedetti C, Urano F, Clark SG, Harding HP, Ron D (2004) Compartment‐specific perturbation of protein handling activates genes encoding mitochondrial chaperones. J Cell Sci 117: 4055–4066 [DOI] [PubMed] [Google Scholar]
- Zhang S, Ma C, Chalfie M (2004) Combinatorial marking of cells and organelles with reconstituted fluorescent proteins. Cell 119: 137–144 [DOI] [PubMed] [Google Scholar]
Associated Data
This section collects any data citations, data availability statements, or supplementary materials included in this article.
Supplementary Materials
Appendix
Expanded View Figures PDF
Dataset EV1
Dataset EV2
Review Process File
Source Data for Figure 7