Abstract
Introduction:
Recent pertussis outbreaks in the United States suggest our response to local disease outbreaks (eg, vaccine-preventable Bordetella pertussis) may benefit from understanding and applying spatial analytical methods that use data from immunization information systems at a subcounty level.
Methods:
A 2012 study on Denver, CO, residents less than 19 years of age confirmed pertussis cases and immunization information system records were geocoded and aggregated to the census tract (CT) level. An algorithm assessed whether individuals were up-to-date (UTD) for pertussis vaccines. Pearson, Spearman, and Kendall correlations assessed relations between disease incidence and pertussis vaccine coverage. Using spatial analysis software, disease incidence and UTD rates were spatially weighted, and smoothed. Global and local autocorrelations based on univariate Moran’s I spatial autocorrelation statistics evaluated whether a CT’s rate belong to a cluster based on incidence or UTD measures.
Results:
Overall disease incidence rate was 116.8/100 000. Assessment of pertussis vaccination coverage was available for 90% of the population. Among 134 672 Denver residents less than 19 years old, 103 496 (77%) were UTD for pertussis vaccines. Raw correlation coefficients showed weak relationships between incidence and immunization rates due to the presence of outliers. With geospatial and clustering analysis, estimates and correlation coefficients were improved with statistically significant Moran’s I values for global and local autocorrelations rejecting the null hypothesis that incidence or UTD rates were randomly distributed. With evidence indicating the presence of clusters, smoothed and weighted disease incidence and UTD rates in 144 CTs identified 21 CTs (15%) for potential public health intervention.
Conclusions:
Correlation of raw disease incidence and vaccine UTD rates in subcounty regions showed limited association, providing limited information for decision making. By assessing for clusters using spatial analysis methods, we identified CTs with higher incidence and lower immunization coverage for targeted public health interventions.
Keywords: Spatial Analysis, Autocorrelation, Pertussis, Immunization
Introduction
The 2012 Bordetella pertussis outbreak was the largest experienced in the United States since 1955.1 Totaling 48 277 reported cases (15.4/100 000 incidence rate), pertussis caused significant pneumonia and 20 deaths2 and estimated health care costs of $57 million.3 Although the outbreak peaked in 2012, pertussis has continued to be a major public health concern with increasing rates reported by the Centers for Disease Control and Prevention (CDC) through 2014. This trend is often attributed to use of the safer but less effective acellular vaccine (diphtheria and tetanus toxoids and acellular pertussis [DTaP]) for children.4 Infants, children, and adolescents are most at risk of infection,5 with an overall incidence rate of 44.8/100 000 among those less than 20 years old; pertussis-related disease adversely affects school attendance, with a high likelihood of spread among students in school settings.6 Given lower vaccine efficacy,7 the current public health challenge is to identify ways to minimize morbidity and mortality by maximizing vaccine coverage. Understanding both demographic and geographic factors affecting pertussis epidemiology may help to optimize coverage.
Immunizations are typically highly effective ways to combat disease spread8; spatial analytical approaches may enhance their interruption of pertussis disease spread by identifying higher risk areas (eg, lower up-to-date [UTD] rates) for targeted interventions.9 By geolocating vaccine-preventable disease (eg, incident pertussis cases) occurrence, spatial distribution analysis has identified disease clustering.10 Similarly, by accessing data from immunization information systems to geolocate individuals and vaccine UTD rates, or the percent of the population adhering to age-specific vaccine recommendations, areas of lower population vaccine coverage may be identified.11,12 These analyses may permit more granular assessments across a jurisdiction, enabling local health departments to actively target interventions.13
Effective prevention plans should target high-risk individuals or high transmission areas.14 Near-real-time spatial analysis might inform targeted vaccine outreach and assess campaign impact to optimize the intervention. However, the quality of immunization and population data available may result in overcounting due to high patient mobility or undercounting due to limited provider participation in immunization reporting. More scarcely populated geographic areas may artificially increase rates with wide confidence intervals. Lower and upper outlier rates may obscure correlations between disease incidence and UTD rates. Spatial analytical techniques (eg, weighting, smoothing, and cluster detection) may temper the impact of outliers. With open-source software, health departments can potentially identify areas where vaccine-preventable disease incidence rates are high and where vaccine UTD rates are low. Spatial analyses measure disease clustering, monitor prevention measure impact, identify outliers, and provide smoothing techniques to understand and visualize trends. This study was undertaken to evaluate the relation between vaccine coverage and a vaccine-preventable disease in an urban environment. We sought to explore a method to combine geospatial analysis of immunization UTD rates with confirmed pertussis disease reports using an immunization information system and a communicable disease registry, respectively.
Methods
Disease incidence rates
A retrospective, observational study was conducted using reported B pertussis cases among residents of the City and County of Denver in 2012 who were less than 19 years of age (total population: 634 905, <19 years of age: 149 830). Incident B pertussis cases were reported to the Colorado Electronic Disease Reporting System (CEDRS). Only cases meeting CDC’s definition for confirmed pertussis cases15 and reported to CEDRS were included. Suspect and probable cases were excluded from analysis. Reported case residence was used to geolocate the pertussis case to a census tract (CT) using ArcGIS software (CAA version 10.2.2; ESRI, Redlands, CA, USA). Population-based incidence rates were calculated using American Community Survey (ACS) 5-year estimated 2009-2013 denominators. Incidence rates were aggregated to the CT level.
Immunization UTD rates
Up-to-date rates were calculated using 2012 data from the Colorado Immunization Information System (CIIS), the official, voluntary, centralized, statewide immunization information system. Population estimates were derived from ACS data. Colorado Immunization Information System, maintained by the Colorado Department of Public Health and Environment, includes Web-based tools that provide record consolidation, eliminate redundant information, manage vaccine administration consistent with CDC schedules, and generate patient-specific immunization reports. Demographic (ie, date of birth and gender) and immunization history (ie, CVX code and contraindications)16,17 data were obtained from CIIS for individuals less than 19 years of age who had any vaccine in the previous 5 years (to mitigate the impact of counting individuals who moved out of the county). Individuals with a pertussis vaccination contradiction were excluded from analysis. An algorithm for calculating UTD status for each individual, based on the Advisory Committee on Immunization Practices recommendations,18 was developed in SAS (version 9.3; Cary, NC, USA) counting DTaP and Tdap (Tetanus toxoid, Reduced diphtheria, and Acellular pertussis) immunizations. Minimum and maximum ages, minimum interval periods between doses, and catch-up schedules were included in the assessment; doses were eliminated, if earlier than minimum age or interval from last vaccine.
In addition, residential addresses from CIIS were assigned longitude and latitude coordinates using Centrus19 software, spatially joined to the corresponding CT and aggregated to the CT level (N = 144). Penetration rates, or the percent of the population represented in CIIS, were calculated to estimate coverage of individuals less than 19 years of age when compared with ACS denominator data.
Age-adjusted incidence and UTD rates
Age-adjusted and age-unadjusted CT rates were performed to assess correlations between disease incidence and UTD rates per 100 000 population. Crude rates were calculated to the CT level. Crude incidence and UTD rates were adjusted for ages 0 to 4, 5 to 9, 10 to 14, and 15 to 18 using US Standard 2012 population ACS 5-year estimate proportion to adjust per 100 000 population for the same age groups per CT.
Spatial analysis
Pearson, Spearman, and Kendall tests for correlation were performed to assess associations between CT disease incidence rates and CT UTD immunization rates. Summarized CT-level data were imported into GeoDa version 0.920 (Windows 7, 32-bit version) for an exploratory spatial analysis of disease incidence and pertussis immunization UTD rates. Box plots, box maps (hinge = 1.5 or 1.5 times the interquartile range), and histograms identified lower and upper outliers’ values and location, as well as statistical measurements. Adjustments (ie, smoothing and weighting) of upper and lower outlying rates were used to mitigate rate variability associated with population differences (eg, small denominators in some CT) or relatively low CT-specific pertussis incidence rates.
To minimize variance instability of both outlier disease incidence and immunization UTD rates, all smoothing methods available in GeoDa were tested20,21: (1) empirical Bayes, (2) spatial empirical Bayes, and (3) spatial rate. Each was combined with available spatial weighting types: (1) queen contiguity (QC), (2) rook contiguity (RC), (3) k-nearest neighbor (KN), and (4) distance weights (DW).22 Weighting techniques in combination with smoothing methods produced different effects on the data set and analytical results. Rate estimations varied based on whether a CT (1) shared a common border or common vertices with or (2) had greater proximity to another CT. Weighting and smoothing methods were combined to optimally produce the fewest outliers for the data set.
Global autocorrelation was defined by Moran’s I statistic and visualized by Moran’s scatterplot for the entire data set, whereas local autocorrelation focused on finding local clusters by applying Local Moran’s I to each CT in relation to its geographic neighbors. By plotting smoothed rates versus lagged variables,20,23 the regression line slope generated Moran’s I. Lagged variables are the weighted average of the rate values for neighboring CTs.
Appropriate weighting and smoothing methods were selected to yield the fewest outliers and most dense neighborhood clusters. Local autocorrelation was determined using the local indicators of spatial association (LISA) for adjusted incidence and UTD rates. In addition, the Local Gi and Gi* statistics were run using the highest available number of permutations and normality tests for Gi and Gi*24 to verify results from LISA.23 Permutations and randomization in global autocorrelation permit a user to reject (or not) the null hypothesis that the data are randomly distributed. Permutations when used in LISA and Gi and Gi* statistics refine the significance levels.
Gi and Gi* are statistics of global and local spatial associations, respectively. Measured using a z score, high (positive) and low (negative) values for area of interest assess the randomness of the data and whether the null hypothesis should be due to positive or negative clustering. In the Gi, the individual CT rates are not included, whereas in the Gi*, individual CT rates are included in their own rate calculation. The Gi evaluates the general trend of the rates, whereas the Gi* evaluates each CT using its surrounding CTs and compares the local area with the total study area.25
The areas of greatest interest were those where higher disease incidence rates were associated with lower immunization UTD rates. The analysis initially sought to identify the intersection of higher incidence cluster(s) and higher UTD clusters to eliminate those intersecting areas, leaving CTs with higher disease incidence rates and lower UTD rates, where an intervention might be targeted.
Scoring census tracts for pertussis immunization UTD rates
Because 3 weighting types were selected for assessing UTD rates, a simple scoring system was developed to identify CT which might be targeted for outreach. “High-high” was defined as a CT with a high UTD immunization rate neighboring on at least one other CT with a high UTD rate. The inverse, or “low-low,” indicates a CT with low UTD immunization rate near another CT with a low UTD rate, indicating potential areas of interest. As multiple weighting techniques assessed UTD rates, the combined score counted the number of times a tract was identified as part of a high-high cluster based on 3 UTD smoothed rate methods (ie, empirical Bayes, spatial empirical Bayes, and spatial rate) combined with weighting methods (ie, QC, RC, and DW) with the Gi and Gi* for randomness and normality tests against the incidence cluster CTs. The total possible score ranged from 0 to 12. To avoid being restrictive (selecting a lower middle point), the maximum score was set to be 7 achieved by 2 CTs. It was determined that a midpoint score (ie, greater than or equal to 4) made a CT part of a UTD high-high cluster.
Results
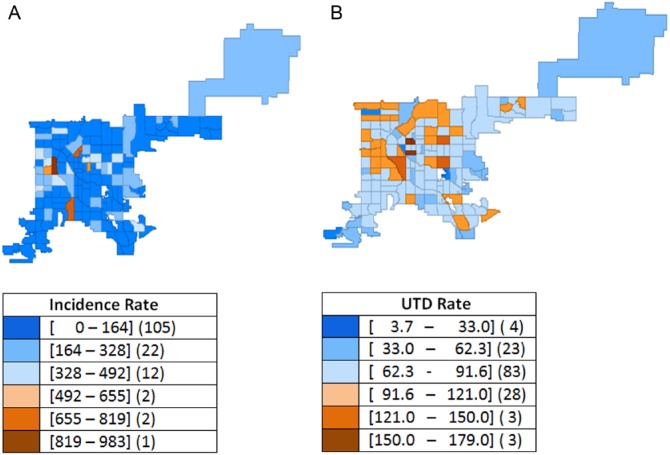
Among Denver residents under 19 years of age, 175 confirmed pertussis cases (87 men, 88 women) were reported in 2012 for a pertussis disease incidence of 116.8/100 000. The range of disease incidence by CT was 0 to 983/100 000 residents (Figure 1A). The CIIS data set included 134 672 individuals less than 19 years old (men: 68 402; women: 66 195; unknown: 75), representing 90% of the estimated 2012 population. Of these individuals, 103 496 (77%) were determined to be UTD for pertussis immunization. Up-to-date raw rates by CT ranged from 4% to 179% (Figure 1B). In some CTs, UTD rates exceeded 100% due to people whose address was out of date in CIIS or due to in-migration.
Figure 1.
Bordetella pertussis incidence and pertussis immunization up-to-date (UTD) unweighted rates, Denver, CO, 2012: (A) raw incidence rate per 100 000 and (B) raw UTD rate (%).
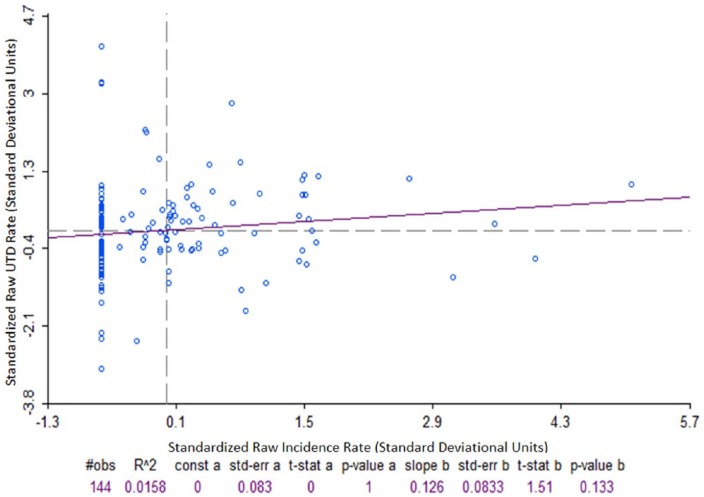
Pearson, Spearman, and Kendall tests for correlation between individual CT pertussis UTD rate and CT disease incidence rates were performed. Correlation tests were conducted for both unadjusted and age-adjusted rates. Results for both methods were essentially the same. No further age adjustment was used. Statistically significant (P < .05) positive correlations of 0.23 and 0.17 were observed for Spearman and Kendall, respectively, and a nonsignificant (P = .13) positive correlation of 0.13 was observed for the Pearson test. Figure 2 shows no correlation between incidence and UTD rates for the Pearson test.
Figure 2.
Standardized correlation plot for unweighted Bordetella pertussis disease incidence rate and immunization up-to-date rate (hinge: 1.5), Denver, CO, 2012.
Pearson correlation coefficient = 0.126; P = .133.
As outliers were observed with potential to affect correlation coefficients (eg, incorrectly estimating the presence or absence of an association), further exploration used spatial analytical methods to better assess correlation.
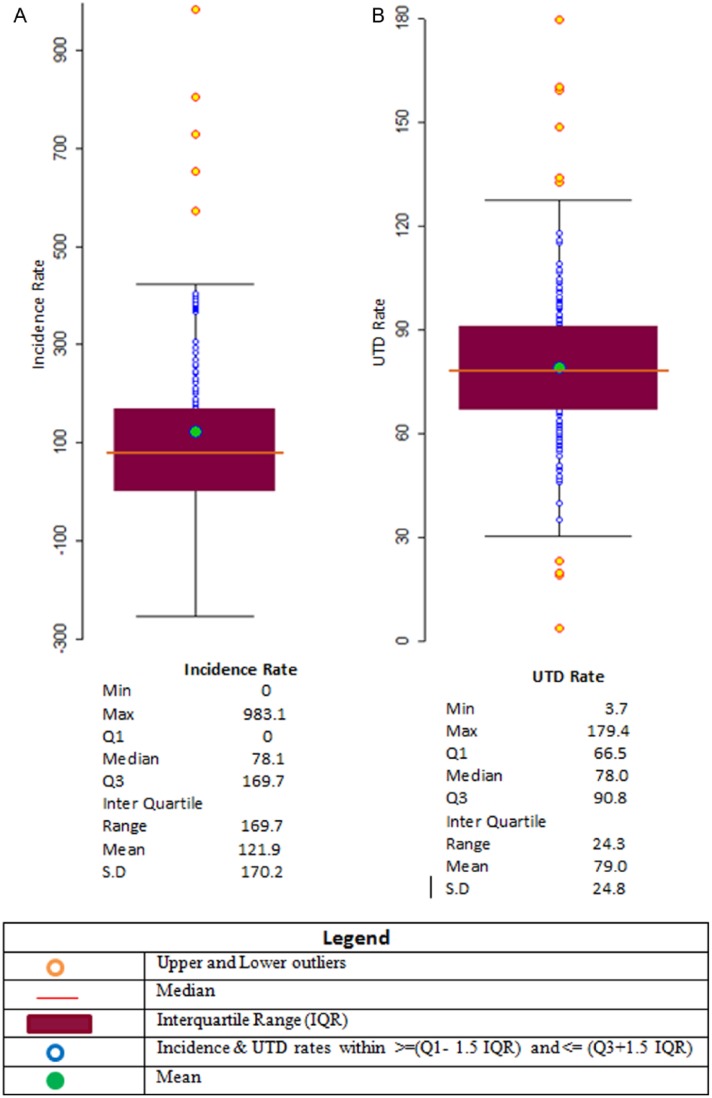
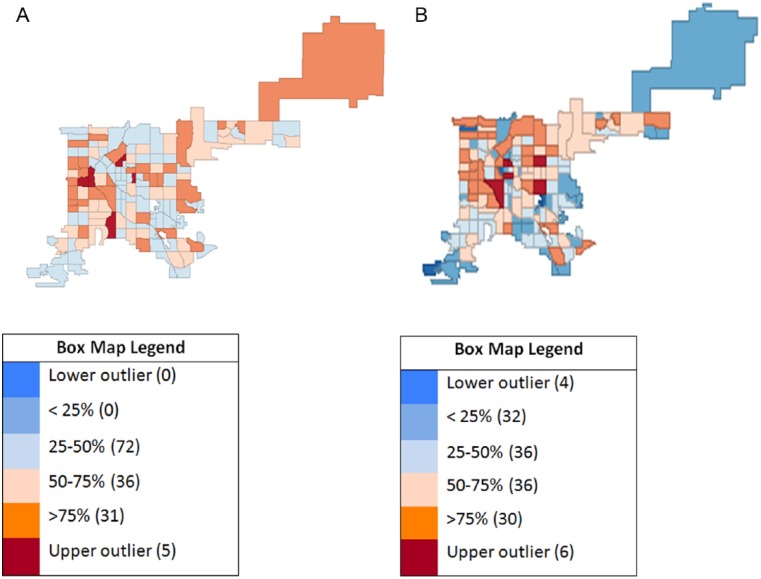
Raw rate analyses did not yield the expected correlation of high incidence rates with low UTD rates, and subsequent steps used weighting and smoothing techniques to analyze and adjust the data spatially. Box plots and box maps showed no lower and 5 upper outliers for incidence rates and their geographic location (Figures 3A and 4A, respectively). Box plot analysis revealed pertussis immunization UTD rates with 4 lower and 6 upper outliers (Figure 3B). Their geospatial locations are described in Figure 4B. Table 1 includes population rates for pertussis disease incidence and immunization UTD. Spatial rate smoothing was selected out of available options (ie, empirical Bayes, spatial empirical Bayes, and spatial rate) for both disease incidence and immunization UTD rates. Spatial weighting types selected were QC for incidence rates and QC, RC, and KN for UTD rates. Multiple weighting types were selected for the UTD rates as all 3 weight types produced no outliers. Table 2 shows the resulting outliers after applying each method combination.
Figure 3.
Exploratory box plot geospatial analysis of unweighted Bordetella pertussis incidence and pertussis immunization up-to-date (UTD) rates, Denver, CO, 2012: (A) incidence rate per 100 000 and (B) UTD rates (%).
Figure 4.
Exploratory (unweighted) box map geospatial analysis of Bordetella pertussis disease incidence and pertussis immunization up-to-date (UTD), Denver, CO, 2012: (A) incidence rate hinge = 1.5 and (B) UTD rate hinge = 1.5.
Table 1.
Bordetella pertussis incidence and pertussis immunization UTD rates for individuals less than 19 years of age, Denver, CO, 2009-2013.
| Information sources | ||||||
|---|---|---|---|---|---|---|
| Populationa |
Immunizationsb |
Disease occurrencec |
||||
| Total | % | Total | % | Total | % | |
| Total | 149 830 | 100 | 134 672 | 100 | 175 | 100 |
| Male | 76 116 | 51 | 68 402 | 51 | 87 | 50 |
| Female | 73 714 | 49 | 66 195 | 49 | 88 | 50 |
| Unknown | 75 | 0 | ||||
| Pertussis UTD | ||||||
| Yes | 103 496 | 77 | — | — | ||
| Male | 52 501 | 77 | — | — | ||
| Female | 50 963 | 77 | — | — | ||
| Unknown | 32 | 0 | ||||
| No | 31 176 | 23 | — | — | ||
| Male | 15 901 | 23 | — | — | ||
| Female | 15 232 | 23 | — | — | ||
| Unknown | 43 | 0 | ||||
Abbreviation: UTD, up-to-date.
American Community Survey 5-year estimates.
Colorado Immunization Information System.
Confirmed cases—Colorado Electronic Disease Reporting System, Colorado Department of Public Health and Environment: 174 cases geocoded.
Table 2.
Census tract outlier analysis by smoothing method for Bordetella pertussis incidence and pertussis immunization UTD rates, Denver, CO, 2012.
| Smoothing method | Outliers | Outliers by smoothing/weighting method |
|||||
|---|---|---|---|---|---|---|---|
| Queen Contiguity | Rook Contiguity | K-Nearest Neighbor | Distance Weight | ||||
| Bordetella pertussis incidence | Empirical Bayes | Upper | 6 | — | — | — | — |
| Lower | 1 | — | — | — | — | ||
| Spatial empirical Bayes | Upper | — | 11 | 6 | 9 | 10 | |
| Lower | — | 0 | 0 | 0 | 0 | ||
| Spatial rate | Upper | — | 0 | 5 | 11 | 0 | |
| Lower | — | 0 | 0 | 0 | 1 | ||
| Pertussis immunization UTD | Empirical Bayes | Upper | 5 | — | — | — | — |
| Lower | 4 | — | — | — | — | ||
| Spatial empirical Bayes | Upper | — | 5 | 5 | 5 | 5 | |
| Lower | — | 3 | 3 | 3 | 3 | ||
| Spatial rate | Upper | — | 0 | 0 | 0 | 1 | |
| Lower | — | 1 | 1 | 0 | 8 | ||
Abbreviation: UTD, up-to-date.
Pertussis disease incidence rates
Global autocorrelation
Moran’s I scatterplots for spatial rate smoothed and QC-weighted pertussis disease incidence rates indicated moderate and strong positive autocorrelation, respectively, on the high-high and low-low quadrants, having a Moran’s I = 0.665. Moran’s I scatterplot is divided into 4 quadrants: the upper right quadrant represents high values surrounded by other high values, the upper left quadrant represents low values surrounded by high values, the lower left quadrant represents low values surrounded by low values, and the lower right quadrant represents high values surrounded by low values. A positive slope indicated positive spatial autocorrelation where high values were surrounded or clustered with high values and low values were surrounded with low values; inversely, a negative slope indicated a negative autocorrelation (see Figure 5). To test the significance of Moran’s I, the randomization tests were selected using 99 999 permutations. Results of the simulated Moran’s I randomization test showed no measure larger than 0.665 (pseudo P < .0001), indicating spatial global autocorrelation for disease incidence.
Figure 5.
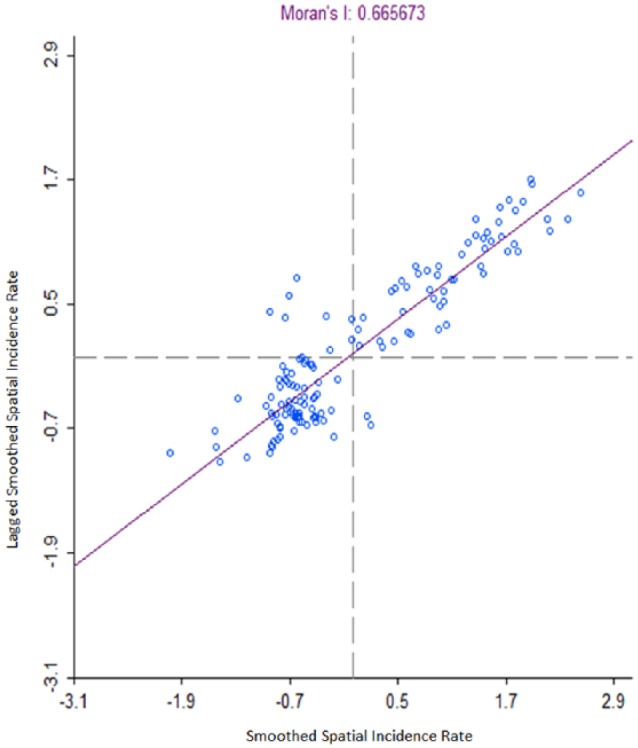
Spatial rate smoothed Bordetella pertussis incidence rate with queen contiguity weights Moran’s I scatterplot (hinge: 1.5), Denver, CO, 2012.
Global autocorrelation spatial rate smoothed with QC weighting.
Local autocorrelation
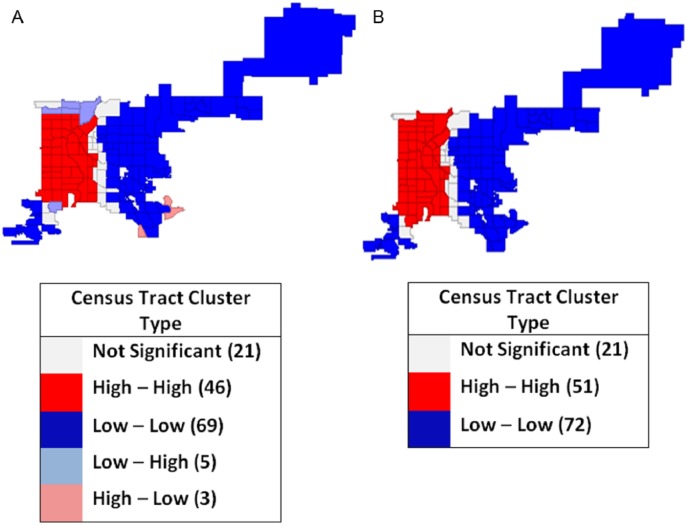
LISA outcomes and Gi and Gi* for disease incidence rates smoothed by spatial rate method and QC weighting (Figure 6A and B) under the randomization test had a pseudo P value of ⩽.0001. The cluster map in Figure 6A shows 1 predominant positive (high-high), autocorrelation clusters with 46 tracts in dark red. Local Gi and Gi* statistics produced 1 high-high cluster of 51 CTs Figure 6B.
Figure 6.
Local autocorrelation spatial rate smoothed Bordetella pertussis incidence weighting, rates with queen contiguity map, Denver, CO, 2012: (A) local indicators of spatial association cluster map and (B) Gi and Gi* cluster map.
Under the normality option, the outcomes of clusters and significance were more restrictive. Gi and Gi* statistics identified 1 cluster of 2 positive high-high tracts (pseudo P = .05, for Gi and Gi*); this cluster from the normality test seems to be the core of the larger cluster identified by LISA under the permutations test.
Pertussis immunization UTD rates
Global autocorrelation
Global autocorrelation for immunization UTD was analyzed using spatial rate smoothing with QC, RC, and DW weighting. In each case, the null hypothesis of global randomness was rejected, indicating the presence of clusters. The resulting Moran’s I for QC was 0.675, for RC was 0.523, and for DW was 0.411. For each, the simulated Moran’s I was smaller than the actual Moran’s I, indicating potential global autocorrelation.
Local autocorrelation spatial rate smoothed rate and weighting methodologies
Local autocorrelation was tested using Moran’s I, LISA, Gi, and Gi* for the spatially smoothed UTD rate in separate combinations with QC, KN, and RC weighting. Moran’s I of 0.675 rejected the null hypothesis; UTD rates with spatial smoothing and QC weighting were evenly dispersed geographically, indicating local clustering. Local simulated spatial patterns consisted of 1 high-high cluster. The cluster was formed by 46 tracts (pseudo P ⩽ .01). Local Gi and Gi* statistics under a randomization test generated identical cluster maps as LISA with the same 46 tracts (pseudo P ⩽ .01).
Spatially smoothed UTD rates with RC weighting showed a Moran’s I of 0.523 rejecting the null hypothesis and indicating the presence of a cluster. The LISA high cluster was formed by 34 tracts (pseudo P ⩽ .05). Local Gi and Gi* statistics under randomization test generated a nearly identical cluster map to LISA with 36 tracts (pseudo P ⩽ .01, for both).
Spatially smoothed immunization UTD rates with DW weighting showed a Moran’s I of 0.627 rejecting the null hypothesis and indicating the presence of a cluster. Local spatial patterns consisting of 2 clusters formed by 21 and 9 tracts were identical to LISA and Gi and Gi* maps (pseudo P ⩽ .05). Normality test resulted in some differences between Gi and Gi*. Gi* identified a statistically significant (P ⩽ .05) cluster formed by 2 tracts. Gi did not identify those same tracts as a cluster and categorized them as not statistically significant (P > .05).
Potentially significant clusters with the QC, RC, and DW weighting for the spatially smoothed UTD weighting were calculated using the scoring system; results are displayed in Figure 7 for each CT.
Figure 7.
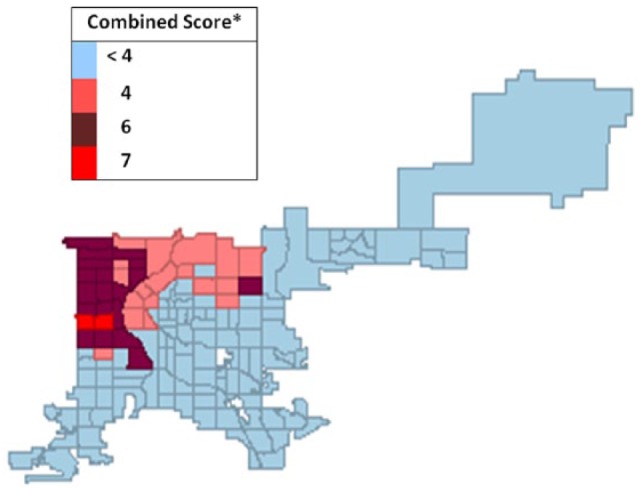
Map of combined spatial weight scoringa for pertussis vaccine up-to-date (UTD) rates by census tract, Denver, CO, 2012.
aScore determination: the score is determined by adding the number of times a census tract (CT) appeared in any Gi and Gi* high-high cluster. Maximum possible CT score was 12. Gi and Gi* inclusions were counted only when they corresponded to high-high UTD LISA clusters generated using the spatial rate smoothing method combined with queen contiguity, rook contiguity, and k-nearest neighbor spatial weighting types.
The score is determined by adding the number of times a CT appeared in any Gi and Gi* high-high cluster. Maximum possible CT score was 12. Gi and Gi* inclusions were counted only when they corresponded to high-high UTD LISA clusters generated using the spatial rate smoothing method combined with QC, RC, and KN spatial weighting types.
Spatial comparison of pertussis incidence and immunization UTD rates
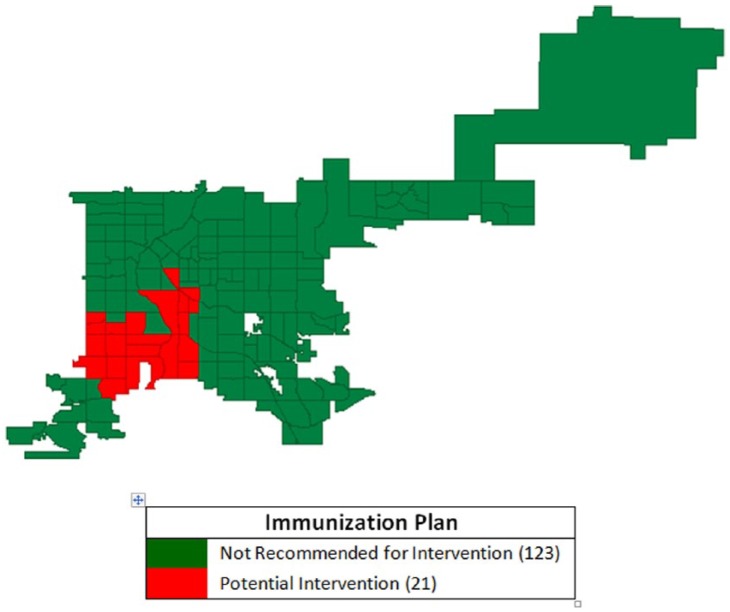
Potential intervention sites were determined by overlapping high pertussis incidence clusters with low UTD rate clusters. Local autocorrelation analysis identified a positive, higher pertussis incidence CT cluster (N = 51) using the LISA, Gi, and Gi* techniques (Figure 6A and B). The map containing the high-incidence pertussis cluster was compared with the map containing the 39 CT with UTD rates scoring ⩾4 or midpoint of the scoring range. Avoiding being restrictive, the maximum score was set to be 7 achieved by 2 CTs. It was determined that a midpoint score (ie, greater than or equal to 4) made a CT part of a UTD high-high cluster. A group (N = 21) of CTs included in the high disease incidence cluster yet excluded from the high immunization UTD scoring group were identified as potential intervention sites (Figure 8).
Figure 8.
Intersection of census tracts with high Bordetella pertussis incidence and low pertussis vaccine up-to-date immunization rates using spatial rate smoothing and queen contiguity weighting, Denver, CO, 2012.
Figure 8 represents detection and correction of anomalies in the correlation between pertussis incidence and vaccination rates. Smoothing increased the reliability of the correlation estimates by reducing the negative effect of outliers. By performing autocorrelation analysis, a statistically robust relationship estimate between rates was detected with high-high clusters for pertussis incidence and UTD rates using autocorrelation tools (LISA, Gi, and Gi*) in combination with appropriate smoothing techniques.
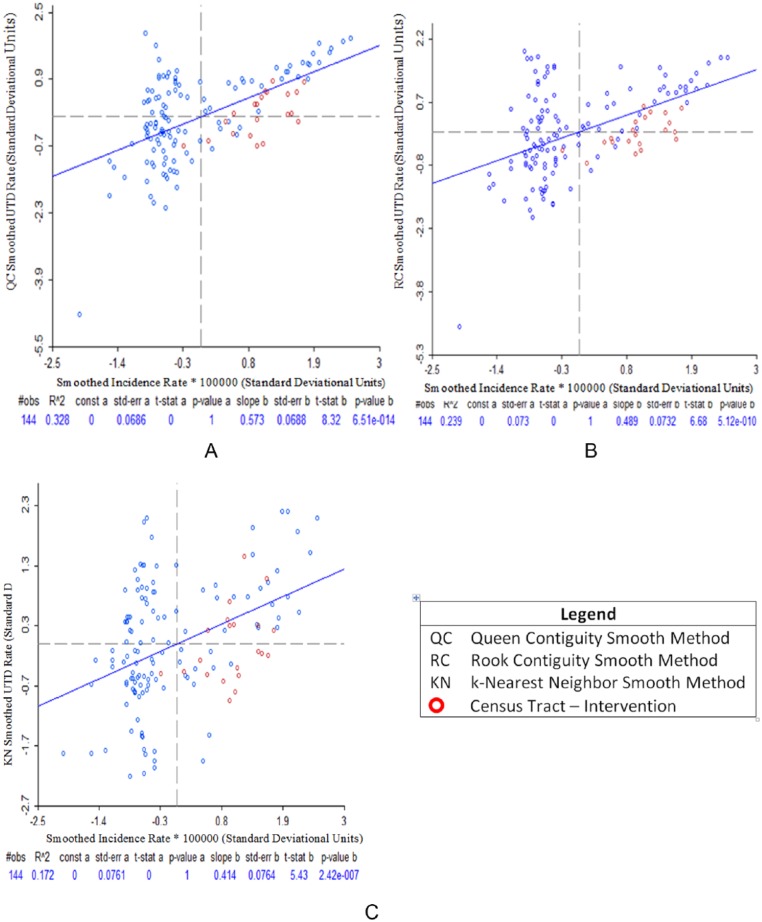
Comparing the correlation coefficients between raw and smothered disease incidence and immunization, correlation coefficients for incidence and UTD rates (spatial QC, spatial RC, and spatial KN) rose significantly (0.57, 0.49, and 0.41, respectively) for the Pearson test (P < .0001, Figures 9A to C); Spearman test (0.50, 0.44, 0.36, respectively, P < .0001); and Kendall test (0.36, 0.32, and 0.24, respectively, P < .0001).
Figure 9.
Pearson correlation plots between Bordetella pertussis incidence and pertussis vaccine up-to-date immunization smoothed rates using spatial rate smoothing method, Denver, CO, 2012: (A) QC smoothed incidence rate and QC smoothed UTD rate, (B) QC smoothed incidence rate and RC smoothed UTD rate, and (C) QC smoothed incidence rate and KN smoothed UTD rate.
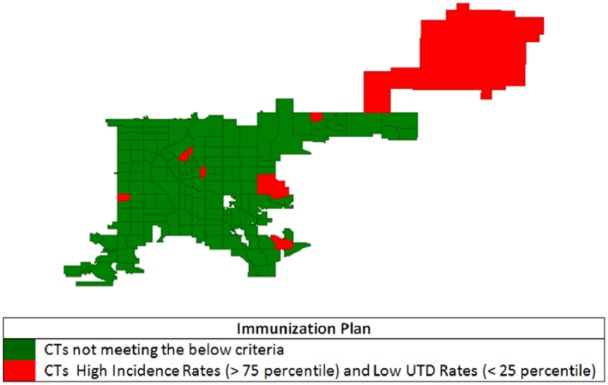
Using the same process but with raw pertussis incidence and vaccination UTD rates (Figure 10) shows 7 CTs with incidence rates above the 75th percentile and UTD rates below the 25th percentile. Only 1 of these CTs in Figure 10 is included in Figure 8 for intervention. Figure 10 also shows a pattern of random distribution and particularly 1 CT (upper right corner of the map) which has 1 confirmed pertussis case with very low population count.
Figure 10.
Census tracts (CTs) with high Bordetella pertussis incidence and low pertussis vaccine up-to-date (UTD) immunization (unweighted and unsmoothed) rates, Denver, CO, 2012.
Discussion
A simple comparison of disease incidence and UTD rates for pertussis immunization showed a correlation contrary to expectations due to the influence of extreme low or high outlier values. Spatial analysis offered an alternative method to overcome real-life deficiencies when using immunization data. Census tracts of interest (N = 21) were identified, where higher disease rates and lower immunization UTD rates suggest location for potential public health intervention. Another outcome was identifying high immunization UTD clusters. These areas represent successful immunization efforts where lessons may be learned.12
Geospatial analytical tools (eg, rate smoothing, weighting, and global and local autocorrelations) helped analyze data from 2 relatively common data sources (ie, communicable disease reports and immunization information systems) available in many state and local health departments. Such information can be presented to decision makers for geographically informed intervention strategies. To our knowledge, the concept of scoring immunization UTD rates for CTs to locate clusters using different smoothing and weighting tools was novel for determining potential immunization intervention strategies. This type of hotspot data visualization was facilitated by freely available, open-source software.20
This clustering approach alleviated the adverse impact of several outlier rates on correlations. In effect, cluster analysis mitigated the problem of small denominators for some CT where outlier rates are more likely. Alternatively, population inflation due to in-migration or deflation due to having moved or gone elsewhere (MOGE) may distort rate calculations, resulting in overestimated or underestimated rates. Rate smoothing stabilizes artificial rate variations from one area to another: adjusting higher and lower rates toward the mean global and local rate accounts for population differences between CTs.
Using the immunization information system and census estimates, the Denver County CT-level penetration rates for Colorado Immunization Information System were calculated. Using 2009-2013 ACS estimates as a denominator, the resulting penetration rate of CIIS to census information was 90%. With at least 1 CT having a penetration rate of 179%, in-migration for some communities has been significant. The US Census Bureau has estimated rapid growth (~15%) in Denver population since 2010.26
Limitations
This method assumed a representative and accurately geocoded set of immunization information system data. Some Denver County residents received vaccines from providers who did not report vaccinations to CIIS. Immunization history for patients seeing those providers would have been incomplete, thereby creating inaccurate UTD rates. “MOGE”27 updates were typically not available for this analysis; thus, if a patient leaves the county or state or transfers to a provider not reporting to the immunization information system, CT-level penetration rate estimates would be inflated. This likely affected all CTs randomly. We attempted to mitigate the impact of “MOGE” and unknown updated addresses on penetration rate calculations through our restriction to at least 1 immunization during the past 5 years.
Conclusions
Using efficient, readily available, and cost-effective spatial analysis software, public health departments have an opportunity to geographically inform and target immunization outreach programs. While already a robust source of data, even stronger provider participation and sharing immunization records with CIIS will help improve accuracy of geospatial UTD estimates. Using smoothing techniques, spatial exploratory data analysis, hotspot identification, and significance tests, we combined findings into a summary score. Summary geospatial scoring increased the identification of potential targets of high-risk CT for optimal use of limited public health resources and may permit cost savings to public health departments. Geospatial analytical skills and methods used in this study are replicable; they should be applicable to other public health data sets beyond vaccine-preventable disease incidence and vaccination status.
Acknowledgments
The authors would like to acknowledge the Colorado Immunization Information System team at the Colorado Department of Public Health and Environment for providing data to support this study.
Footnotes
Peer Review:Five peer reviewers contributed to the peer review report. Reviewers’ reports totaled 2943 words, excluding any confidential comments to the academic editor.
Funding:The author(s) disclosed receipt of the following financial support for the research, authorship, and/or publication of this article: This study is supported in part by the Applied Public Health Informatics Fellowship Program administered by Council of State and Territorial Epidemiologists (CSTE) and funded by Centers for Disease Control and Prevention (CDC) Cooperative Agreement 3U38-OT000143-01S1 and the Applied Epidemiology Fellowship Program administered by CSTE and funded by the CDC Cooperative Agreement Number 5U38HM000414-5.
Declaration of Conflicting Interests:The author(s) declared no potential conflicts of interest with respect to the research, authorship, and/or publication of this article.
Author Contributions: MEM and AJD conceived and designed the experiments; MEM, LES, and AJD analyzed the data, contributed to the writing of the manuscript, and jointly developed the structure and arguments for the paper; MEM wrote the first draft of the manuscript; AJD, LDM, LES, and KDY agreed with manuscript results and conclusions; AJD, LDM, and KDY made critical revisions and approved final version. All authors reviewed and approved the final manuscript.
Disclosures and Ethics: As a requirement of publication, author(s) have provided to the publisher signed confirmation of compliance with legal and ethical obligations including, but not limited to, the following: authorship and contributorship, conflicts of interest, privacy and confidentiality, and (where applicable) protection of human and animal research subjects. The authors have read and confirmed their agreement with the ICMJE authorship and conflict of interest criteria. The authors have also confirmed that this article is unique and not under consideration or published in any other publication, and that they have permission from rights holders to reproduce any copyrighted material. Any disclosures are made in this section. The external blind peer reviewers report no conflicts of interest.
References
- 1. Centers for Disease Control and Prevention. Pertussis cases by year (1922–2014). http://www.cdc.gov/pertussis/surv-reporting/cases-by-year.html. Accessed July 20, 2016.
- 2. Centers for Disease Control and Prevention. 2012. final pertussis surveillance report. https://www.cdc.gov/pertussis/downloads/pertuss-surv-report-2012.pdf. Accessed July 17, 2016.
- 3. Clark TA. Status of pertussis control in the United States. http://www.hhs.gov/sites/default/files/nvpo/nvac/meetings/pastmeetings/2013/pertussis-epidemiology-june2013.pdf. Published 2013. Accessed July 17, 2016.
- 4. Klein NP, Bartlett J, Fireman B, Rowhani-Rahbar A, Baxter R. Comparative effectiveness of acellular versus whole-cell pertussis vaccines in teenagers. Pediatrics. 2013;131:e1716–e1722. [DOI] [PubMed] [Google Scholar]
- 5. Centers for Disease Control and Prevention. Epidemiology and prevention of vaccine-preventable diseases: Pertussis. http://www.cdc.gov/vaccines/pubs/pinkbook/downloads/pert.pdf. Accessed July 20, 2016.
- 6. Everett S, Jacobson M, Halldorson S, et al. School-associated pertussis outbreak—Yavapai County, Arizona—September 2002–February 2003. MMWR. 2004;53:216–219. [PubMed] [Google Scholar]
- 7. Zhang L, Prietsch SO, Axelsson I, Halperin SA. Acellular vaccines for preventing whooping cough in children. Cochrane Database Syst Rev. 2014;9:CD001478. [DOI] [PMC free article] [PubMed] [Google Scholar]
- 8. Centers for Disease Control and Prevention. How vaccines prevent diseases. http://www.cdc.gov/vaccines/parents/vaccine-decision/. Accessed July 20, 2016.
- 9. Thomas DSK, Anthamatten P, Root ED, et al. Disease mapping for informing targeted health interventions: childhood pneumonia in Bohol, Philippines. Trop Med Int Health. 2015;20:1525–1533. [DOI] [PubMed] [Google Scholar]
- 10. Siegel C, Davidson A, Kafadar K, Norris JM, Todd J, Steiner J. Geographic analysis of pertussis infection in an urban area: a tool for health services planning. Am J Public Health. 1997;87:2022–2026. [DOI] [PMC free article] [PubMed] [Google Scholar]
- 11. Nelson EJ, Hughes J, Oakes JM, Pankow JS, Kulasingam SL. Geospatial patterns of human papillomavirus vaccine uptake in Minnesota. BMJ Open. 2015;5:e008617. [DOI] [PMC free article] [PubMed] [Google Scholar]
- 12. Moïsi JC, Kabuka J, Mitingi D, Levine OS, Scott JAG. Spatial and socio-demographic predictors of time-to-immunization in a rural area in Kenya: is equity attainable? Vaccine. 2010;28:5725–5730. [DOI] [PMC free article] [PubMed] [Google Scholar]
- 13. Tanskanen A, Nillos LT, Lehtinen A, et al. Geographic Information System and tools of spatial analysis in a pneumococcal vaccine trial. BMC Res Notes. 2012;5:51 http://bmcresnotes.biomedcentral.com/articles/10.1186/1756-0500-5-51. [DOI] [PMC free article] [PubMed] [Google Scholar]
- 14. Healy CM, Rench MA, Wootton SH, Castagnini LA. Evaluation of the impact of a pertussis cocooning program on infant pertussis infection. Pediatr Infect Dis J. 2015;34:22–26. [DOI] [PubMed] [Google Scholar]
- 15. Centers for Disease Control and Prevention. Pertussis (whooping cough): surveillance and reporting. http://www.cdc.gov/pertussis/surv-reporting.html. Accessed July 20, 2016.
- 16.Centers for Disease Control and Prevention. Contraindications and precautions to commonly used vaccines. http://www.cdc.gov/vaccines/hcp/admin/contraindications-vacc.html. Accessed July 20, 2016.
- 17.Centers for Disease Control and Prevention. Immunization information systems: current HL7 standard code set CVX—vaccines administered. http://www2a.cdc.gov/vaccines/iis/iisstandards/vaccines.asp?rpt=cvx. Accessed July 20, 2016.
- 18. Centers for Disease Control and Prevention. Birth-18 years & “Catch-up” immunization schedules. http://www.cdc.gov/vaccines/schedules/hcp/child-adolescent.html. Accessed July 20, 2016.
- 19. Bowes P. Centrus—business geographics, data quality, real-time customer matching. http://www.centrus.com/. Accessed July 19, 2016.
- 20. Anselin L. Exploring Spatial Data with GeoDa™: A Workbook. Center for Spatially Integrated Social Sciences, University of Illinois at Urbana–Champaign; 2005. http://www.csiss.org/clearinghouse/GeoDa/geodaworkbook.pdf. Accessed July 20, 2016.
- 21. Anselin L, Lozano N, Koschinsky J. Rate transformations and smoothing. http://libra.msra.cn/Publication/4506254/rate-transformations-and-smoothing. Published 2006. Accessed July 19. 2016.
- 22. Dubin R. SAGE reference—spatial weights. In: Fotheringham AS, Rogerson PA. eds. The SAGE Handbook of Spatial Analysis. Thousand Oaks, CA: SAGE; 2009;125–144. [Google Scholar]
- 23. Fortin MJ, Dale M. Spatial autocorrelation. In: Fotheringham AS, Rogerson PA. eds. The SAGE Handbook of Spatial Analysis. Thousand Oaks, CA: SAGE; 2009;89–101. [Google Scholar]
- 24. Getis A, Ord K. The analysis of spatial association by use of distance statistics. Geogr Anal. 1992;24:189–206. [Google Scholar]
- 25. ESRI. How High/Low Clustering (Getis-Ord General G) Works. ESRI: ArcGIS Pro; http://pro.arcgis.com/en/pro-app/tool-reference/spatial-statistics/h-how-high-low-clustering-getis-ord-general-g-spat.htm. Accessed July 20, 2016. [Google Scholar]
- 26. Murray J. Denver grows by another 18,582 people as city’s boom accelerates. The Denver Post. March 24, 2016. http://www.denverpost.com/2016/03/24/denver-grows-by-another-18582-people-as-citys-boom-accelerates/
- 27. Williams W, Lyalin D, Hoyle T, Reed K, Salisbury-Keith K, Aponte AR. Management of moved or gone elsewhere (MOGE) and other patient immunization statuses in immunization information systems. In: National Immunization Conference; March 9, 2006; https://cdc.confex.com/cdc/nic2006/techprogram/P10124.HTM. Accessed July 20, 2016.


