Abstract
The aim of this study was to create an Urban Dental Index (UDI) for Perth, Western Australia, adapting a method utilised by the World Health Organisation. Dental health indicators were derived from the 2011 census, standardised on a (0,1) interval, amalgamated using a geometric mean, and mapped to identify dental health inequity. The validity of the UDI was tested by comparison with oral cellulitis data. Dental health disparities were examined using a ratio of the mean of the highest to lowest decile and slope of the eight middle deciles. The robustness of the UDI was tested using indicator correlation, weighting, and systematic indicator removal. There were a high proportion of low UDI census areas outside the inner city. Adult public dental clinics were unevenly distributed across these low UDI areas. The UDI was significantly correlated with oral cellulitis data and had a moderate disparity ratio (1.69) and slope (0.23). All dental indicators were highly correlated, and UDIs calculated with weighted indicators and indicators removed were significantly correlated with the original UDI. These results indicate that the UDI is a robust tool which can be used by policy makers to target dental health initiatives to high-risk areas.
Keywords: Australia, Composite measure, Indicators, Indices, Socioeconomic status
Introduction
Socioeconomically disadvantaged individuals face long waiting times for primary dental services because of the paucity of public sector safety-net care [1]. This prolonged waiting allows exacerbation of pre-existing dental conditions and contributes to cyclical emergency service usage among public patients [2]. The cost associated with preventable hospitalisations could be avoided with the equitable distribution of government dental clinics. Therefore, funding efforts should focus on targeting dental services to high-risks areas.
It is theoretically possible to examine the dental health of all individuals in small geographic areas; however, direct measurement is not feasible in the context of a large community (e.g. a capital city). High-risk areas can instead be identified using suitable indicators of poor dental health such as socioeconomic status (SES). In this study, we focused on identifying high-risk census areas in Perth, Western Australia; however, the method we utilised is relevant to all urban areas experiencing a socioeconomic gradient in dental health risk.
Socioeconomically disadvantaged Australians are less likely to attend dental clinics for regular check-ups and more likely to have untreated dental decay compared to their more advantaged counterparts [3]. Aboriginal and Torres Strait Islander people are also more likely to have poor dental health compared to the overall population [4, 5], and are over-represented in this low-income group [6]. Combining these dental indicators into a composite measure will enable identification of regions likely to experience a high frequency of dental disease.
Indicators of dental health can be combined into an Urban Dental Index (UDI) using a method adopted by the World Health Organisation and Georgia State University [7, 8]. This method is adapted from the Human Development Index to focus on health disparities at a local level [9].
The aim of this study was to use these methodologies to create an UDI for the first time. Dental indicators were amalgamated into a single metric for small census areas, which were geocoded, enabling us to produce a high-resolution map of dental health risk. Finally, the accuracy and robustness of the UDI was tested.
Methods
Ethics
Ethics approval was obtained from the Ethics Committee of the University of Western Australia to access and utilise de-identified hospital morbidity data for oral cellulitis (RA/4/1/5502). All other data was open access and available census data.
Dental Indicator Data
Indicator data was derived from the 2011 census at Statistical Area Level 1 (SA1) for 3892 SA1s in the Greater Perth region. SA1s are the smallest census area units examined by the Australian Bureau of Statistics (ABS) and have an average population 400 people [10].
Four indicators were selected from two domains: (1) SES; percentage employment, average weighted weekly income, and Socio-Economic Indexes for Areas (SEIFA) scores; and (2) Aboriginal/Torres Strait Islander status; percentage non-Aboriginal/Torres Strait Islander. 152 SA1s were excluded because they were unpopulated (n = 104) or missing one or more indicator values (n = 48).
SEIFA Scores
SEIFA is a composite measure of socioeconomic disadvantage created by the ABS to rank census areas across Australia. SEIFA scores include relative measures of socioeconomic advantage and disadvantage which define people’s access to material and social resources, and the ability to participate in society [11]. There are four SEIFA indexes, each focusing on different aspects of SES. In this study, the Index of Relative Socio-Economic Advantage and Disadvantage was used. This Index was suitable because higher scores were associated with higher socioeconomic advantage [12], which was consistent with the other dental indicators.
Census Data Preparation
Each census data category included partial responses and non-responses. These responses were excluded from the total responses for each category. The amended total was used to calculate percentage employment, average weighted weekly income, and percentage non-Aboriginal/Torres Strait Islander.
Percentage employment was considered to be the number of people employed full-time, part-time, or employed away from work, divided by the amended total. Respondents who were “not in the labour force” or considered “not applicable” were excluded.
The ABS divides census income data into household weekly income ranges. Average weighted weekly household income was calculated to provide an estimate of average weekly income for each SA1. The mean of each range was multiplied by the number of individuals in an income bracket, summed between income brackets, and divided by the amended total. For the final income range ($5000 or more), the range of the preceding income bracket was used to determine a mean value. Nil income, negative income, and not applicable responses were excluded.
Index Construction
To construct the UDI, all dental indicators were standardised according to the equation:
where I was the observed indicator value, max(I) was the maximum indicator value, min * (I) was the minimum indicator value minus a small constant (0.01 × standard deviation (σ)), and I S was the standardised indicator which satisfied 0 < I s ≤ 1.
A geometric mean was used to amalgamate the dental indicators into a single metric. A small constant (0.01 × σ) was subtracted from the minimum observed indicator value to ensure all standardised indicator values were greater than zero. The geometric mean was calculated according to the equation:
where I S was the standardised indicator, and the UDI was calculated by multiplying j standardised indicators together, then raising the product to the jth root.
Visualisation
Variation in dental health risk was mapped using Quantum Geographic Information System software (version 2.14.1). Shapefiles detailing the dimensions of census areas in Perth were obtained from the ABS website and used to map SA1s [13]. On the map of Perth, each SA1 was assigned a single colour of varying hue dependent on the UDI value. Ten different hues were assigned by dividing the UDI into ten quantile ranges. More intense hues were used to represent SA1s with lower UDI values and a higher risk of poor dental health.
Adult public dental clinic locations were included on the UDI map of Perth. The location of these clinics was determined using the Government of Western Australia Dental Health Services Website [14]. The accuracy of the clinic locations provided by the website was tested by telephone communication with the clinics.
Comparison with Oral Cellulitis
The probability of experiencing oral cellulitis (per 100,000 population) in a given SA1 was used to test the validity of the UDI. The original cellulitis data was obtained from a retrospective analysis of oral cellulitis in Western Australia over a 10-year period, from 1999–2000 to 2008–2009 [15]. The probabilities for each SA1 were calculated using previously published methods [16].
The inverse probability of oral cellulitis was determined for each SA1 by multiplying all probability values by negative one. This transformation ensured the relationship between oral cellulitis and SES was consistent with the other dental indicators.
Spearman’s correlation coefficient was used to test the relationship between the UDI and oral cellulitis. The UDI was also compared to a map of the standardised inverse probability of oral cellulitis for Perth SA1s.
Assessing Disparities
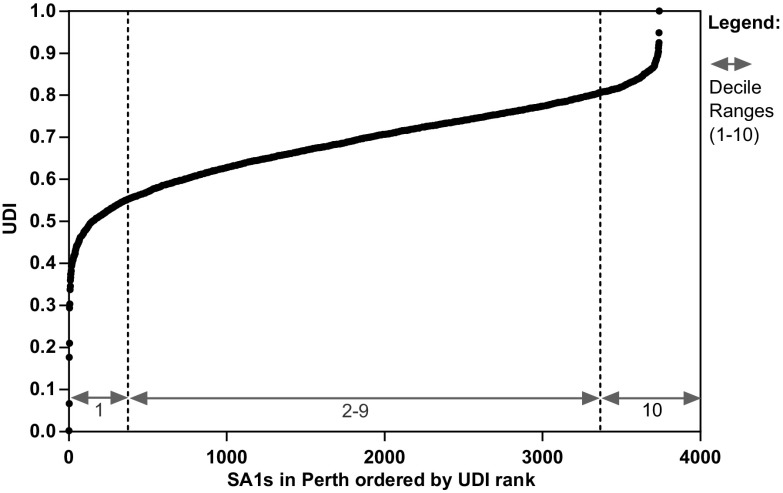
The original UDI was graphed to identify differential dental health risk in Perth. UDI rankings on the abscissa were graphed against UDI values on the ordinate. The graph was expected to have a positive linear mid-section with deviations on either end based on previous Urban Health Index (UHI) research [7]. A disparity ratio and slope were calculated using the graph to measure the variation in dental health risk in the Greater Perth region.
The disparity ratio was the ratio of the mean of the highest to lowest decile. The ratio was used as a measure of the difference between the extremes of dental health risk in Perth.
The disparity slope was determined by examining the linear mid-section of the UDI graph using the eight middle deciles. The ranks were rescaled by dividing each rank by the total number of SA1s in the mid-section to enable comparison with future UDI research. Linear regression analysis of the UDI against the rescaled rankings was used to determine the disparity slope. The slope provided an indication of the variation in dental health risk in the Greater Perth region.
Testing the Robustness of the UDI
The relationship between each of the standardised dental indicators was tested using a multiple correlation matrix.
The sensitivity of the UDI was determined by arbitrarily assigning weights to each dental indicator. One thousand sets of five dental indicators were generated with weights randomly selected from a standard uniform distribution (U[0,1]). The weights were rescaled to sum the number of dental indicators (n = 4), using the equation:
where w i was the rescaled weight, v i was the unscaled weight, was the sum of the un-scaled weights, and n was the number of dental indicators (n = 4). The weighted geometric mean was calculated using the equation:
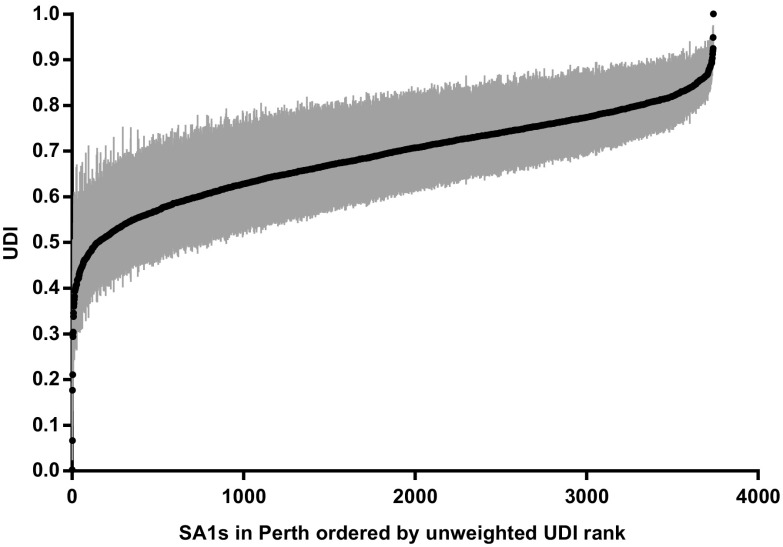
To illustrate the effect of weighting, UDI values were plotted against their unweighted ranking and against the range of weighted UDIs between the 10th and 90th percentiles. Spearman’s correlation coefficient for the UDI and each of the weighted UDIs was determined. The median disparity ratio and disparity slope of the weighted UDIs were also calculated and compared with the disparity ratio and slope of the original UDI.
To test the robustness of the UDI, dental indicators were systematically removed from the original set of four. The UDIs for the remaining sets of three and two indicators were calculated. Spearman’s correlation coefficient was used to determine the correlation between the original UDI and each of the newly calculated UDIs.
Variables for percentage employment and weekly household income were already incorporated during SEIFA computation. These variables were re-incorporated into the UDI to emphasise their importance to dental health by effectively re-weighting SEIFA. The effect of including SEIFA was assessed by determining the Spearman correlation coefficient between the UDIs with and without SEIFA included.
Results
The Urban Dental Index
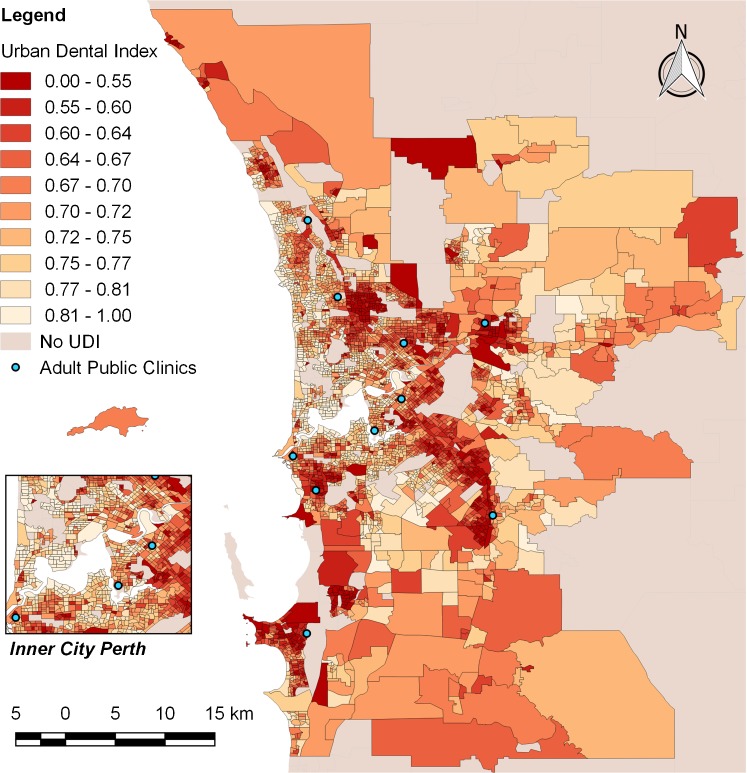
The map of the UDI showed a distinctive pattern of dental health inequality between inner and outer city Perth (Fig. 1). Inner-city SA1s tended to have higher UDI values, and lower risk of poor dental health, compared to SA1s surrounding inner-city Perth. However, more peripheral SA1s further from inner-city Perth exhibited more variation in dental health risk. Despite this variation, the map showed a general increase in dental health risk outside the inner city.
Fig. 1.
Map of Perth displaying the distribution of UDI values. Darker hues represent SA1s with a higher risk of poor dental health. Blue dots represent adult public dental clinics
There were ten adult public dental clinics in the Greater Perth region. All public clinics were located within, or close to, high-risk SA1s. However, there was an uneven distribution of clinics across these high-risk areas.
Comparison with Oral Cellulitis
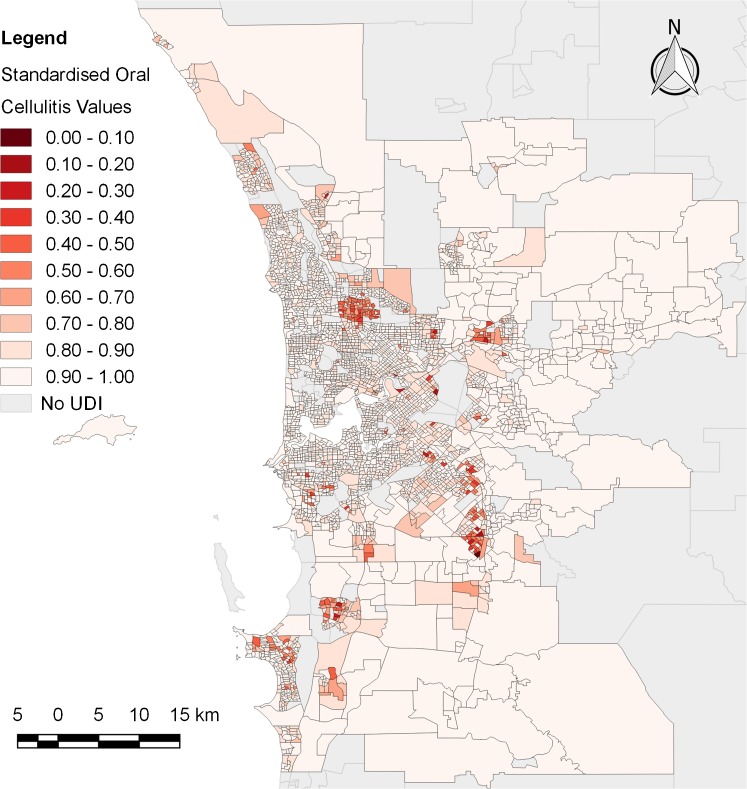
SA1s with a high probability of oral cellulitis (Fig. 2) were synonymous with SA1s which displayed a high risk of poor dental health (Fig. 1). The majority of SA1s (71%) had a low probability of oral cellulitis (standardised value ≥0.9). There was a significant correlation between the UDI and the standardised inverse probability of oral cellulitis at the .05 level (p < .001). The correlation coefficient was 0.25.
Fig. 2.
Map of Perth displaying the standardised inverse probability of oral cellulitis at each SA1. Darker hues represent SA1s with a higher probability of oral cellulitis
Assessing Disparities
The Index plot for Perth had a linear mid-section with deviations on either end similar to the original UHI study (Fig. 3). The distribution of UDI values in Perth produced a moderate disparity ratio (1.69), and disparity slope (0.23).
Fig. 3.
Distribution of the UDI for SA1s in Perth ordered by UDI rank. The dashed lines indicate the separation of the first and last deciles from the eight middle deciles. The first and last decile ranges were used to calculate the disparity ratio. The middle eight deciles (2–9) were used to calculate the disparity slope
Testing the Robustness of the UDI
There was a significant correlation between each of the dental indicators at the .05 level (Table 1). The Spearman correlation coefficients ranged from 0.20 (inverse cellulitis probability with average weighted weekly income) to 0.93 (SEIFA scores with average weighted weekly income).
Table 1.
Multiple correlation matrix (Spearman’s correlation)
| Standardised dental indicators | % employment | Average weighted weekly income | SEIFA score | % non-Aboriginal/ Torres Strait Islander | Inverse cellulitis probability |
|---|---|---|---|---|---|
| % employment | 1 | 0.45* | 0.50* | 0.34* | 0.27* |
| Average weighted weekly income | 0.45* | 1 | 0.93* | 0.50* | 0.20* |
| SEIFA score | 0.50* | 0.93* | 1 | 0.60* | 0.26* |
| % non-Aboriginal/Torres Strait Islander | 0.34* | 0.50* | 0.60* | 1 | 0.40* |
| Inverse cellulitis probability | 0.27* | 0.20* | 0.26* | 0.40* | 1 |
*Correlation is significant at the .05 level (2-tailed), p < .001
Each of the 1000 weighted UDIs were significantly correlated with the original UDI at the .05 level (p < .0001). The slope of the UDI graph was preserved over the 1000 simulated weights between the 10th and 90th percentiles (Fig. 4). There was a decrease in the median disparity ratio of the weighted UDIs compared to the disparity ratio of the original UDI (1.68 versus 1.69). The median disparity slope of the weighted UDIs was equal to the disparity slope of the original UDI (0.23).
Fig. 4.
The effect of weighting on the UDI. Vertical bars represent the range of weighted UDIs between the 10th and 90th percentiles for each SA1
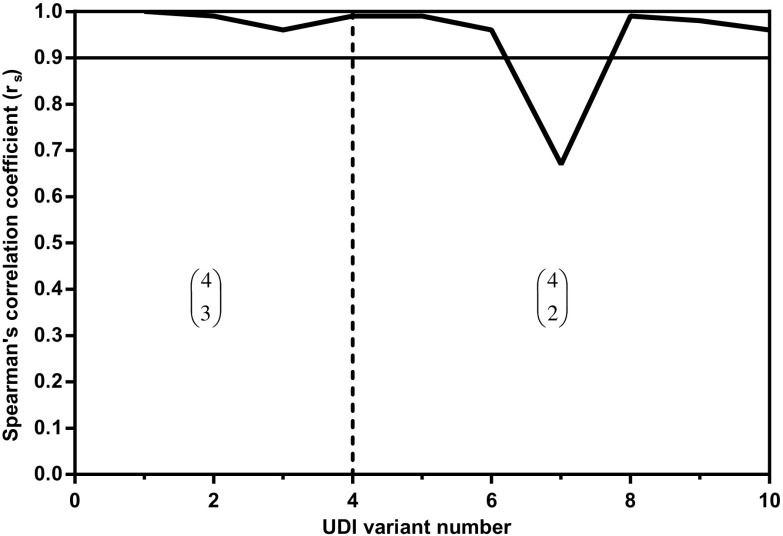
The systematic removal of dental indicators had minimal effect on the UDI. All UDIs were significantly correlated with the original UDI at the .05 level (all p < .0001). Only one of the ten UDI variants had a correlation coefficient of less than 0.9 when compared to the original UDI (Fig. 5). The UDI variant with the lowest correlation coefficient was calculated using percentage employment and percentage non-Aboriginal/Torres Strait Islander as the two dental indicators.
Fig. 5.
Spearman correlation coefficients (r s) for the original UDI and UDI variants with one or two dental indicators removed (N = 10). For example, in the first section, the UDI was calculated using three of the four dental indicators for each combination of four indicators (N = ) = four combinations
There was a significant correlation (r s = 0.99) between the UDIs with and without SEIFA included (p < .0001). On the basis of this correlation, SEIFA was included in the final UDI despite overlap between the SEIFA score variables and two of the dental indicators (percentage employment and average weighted weekly income).
Discussion
Dental health indicators reveal the complex interplay of factors contributing to dental disease but are of little use during service planning. These indicators become useful to policy makers when combined to form a composite measure which can be mapped to identify area specific dental health inequity.
The map of UDI values in Perth shows a similar pattern to the local health disparities observed in Tokyo in the original UHI study [7]. There is an increase in the frequency of SA1s with low UDI values outside the inner-city region of Perth. Low UDI values are synonymous with a high risk of poor dental health. This trend has significant implications for dental service planning because of the location of primary practices.
Dental practices in Australia are more numerous in metropolitan centres compared to regional and remote areas [17]. This pattern follows the “inverse care law” which states: “the availability of good medical care tends to vary inversely with the need for it in the population served” [18]. This pattern arises because dental practice locations are driven by business sustainability. A dental practice is likely to be successful in a densely populated area serving the needs of individuals with high SES. However, low SES is a significant risk factor for dental disease and is a priority for public service planning [19]. Policy makers may use the UDI map of Perth to identify areas most in need of public dental services.
There are currently ten adult public dental clinics in the Greater Perth region. Although these clinics are located within or close to SA1s with high dental health risk, they are unlikely to be sufficient over such a large population area. Seven of the clinics appear to be on the periphery of high-risk census areas. This pattern suggests there has been a shift in high-risk SA1s in the time since the clinics were originally planned and constructed. The UDI will be useful for policymakers to address this issue, as well as the uneven distribution of public clinics across the Greater Perth region.
Population centres such as Rockingham to the southwest of the city, and Armadale to the southeast, each appear dependent on a single public clinic. These areas are in need of more public services, particularly as the population of Perth increases [20]. Additional public dental clinics will help reduce waiting times for general services and reduce potentially preventable dental-related hospitalisation separations [3].
Although there is a general increase in low UDI values outside the inner-city region of Perth, there is more variation between high and low UDI values towards the periphery of the Greater Perth region. This variation arises because Perth is a large conurbation formed by the joining of several sub-regional population centres [21]. Each population centre has different historical and environmental factors which influence dental health risk. An example is the city of Kwinana, which forms the cluster of low UDI SA1s on the south-west point of the Greater Perth region. Kwinana has high levels of public housing and is adjacent to the Kwinana industrial area [22]. The social stigma attached to Kwinana, and perception of poor air quality [22], make this area undesirable for individuals with high SES. Consequently, there are a high frequency of individuals with low SES, and high risk of dental disease, living in this area.
Oral cellulitis is a useful indicator to test the validity of the UDI because it is an extreme example of poor dental health. This severe oral infection primarily affects socioeconomically disadvantaged individuals [15]. Patients with the condition will have spent a prolonged period without treatment enabling a minor infection to progress to an advanced stage. In theory, if all Australians had access to general dental services there would be zero incidence of the condition. The probability of oral cellulitis, therefore, acts as a measure of the ability of individuals to access primary dental services.
The majority of SA1s have a low probability of oral cellulitis because it is a rare condition [15]. However, the consistency of the small number of SA1s with a high probability of oral cellulitis and the UDI ensure there is a significant correlation. These results indicate that the UDI is an excellent predictor of dental health outcomes despite no direct dental health data being incorporated.
We performed an initial investigation of the extent of the variation in dental health risk in Perth using the disparity ratio and slope. These measures appear moderate for Perth; however, comparison with more cities is required to determine if this is an accurate assumption. We also investigated the relationship between our chosen dental indicators. One of the major assumptions of the UHI method is that a vast number of indicators and determinants will reflect underlying health inequity [7]. The significant correlation between the dental indicators confirms their association with SES and dental health outcomes. The significant correlation between the 1000 weighted UDIs and the original UDI also suggests each dental indicator has comparable importance to the final UDI value.
The significant correlation between the original UDI and the UDIs calculated with indicators systematically removed demonstrates the robustness of the UDI method. The results also suggest it is possible to create an UDI with similar predictive value using fewer dental indicators. While this is possible, an UDI including more dental indicators helps to protect against the influence of “weaker” indicator measures at each SA1. Census data is considered reliable; however, there are sources of error which can affect the strength of individual indicator values. Error can be introduced into census measures through incorrect processing and participant responses, partial or non-responses, and undercount [23].
The ability of the UDI to comprise many different dental health indicators and achieve a similar predictive outcome makes it a powerful tool for dental health analysis. There are many dental health factors not considered in this project. For example, age is an important predictor of dental health. Individuals 65 years and older have the greatest incidence of oral disease in Australia [3]. We chose to emphasise SES status; however, it is possible to combine other census measures for different predictive purposes.
A major limitation of the UDI method is the availability and reliability of relevant data. Direct dental health data is not readily available at a national level at fine resolution. This problem is overcome in this analysis by using census measures as proxy variables for risk of poor dental health. The UDI is also unable to detect a small subset of individuals with low SES within a larger population group. We used the smallest area units designated by the ABS to reduce the amount of concealed variation. Despite this issue, the UDI is successful at detecting large groupings of individuals with low SES. It is important to remember that the purpose of the UDI is to identify where many high-risk SA1s congregate. The best use of government resources is to place public dental clinics where there are a high frequency of individuals who need subsidised dental care.
The next step in the UDI project is to create a national Index for comparing dental health risk across urban areas. A national UDI will be useful for policy makers at a federal, state, and territory level to determine which urban areas contain individuals who have a high risk of poor dental health. These areas should be a primary target for government dental health improvement schemes and initiatives. Following on from the national UDI, the project may be expanded to incorporate international urban areas and rank Australia’s dental health risk on a global scale.
Acknowledgements
Research was supported by the Dr Margaret Loman-Hall Scholarship and the Centenary Trust for Women Margaret Mills Memorial Scholarship. The authors would like to thank the School of Anatomy, Physiology and Human Biology, and Captain John Mills, for the assistance these scholarships provided.
Abbreviations
- ABS
Australian Bureau of Statistics
- SA1
Statistical Area Level 1
- SEIFA
Socio-Economic Indexes for Areas
- SES
Socioeconomic status
- UDI
Urban Dental Index
- UHI
Urban Health Index
References
- 1.Lalloo R, Kroon J. Analysis of public dental service waiting lists in Queensland. Aust J Prim Health. 2015;21:27–31. doi: 10.1071/PY13048. [DOI] [PubMed] [Google Scholar]
- 2.Luzzi L, Spencer AJ. Public dental service utilization among adults in South Australia. Aust Dent J. 2009;54:154–60. doi: 10.1111/j.1834-7819.2009.01109.x. [DOI] [PubMed] [Google Scholar]
- 3.Australian Institute of Health and Welfare. Oral health and dental care in Australia: key facts and figures 2015. 2016. Available at http://www.aihw.gov.au/publication-detail/?id=60129554382. Accessed 20 Mar 2016.
- 4.Jamieson LM, Sayers SM, Roberts-Thomson KF. Clinical oral health outcomes in young Australian Aboriginal adults compared with national-level counterparts. Med J Aust. 2010; 192: 558–61. Url: https://www.mja.com.au/journal/2010/192/10/clinical-oral-health-outcomes-young-australian-aboriginal-adults-compared. Accessed 31 Mar 2016. [DOI] [PubMed]
- 5.Jamieson LM, Parker EJ, Armfield JM. Indigenous child oral health at a regional and state level. J Paediatr Child Health. 2007;43:117–21. doi: 10.1111/j.1440-1754.2007.01029.x. [DOI] [PubMed] [Google Scholar]
- 6.Australian Institute of Health and Welfare. The health and welfare of Australia’s Aboriginal and Torres Strait Islander peoples 2015. 2015. Available at http://www.aihw.gov.au/publication-detail/?id=60129550168. Accessed 3 Apr 2016.
- 7.Rothenberg R, Weaver SR, Dai D, Stauber C, Prasad A, Kano M. A flexible urban health index for small area disparities. J Urban Health. 2014;91(5):823–35. doi: 10.1007/s11524-014-9867-6. [DOI] [PMC free article] [PubMed] [Google Scholar]
- 8.Weaver SR, Dai D, Stauber C, Luo R, Rothenberg R. The Urban Health Index: a handbook for its calculation and use. World Health Organization. 2014. Available at http://www.who.int/kobe_centre/publications/urban_health_index_toolkit/en/. Accessed 1 Mar 2016.
- 9.United Nations Development Programme . Human Development Report 2011. Sustainability and equity: a better future for all. New York: Palgrave Macmillan; 2011. [Google Scholar]
- 10.Australian Bureau of Statistics. 1270.0.55.001 - Australian Statistical Geography Standard (ASGS): volume 1 - Main Structure and Greater Capital City Statistical Areas, July 2011. 2010. Available at http://www.abs.gov.au/ausstats/abs@.nsf/0/7CAFD05E79EB6F81CA257801000C64CD?opendocument. Accessed 4 July 2016.
- 11.Australian Bureau of Statistics. 2011.0 - Information paper: census of population and housing - proposed products and services, 2016. 2015. Available at http://www.abs.gov.au/ausstats/abs@.nsf/Lookup/by%20Subject/2011.0~2016~Main%20Features~Socio-Economic%20Indexes%20for%20Areas~10007. Accessed 26 Oct 2016.
- 12.Australian Bureau of Statistics. 2033.0.55.001 - Census of Population and Housing: Socio-Economic Indexes for Areas (SEIFA), Australia, 2011. 2013. Available at http://www.abs.gov.au/ausstats/abs@.nsf/Lookup/2033.0.55.001main+features100042011. Accessed 8 May 2016.
- 13.Australian Bureau of Statistics. 1259.0.30.001 - Australian Standard Geographical Classification (ASGC) Digital Boundaries, Australia, July 2011. 2011. Available at http://www.abs.gov.au/AUSSTATS/abs@.nsf/DetailsPage/1259.0.30.001July%202011?OpenDocument. Accessed 10 July 2016.
- 14.Government of Western Australia Department of Health. Dental Health Services. 2008. Available at http://www.dental.wa.gov.au/. Accessed 21 Oct 2016.
- 15.Anjrini AA, Kruger E, Tennant M. A 10-year retrospective analysis of hospitalisation for oral cellulitis in Australia: the poor suffer at 30 times the rate of the wealthy. FDJ. 2014;5:8–13. doi: 10.1308/204268514X13859766312430. [DOI] [Google Scholar]
- 16.George R, Tennant M, Kruger E. Hospitalisations for removal of impacted teeth in Australia: a national geographic modelling approach. Rural Remote Health. 2012; 12: 2240. Url: http://www.rrh.org.au/publishedarticles/article_print_2240.pdf. Accessed 18 Nov 2016. [PubMed]
- 17.Tennant M, Kruger E. A national audit of Australian dental practice distribution: do all Australians get a fair deal? Int Dent J. 2013;63:177–82. doi: 10.1111/idj.12027. [DOI] [PMC free article] [PubMed] [Google Scholar]
- 18.Hart JT. The inverse care law. Lancet. 1971;297(7696):405–12. doi: 10.1016/S0140-6736(71)92410-X. [DOI] [PubMed] [Google Scholar]
- 19.Sanders AE. Social Determinants of Oral Health: conditions linked to socioeconomic inequalities in oral health and in the Australian population. 2007. Available at http://www.aihw.gov.au/publication-detail/?id=6442468051. Accessed 4 Mar 2016.
- 20.Australian Bureau of Statistics. 3218.0 - Regional Population Growth, Australia, 2011–12. 2013. Available at http://www.abs.gov.au/ausstats/abs@.nsf/Products/3218.0~2011-12~Main+Features~Western+Australia?OpenDocument. Accessed 9 Sept 2016.
- 21.Department of Planning: Western Australian Planning Commission. Directions 2031 and Beyond. 2013. Available at https://www.planning.wa.gov.au/publications/826.asp. Accessed 11 Sept 2016.
- 22.MacLachlan I, Horsley J. New town in the bush: planning knowledge transfer and the design of Kwinana, Western Australia. J Plan Hist. 2015;14(2):112–34. doi: 10.1177/1538513214543986. [DOI] [Google Scholar]
- 23.Australian Bureau of Statistics. Quality declaration. 2016. Available at http://www.abs.gov.au/websitedbs/censushome.nsf/home/qualitydeclaration. Accessed 9 Sept 2016.


