Fig. 3.
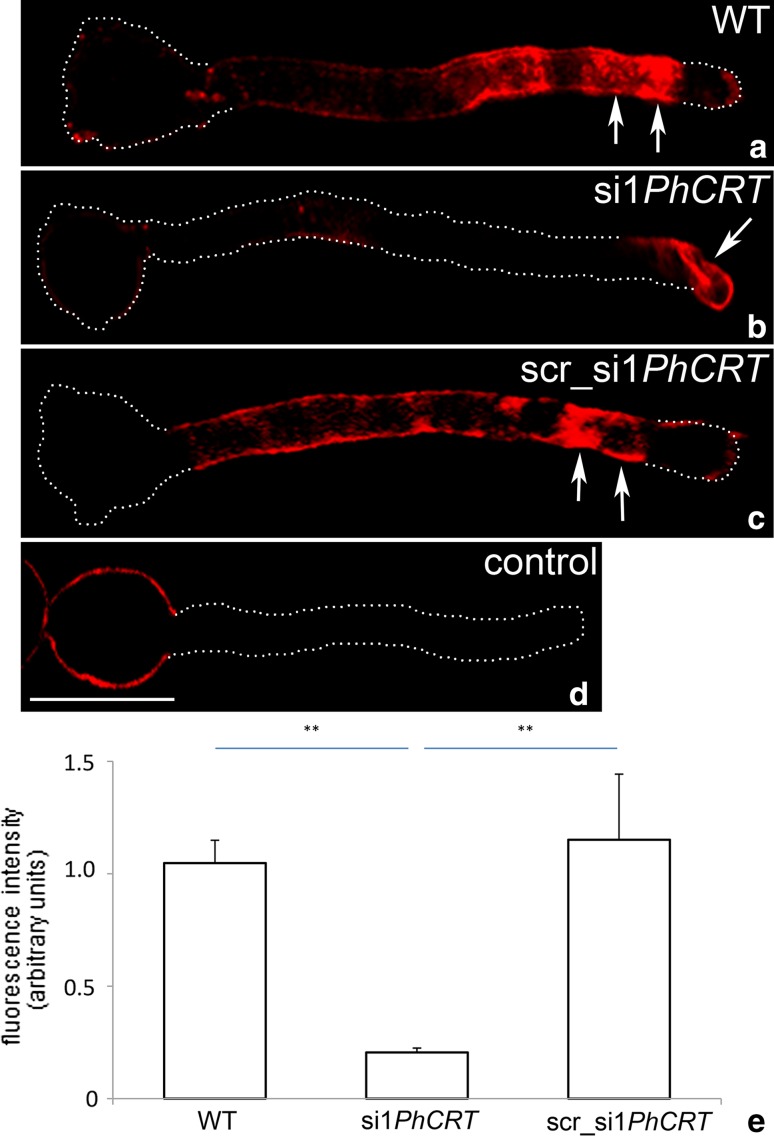
Quantitative analyses of CRT in Petunia WT (a), si1PhCRT (b), and scr_si1PhCRT (c) elongated pollen tubes. Both in WT and scr_si1PhCRT pollen tubes, CRT was preferentially localized in the distal regions, where intense labeling was observed adjacent to the peripheral cytoplasm of the tube and accumulated at the subapical domain (a, c, arrows), whereas the growing tips were lack of the labeling. In contrast, only residual immunofluorescence abnormally localized to the apical cytoplasm was detected in si1PhCRT pollen tube (b, arrow). d Negative immunocytochemistry control. e The level of CRT was 80% lower in si1PhCRT pollen tubes compared to WT and scr_si1PhCRT tubes. Graphs show the relative CRT levels in pollen tubes elongating in different culture conditions (mean of 20 replicates for each experiment variant and standard deviation). Arbitral units on the y-axis show total immunofluorescence intensity (pixel). Statistical analysis was carried out by one-way ANOVA (**P ≤ 0.01). Bar 50 μm

