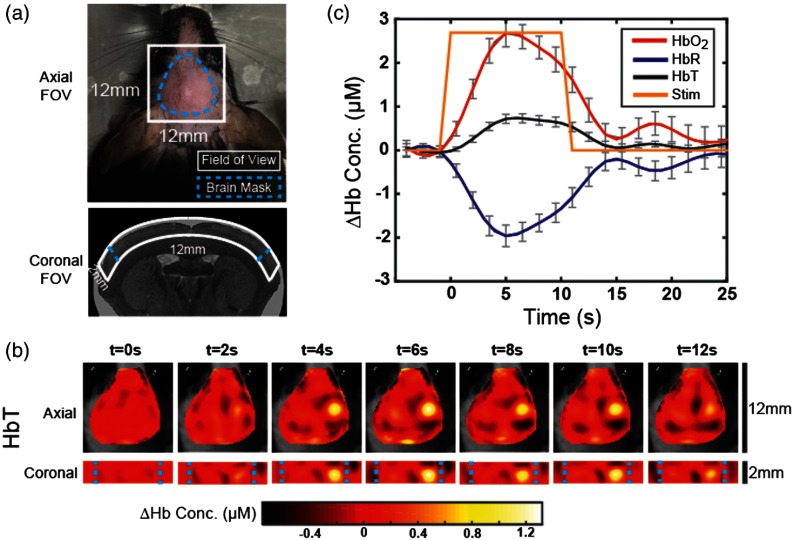
Fig. 5.
Noninvasive imaging of evoked cortical responses in the mouse. (a) Dotted lines show the FOVs for axial and coronal slices. The curvature of the cortex, as evident in the coronal FOV, was approximated by a slab geometry. (b) Following electrical stimulation of the left forepaw, we observe an increase in total hemoglobin concentration in the right hemisphere. An average axial slice through the maximum layer and its two neighboring axial slices is masked by a manually determined brain mask and overlaid on a grayscale image of the mouse head. Coronal slices through the peak voxel in the axial slice show the evoked response up to 2 mm beneath the surface of the scalp. (c) The average temporal response of voxels of the peak response were used to calculate time courses for , HbR, and HbT. Magnetic resonance image of the mouse brain is courtesy of the Duke Center for In Vivo Microscopy,20 accessed via the International Neuroinformatics Coordinating Facility Scalable Brain Atlas.21

