Abstract
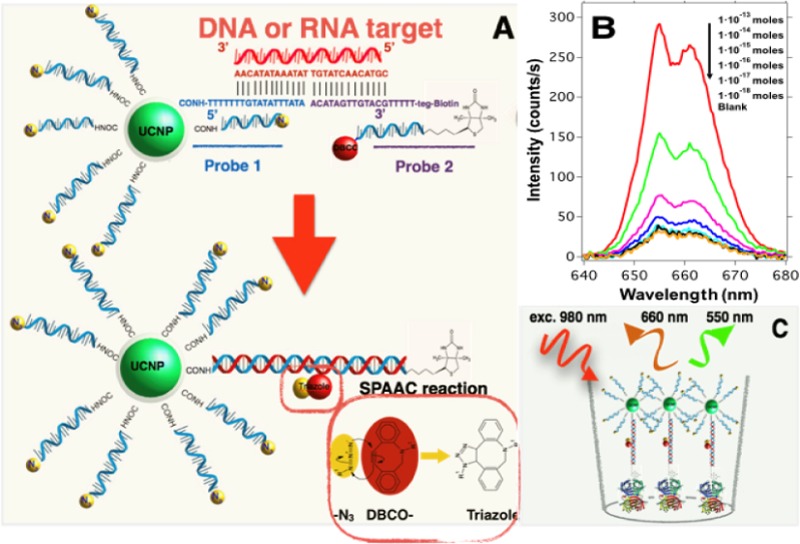
We present a sensor that exploits the phenomenon of upconversion luminescence to detect the presence of specific sequences of small oligonucleotides such as miRNAs among others. The sensor is based on NaYF4:Yb,Er@SiO2 nanoparticles functionalized with ssDNA that contain azide groups on the 3′ ends. In the presence of a target sequence, interstrand ligation is possible via the click-reaction between one azide of the upconversion probe and a DBCO-ssDNA-biotin probe present in the solution. As a result of this specific and selective process, biotin is covalently attached to the surface of the upconversion nanoparticles. The presence of biotin on the surface of the nanoparticles allows their selective capture on a streptavidin-coated support, giving a luminescent signal proportional to the amount of target strands present in the test samples. With the aim of studying the analytical properties of the sensor, total RNA samples were extracted from healthy mosquitoes and were spiked-in with a specific target sequence at different concentrations. The result of these experiments revealed that the sensor was able to detect 10–17 moles per well (100 fM) of the target sequence in mixtures containing 100 ng of total RNA per well. A similar limit of detection was found for spiked human serum samples, demonstrating the suitability of the sensor for detecting specific sequences of small oligonucleotides under real conditions. In contrast, in the presence of noncomplementary sequences or sequences having mismatches, the luminescent signal was negligible or conspicuously reduced.
Keywords: upconversion, nanoparticles, DNA, sensor, interstrand ligation
1. Introduction
In recent years, the advances in deep sequencing techniques have facilitated the discovery of the presence of noncoding nucleic acids, such as microRNAs (miRNAs), small-interfering RNAs (siRNAs), and Piwi-interacting RNAs (piRNAs), involved in the regulation of gene expression, modulating protein production,1,2 and lately used as biomarkers for different diseases. Furthermore, these biomarkers appear at the very beginning of the disease, facilitating early diagnostics.3,4 Among them, miRNAs are the best known due to their potential role as biomarkers in cancer, cardiovascular diseases,5,6 as well as in many viral infections such as HIV-1,7 Ebola,8 and so forth. Other small RNAs like piRNAs, small nucleolar RNAs, and small nuclear RNAs are also gaining support as biomarkers for male infertility9 or for viral infections like that produced by DENV2.10 However, in most cases, proper diagnosis of disease requires the analysis of multiple sequences (multiplexing) by qRT-PCR or next-generation sequencing, limiting its application to wealthy regions as these techniques require specific labs, trained personnel, and expensive reagents. In addition, these techniques are time consuming and difficult to apply as a screening tool, especially in developing countries. These drawbacks have prompted scientists to investigate alternative methods that could be used as screening tools in the detection of these oligonucleotides without the requirement of enzymatic transcription and amplification. Among the new technologies, the use of molecular beacons based on upconversion nanoparticles has opened the possibility to create highly sensitive systems capable of analyzing the presence of these oligonucleotides at extremely low concentrations in a fast, cheap and easy way.11−18 These systems exploit the use of lanthanide-doped nanoparticles, which can absorb two or more low energy photons and emit one at higher energy.19,20 In addition, these nanoparticles have interesting photoluminescent properties, like high photostability, the absence of blinking and photobleaching, along with large anti-Stokes shifts, which allow the creation of robust analytical systems with low backgrounds and high signal-to-noise ratios.19,21−26 Furthermore, the narrow emission bands exhibited by these nanoparticles and the possibility to tune their emission wavelengths make them ideal candidates to be used for multiplexed analytical systems27−29 in immunoassays (ULISA)30 where the upconversion nanoparticles (UCNPs) are linked to antibodies or aptamers25 as reporters. In these analytical systems, the target and the functionalized UCNP are captured on a solid support giving a signal proportional to the amount of target. The high affinity and specificity between the UCNPs and the targets yield highly thermodynamically stable complexes, which allows stringent cleaning processes of the capture-surface that permit washing away of any nonspecifically physisorbed UCNPs. This yields low detection limits comparable to those obtained by enzymatic amplification techniques like ELISA. However, when this strategy is applied to the detection of small oligonucleotides, like miRNAs (20–30 bp), a major problem related to the low thermodynamic stability of the complexes prevents the use of stringent cleaning steps, which in turn hampers target detection.
In this work, we present an analytical system that allows the detection of oligonucleotides (RNA or DNA) on a solid support, which is based on ssDNA functionalized NaYF4:Yb,Er@SiO2 nanoparticles that contain azide groups on the 3′ ends. In the presence of a target sequence, an interstrand ligand reaction occurs via a click-reaction between an azide of the upconversion probe and a DBCO-ssDNA-biotin probe present in the solution. As a result of this specific and selective reaction, biotin-functionalized upconversion nanoparticles are produced. After that, the biotin-functionalized upconversion nanoparticles are selectively captured on a streptavidin-coated surface, producing an upconversion emission intensity that is proportional to the target concentration present in the sample. The validity of the system was checked using samples containing total RNA extracted from mosquitoes or human serum samples that have been doped with a synthetic sequence that appears in the small subunit ribosomal RNA of the Plasmodium falciparum and which was used as a target model. The result of these experiments demonstrated an exceptionally low detection limit close to 1 × 10–17 moles per well (100 fM). The simplicity and potential of the presented system could allow its use as a screening tool for multiple RNA or DNA sequence analyses.
2. Materials
Methanol (99.9%), n-hexane (95%), N,N-dimethylformamide anhydrous (99.8%), tetraethyl orthosilicate (99.999%), polyoxyethylene (5) nonylphenylether branched (IGEPAL CO-520), ammonium hydroxide solution (30%), (3-aminopropyl)triethoxysilane (99%), succinic anhydride (99%), Bionic buffer 10× concentrated, HEPES 99.5%, NaCl BioXtra 99.5%, dimethyl sulfoxide 99.9%, N-(3-(dimethylamino)propyl)-N′-ethylcarbodiimide hydrochloride (99%), and N-hydroxysulfosuccinimide sodium salt (Sulfo-NHS) (98%) were purchased from Sigma-Aldrich and used as received. The modified DNA sequences NH2-ssDNA-N3 probes 1 and 2 were purchased from ATDBio. The target strands and the noncomplementary strands were acquired from Invitrogen. The mismatch strands were acquired from Integrated DNA Technologies. A complete description of the sequences is given in Table 1. Streptavidin-coated well-plates (UniverSA96) were purchased from Kaivogen (Turku, Finland).
Table 1. Oligonucleotide Sequences Used in This Work.
| name | sequence |
|---|---|
| probe 1 | 5′ NH2-C(6)-TTTTT-TT-GTA-TAT-TTA-TA-N3 3′ |
| probe 2 | 5′ DBCO-A-CAT-AGT-TGT-ACG-TTTTT-Bio-teg 3′ |
| targets | *DNA 5′ CGT-ACA-ACT-ATG-TTA-TAA-ATA-TAC-AA 3′ |
| *RNA 5′ CGU-ACA-ACU-AUG-UUA-UAA-AUA-UAC-AA 3′ | |
| one mismatch (lateral) | 5′ CGT-AAA-ACT-ATG-TTA-TAA-ATA-TAC-AA 3′ |
| one mismatch (middle) | 5′ CGT-ACA-ACT-ATG-TCA-TAA-ATA-TAC-AA 3′ |
| three mismatches | 5′ CGT-ACA-ACT-ATT-CCA-TAA-ATA-TAC-AA 3′ |
| noncomplementary | 5′ CAG-AAG-UCA-GGU-CGG-AUU-AAG-CC 3′ |
3. Characterization
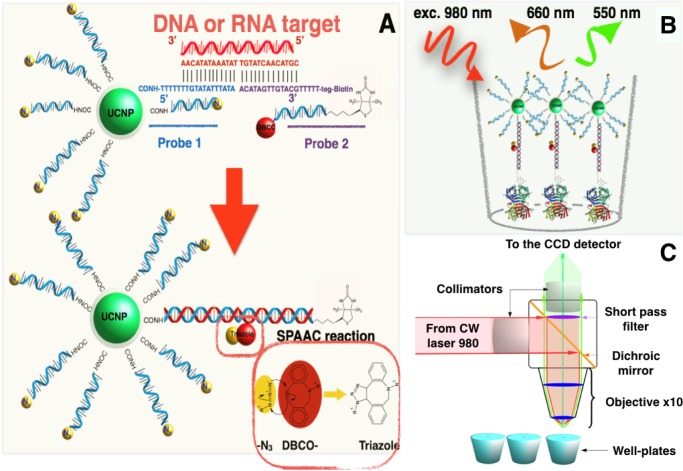
Transmission electron microscopy (TEM) analyses were carried out using a JEOL JEM 1010 operated at 80 kV coupled with a digital camera GATAN MegaView II. High-resolution TEM (HRTEM) studies were performed in a JEOL JEM 2100 operated at 200 kV with a digital camera GATAN CCD Orius SC1000. Z-potential experiments were carried out using a Malvern Nano-ZS. Thermogravimetric experiments were performed using a TGA/DSC-1 (Mettler-Toledo) working under an air atmosphere. The upconversion emission spectra were collected from the well-plate using a homemade system as depicted in Scheme 2C. The light beam from a 3 W CW laser (MDL-H-980-3W) working at 980 nm was transmitted through a 200 μm core fiber, which was coupled to a collimator lens. Then, the laser beam was reflected toward the well-plate using a short-pass dichroic mirror (Thorlabs DMSP950R) and focused on the sample using a 10× objective. The upconversion luminescence coming from the well-plate passed through the short-pass dichroic mirror and through a short-pass filter (Thorlabs FES900), which blocks the excitation wavelength. A collimator lens focused the light into an optical fiber that goes to the spectrometer Glacier X (B&W Tek).
Scheme 2. Schematic Illustration of the Action Mechanism of the Proposed Sensor.
(A) The presence of the target sequence allows the hybridization and brings in close proximity the azide group on probe 1 and the DBCO groups on probes 1 and 2 producing the SPAAC reaction that gives NaYF4;Yb,Er@SiO2-dsDNA-biotin nanoparticles. (B) Biotin moieties on the surface of the UCNPs allow their immobilization on the surface of the streptavidin-coated well-plates. (C) The fluorescence detection was performed using the homemade device.
4. Experimental Section
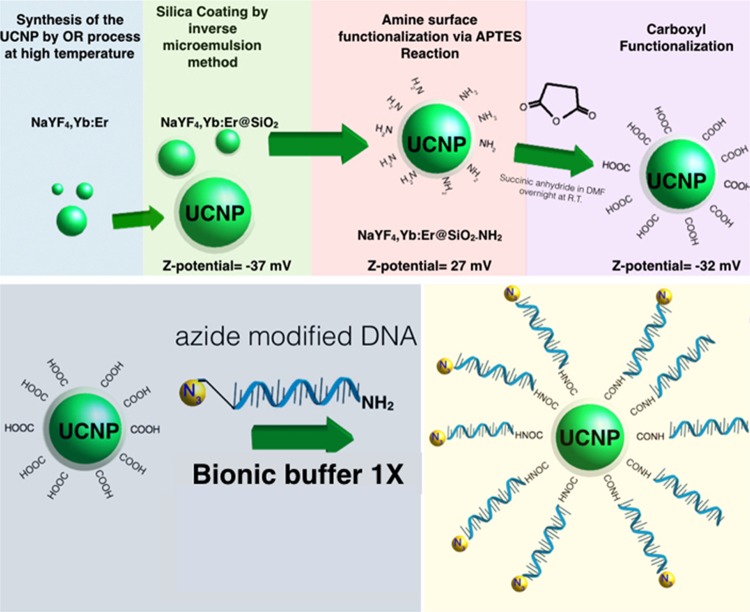
The synthesis of the upconversion nanoparticles and their functionalization was carried out using sequential steps that are described in detail within the Supporting Information. Scheme 1 summarizes the chemical route followed to obtain the upconversion nanoparticles.
Scheme 1. Schematic Illustration of the Chemical Route for the Synthesis and Functionalization of NaYF4:Yb,Er@SiO2-DNA-N3 Nanoparticles.
5. Results and Discussion
5.1. Particle Preparation, Characterization, and Functionalization
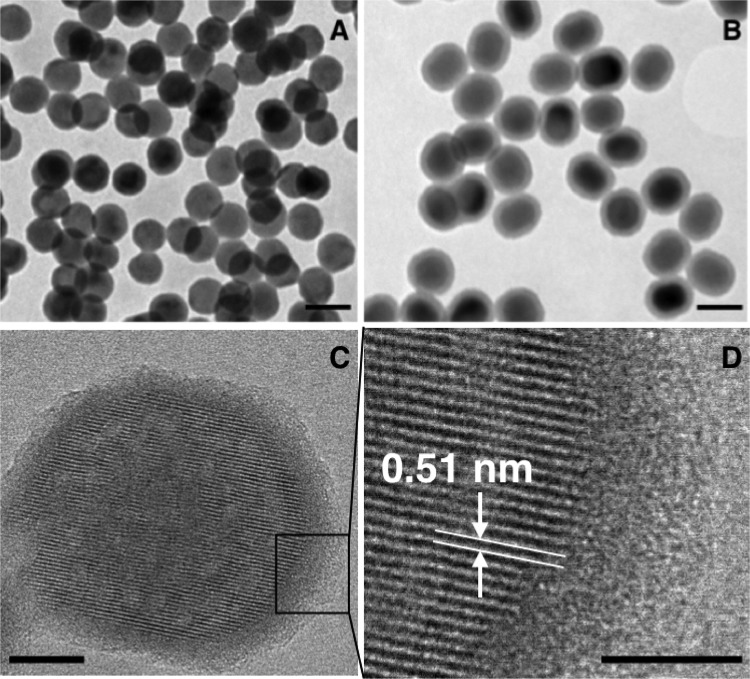
The synthesis of the fluorescent nanoparticles afforded monodisperse nanoparticles with a mean diameter of 36 ± 3 nm, as obtained from the TEM micrograph (see Figure 1A). X-ray energy dispersive spectroscopy analysis (Figure S1A) gave a composition of NaY0.792F4:Yb0.189,Er0.019 while the X-ray diffraction pattern of the particles (Figure S1B) demonstrated that they can be indexed to the hexagonal phase. In Figure 1B, one can observe a thin and homogeneous layer around each nanoparticle with a mean thickness of 7 nm, which was the result of the silica deposition reaction. Figure 1C,D depicts an HRTEM photograph of a NaYF4:Yb,Er@SiO2, nanoparticle, showing its crystalline structure in contrast with the amorphous silica shell. The silica layer confers hydrophilic behavior to the nanoparticles and permits their dispersion in aqueous media, as well as being a functional platform for their successive functionalization with ssDNA, as depicted in Scheme 1. A complete description of the nanoparticle functionalization and characterization is given in the Supporting Information. Figure S1C shows the upconversion luminescence spectrum of the NaYF4:Yb,Er@SiO2 nanoparticles under excitation with a 980 nm CW laser. We observed two green emission peaks near 525 and 545 nm due to the 2H11/2 → 4I15/2 and 4S3/2 → 4I15/2 transitions of the Er3+ ions, respectively. A red emission, with similar intensity, near 655 nm is also observed due to the 4F9/2 → 4I15/2 transition of the Er3+ ions.
Figure 1.
TEM micrographs of the synthesized NaYF4;Yb,Er nanoparticles (A) and NaYF4;Yb,Er@SiO2 nanoparticles (B). (C) HRTEM image of a NaYF4;Yb,Er@SiO2 nanoparticle. (D) Magnification of the image in (C). The scale bars in (A) and (B) are 50 nm, whereas in (C) and (D) they are 10 and 5 nm, respectively.
5.2. Well-Plate Signal Detection and Protocol Optimization
5.2.1. Interstrand Ligand Reaction
The sensor is based on a hybridization process that renders an interstrand ligand reaction between the NaYF4;Yb,Er@SiO2-ssDNA-N3 strand (probe 1) and the DBCO-ssDNA-biotin strand (probe 2). This hybridization requires the presence of a target sequence, which acts as splint strand bringing the probes 1 and 2 closer, yielding the strain-promoted alkyne–azide cycloaddition (SPAAC) reaction,31 as seen in Scheme 2. This process permits in a subsequent step the selective capture of the resulting NaYF4;Yb,Er@SiO2-dsDNA-biotin nanoparticles on a streptavidin-coated surface. To analyze the performance of the sensor, we computed the intensity of the upconversion emission by integrating the emission spectra around the red band between 640 and 680 nm.
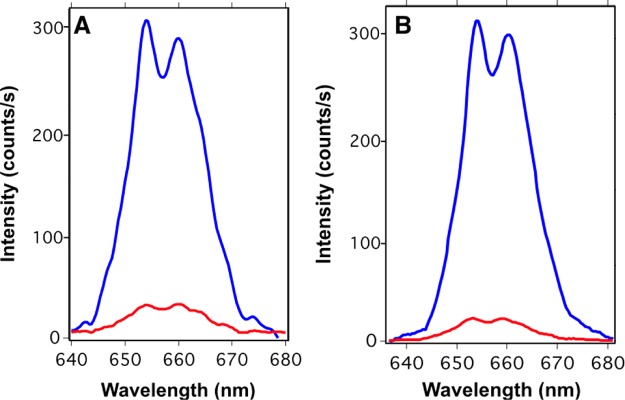
This strategy was designed to provide robustness to the sensor, because, in the absence of the click-reaction, any variation of the physicochemical properties of the media, like temperature or ionic strength, could revert the hybridization process, inducing the separation of probe 2 from probe 1, particularly when targets with low melting temperatures are involved in the hybridization. Therefore, the interstrand ligation stabilizes the incorporation of biotin moieties on the NaYF4;Yb,Er@SiO2-dsDNA nanoparticles and permits use of a stringent cleaning process to remove the physisorbed UCNPs without the risk of removing the selectively captured UCNPs. To highlight the relevance of the click-reaction process, we compared the photoluminescence obtained from a system designed to enable the interstrand ligand reaction with another system unable to yield such a reaction (see Figure 2). In both cases, we washed the solid support with different cleaning protocols.
Figure 2.
Luminescence spectra obtained from NaYF4;Yb,Er@SiO2-ssDNA-N3 and DBCO-ssDNA-biotin able to produce interstrand ligation (blue line) and NaYF4;Yb,Er@SiO2-ssDNA-N3 and ssDNA-biotin, which are unable to produce interstrand ligation (red line), in the presence of 10–13 moles per well (1 nM) of target sequence and after washing the solid support with 10 mM of HEPES buffer and different concentrations of NaCl at 50 °C: 150 mM in (A) and 50 mM in (B).
As one can observe from these experiments, there was a notable reduction of the photoluminescent intensity, when probes 1 and 2 were not able to yield the interstrand ligand reaction. This reduction could be attributed to a denaturalization of the double strands during the solid support cleaning process, which separates probes 1 and 2, washing away the UCNPs from the surface. When the interstrand ligand reaction takes place, probes 1 and 2 are still bound together after denaturalization and therefore remain attached on the well surface. Consequently, the NaYF4;Yb,Er@SiO2-dsDNA-biotin nanoparticles with inter-strand that have undergone the interstrand ligand reaction resist the cleaning steps with the buffer at 50 °C or with buffer with low ionic strength, which in principle could denaturalize the double strands constituted by the short oligonucleotides. Figure S2 depicts the results when the same experiments were carried out in the absence of target sequences. From these experiments we can observe that the background signals are basically the same and due to nonspecific physisorption.
5.2.2. Binding Kinetic Experiments
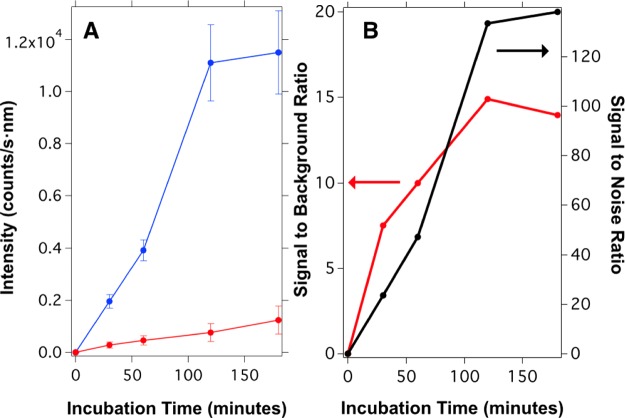
One of the parameters studied to optimize the signal of the sensor was the incubation time required by the streptavidin-coated well-plate to capture the maximum amount of biotin-functionalized nanoparticles. These experiments were performed by measuring the fluorescence signal for three independent samples with a fixed target amount of 10–12 moles per well (10 nM) and comparing this signal with the one obtained from three blank samples. Figure 3 shows the luminescence signal collected from the streptavidin-coated surface after being incubated with 1 μg of UCNP@SiO2-dsDNA-biotin produced by the hybridization of 10–12 moles of the target and 2 × 10–12 moles (20 nM) of probe 2. Figure 3A shows the increment of the luminescence signal as a function of time, reaching a plateau after 120 min. The time evolution of simple receptor–ligand interactions is usually described by a single exponential process with an observed rate constant kobs that depends on the kinetic parameters, that is, the association (kon) and dissociation (koff) rate constants, and the ligand concentration (C), so that kobs = koff(C/Kd + 1).32 By fitting our data to an exponential function, we obtained a value of the rate constant of kobs = 3.8 × 10⁻⁴ s–1, which means that the half-time of the equilibrium reaction is nearly 30 min. Assuming an equilibrium dissociation constant of Kd = Koff/Kon = 10–12 M,33 and a ligand concentration of 10–10 M, the calculated kon and koff values for our system would be 3 × 10⁶ M–1 s–1 and 3 × 10⁻⁶ s–1, respectively. These values are similar to the ones found in other works.34Figure 3A also shows the signal obtained from the blank samples (background signal), which increases linearly with time (red line). Therefore, specific and nonspecific interactions exhibit different kinetics, which must be taken into account to optimize the system. For this reason, we analyzed the time evolution of the signal to background ratio and the result is shown in Figure 3B. We can observe that the signal to background ratio reaches a maximum value of 15 after 120 min (see red line). However, the signal-to-noise ratio (S/N = average signal/standard deviation of the blank) obtained from the measurements also reaches a plateau with a value of 140 after 120 min, as depicted in Figure 3B (black line). As a result of these kinetic experiments, we decided to use an incubation time of 120 min for all experiments.
Figure 3.
(A) Time evolution of the upconversion signal on the streptavidin-coated well-plate during the incubation process. The blue points correspond to the signal measured after incubating the biotin-functionalized UCNPs obtained from hybridization with 1 μg of probe 1 and 2 × 10–12 moles of probe 2 with 10–12 moles (10 nM) of target sequence per well. The red points represent the signal of the blank samples using the same procedure described before but without the target sequence. (B) Signal-to-background ratio (left axis) and signal-to-noise ratio (right axis) as a function of incubation time.
5.2.3. Sensor Calibration
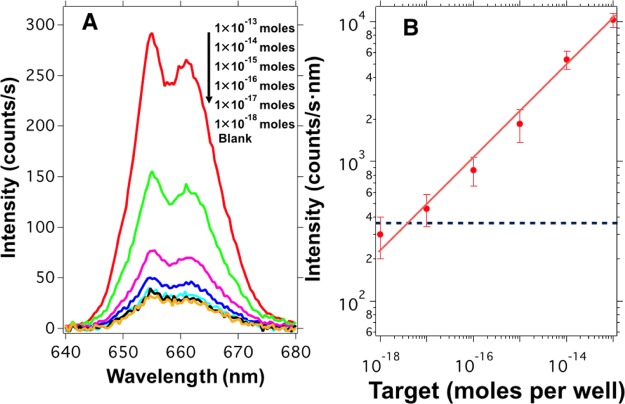
Figure 4A shows the red upconversion emission spectra collected from the multiwell-plates for different concentrations of target sequence. Here, we can see that the intensity of the emission spectrum collected from the multiwell-plate gradually increases with the amount of complementary target sequence added during the hybridization step. This result indicates that the presence of higher amounts of target sequences yields more biotin-functionalized UCNPs that can be captured on the streptavidin-coated wells during the incubation process. We computed the intensity of the upconversion emission by integrating the emission spectra around the red peak. The result versus the target concentration is shown in Figure 4B in a log–log plot demonstrating the feasibility of our sensor. Each point of this graph was obtained averaging the luminescence intensity of 10 different positions at each well from three independent samples; the shown intensities are blank subtracted.
Figure 4.
(A) Upconversion emission spectra collected from the multiwell-plate after being incubated with biotin-functionalized upconversion nanoparticles produced by hybridization with different amounts of target sequences. (B) Upconversion intensity collected from the multiwell-plate as a function of target concentration from 1 × 10–18 to 1 × 10–13 moles per well (10 fM to 1 nM). The signal intensity is blank subtracted. The error bars are the standard deviation obtained from measurements at 10 different positions on each well out of three independent samples for each target concentration. The blue dashed line indicates the LOD based on 3-fold SD of the blank samples.
As one can observe, the emission intensity collected from the well-plate roughly follows a straight line in the log–log plot of Figure 4B. From these data, we obtain the relative sensitivity changes with target concentration as Sr (%/moles per well) = 30/Ctarget, which means a relative sensitivity of 0.3%/attomoles per well for a target concentration of 10–16 moles per well. The sensor shows high sensitivity and a large dynamic range, which spans over 4 orders of magnitude. Also, the blank value obtained was 950 counts/s nm with a standard deviation of 120 counts/s nm. This result defined the lowest target concentration (limit of detection, LOD) that the system can detect, which is close to 10–17 moles per well (100 fM). The LOD was calculated as 3-fold the standard deviation of the blank value.
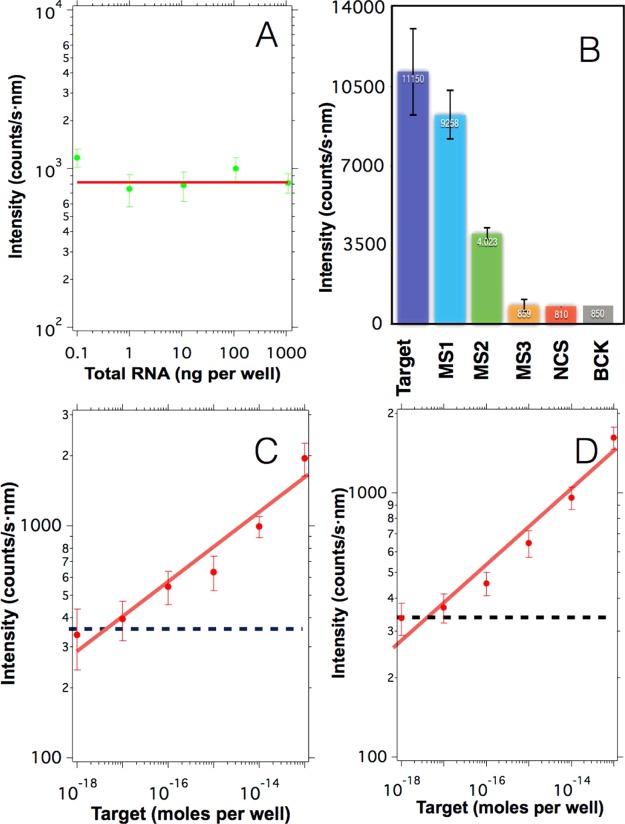
With the aim of evaluating the specificity of the sensor, we analyzed the fluorescence signal in the presence of different amounts of total RNA obtained from healthy mosquitoes but in the absence of target sequences. This experiment can give us an idea about the proportion of true negatives identified as such under different amounts of total RNA. The results are presented in Figure 5A. Here, one can observe that independent of the amount of total RNA, the signal of the sensor is constant with an average value of 830 ± 102 counts/s nm, which is close to the background obtained in the absence of total RNA (950 ± 120 counts/s nm). This result demonstrates that in the presence of noncomplementary sequences, the sensor gives a signal similar to the negative control.
Figure 5.
A) Upconversion emission obtained from blank samples prepared in the presence of different amounts of total RNA from healthy mosquitoes and in the absence of target sequences. The red line indicates the average value 830 counts/s nm. (B) Upconversion emission obtained after hybridizing 1 μg of upconversion nanoparticles with 10–12 moles per well of different sequences: full complementary sequences (Target), a sequence containing a single mismatch in the middle (MS1), a sequence containing three mismatches in the middle (MS2), a sequence containing a single mismatch in the first quarter of the strand (MS3), noncomplementary sequences (NCS), and in the absence of target sequences (BCK). The error bars indicate the standard deviation obtained from the experiments. (C) Upconversion intensity obtained after spiking samples containing 100 ng of total RNA with varying concentrations of target sequences. (D) Upconversion intensity obtained after spiking samples containing human serum with varying concentrations of target sequences. The intensities in (C) and (D) were blank subtracted and the blue dashed line indicates the threshold resulting from three times the standard deviation of the control signal. In all graphs, the error bars indicate the standard deviation.
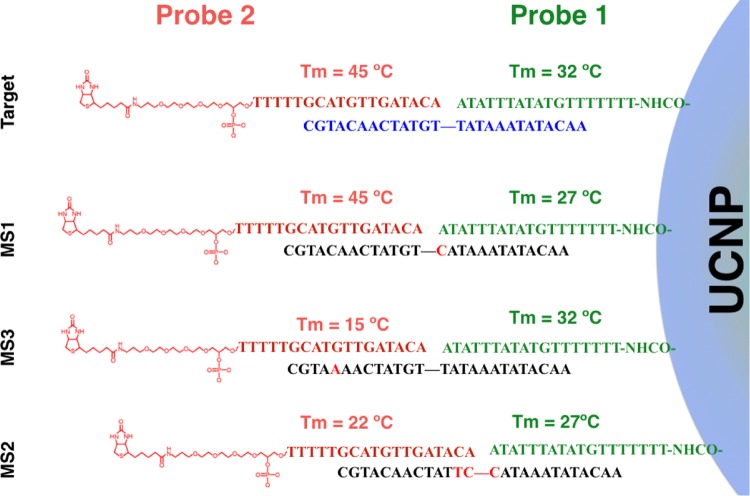
In addition, the capacity of the sensor to discriminate between target sequences and mismatched sequences was also studied. Figure 5B represents the upconversion emission obtained after hybridizing 1 μg of upconversion nanoparticles in the presence of 2 × 10–12 moles per well of biotin-functionalized probe 2 with 10–12 moles per well of different sequences: full complementary target sequences (Target), a sequence containing a single mismatch in the middle of the strand (MS1), a sequence containing three mismatches in the middle of the strand (MS2), a sequence containing a single mismatch in the first quarter of the strand (MS3), noncomplementary sequences, and in the absence of target sequences (BCK). Scheme 3 illustrates the different mismatch sequences used in this experiment.
Scheme 3. Graphical Representation of the Possible Duplexes Formed.
The mismatches bases are colored in red. Melting temperatures (Tm) of probes 1 and 2 with the target DNA and the mismatches DNA sequences were calculated using IDT SciTools.
These experiments show that when the particles were hybridized with sequences that have a single mismatch placed on the center of the strand (MS1), the sensor signal decreases slightly with respect to the signal obtained with full complementary targets (see Figure 5B). This small reduction of the signal intensity could be attributed to the small hampering that this single mismatch introduces in the 3′ end of probe 1. In contrast, when the particles were hybridized with a sequence that has three mismatches located on the center of the strands (MS2), the signal decreased conspicuously due to the hybridization hindrance that under this scenario affects the 3′ and 5′ ends of probes 1 and 2, respectively. Finally, when the sensor was tested against a sequence that has a single mismatch that affected its hybridization with the central part of probe 2 (MS3), the signal obtained by the sensor was similar to those obtained with the noncomplementary sequences and blank, indicating that this mutation could completely hamper the incorporation of the biotin moiety on the surface of the UCNP, which is the base of the sensor. These results demonstrate that the proposed sensor exhibits a selectivity that is dependent on the position of the mismatch.
Furthermore, the analytical properties of the system were studied by analyzing samples containing 100 ng of total RNA spiked with different amounts of target strands. As expected, we observed an increment of upconversion emission when the concentration of the target sequence was increased (see log–log curve of Figure 5C). In this case, the relative sensitivity is slightly lower with Sr of 20/Ctarget%/moles per well, which means a sensitivity of 0.2%/attomoles per well for a target concentration of 10–16 moles per well. The small variation in the sensitivity of the sensor could be related to the high amount of total RNA added in the sample that somehow hampers the hybridization process, reducing the number of biotin-functionalized UCNPs. Nevertheless, under this condition, the sensor can detect the presence of small oligonucleotides with a LOD close to 10–17 moles per well (100 fM).
Finally, we studied the analytical properties of our sensor in the presence of human serum. For that, different serum samples obtained from humans were spiked with varying amounts of target containing small oligonucleotides and were analyzed without sample pretreatment. The result of these experiments is shown in Figure 5D. Here, one can observe that the system was able to detect the small oligonucleotides in the serum samples, with a LOD of around 10–17 moles per well, showing the capacity of the proposed sensor to work with raw samples, facilitating the measurement and reducing the cost that would involve the use of RNA extraction kits.
All of these results reveal that the detection limit of the proposed sensor is in the range of 10 attomoles per well (100 fM), indicating the potential of the proposed sensor to detect extremely low amounts of target sequences. This LOD is significantly smaller than the one found in other sensors based on the solid phase, which are summarized in Table 2.
Table 2. Comparison of the Sensor LOD for Different Techniques.
| sensor methodologya | linear range | LOD | reference |
|---|---|---|---|
| FRET | 30 fmol to 30 pmol | 30 fmol | (34) |
| EIS | 1 pM to 500 nM | 0.5 pM | (35) |
| SERS | 10 pM to 10 nM | 10 pM | (36) |
| ELC | 50 pM to 10 nM | 10 pM | (37) |
| PLGA | 100 pM to 1 nM | 100 pM | (38) |
| SCUP | 100 fM to 10 nM | 100 fM | this work |
FRET, fluorescence resonant energy transfer; EIS, electrochemical impedance spectroscopy; SERS, surface enhancement Raman spectroscopy; ELC, electrochemical redox detection; PLGA; photoluminescence graphene assay; SCUP, selective capture of upconversion nanoparticles.
6. Conclusions
In this work, we have synthesized upconversion nanoparticles conveniently functionalized with ssDNA strands to create a sensor able to detect the presence of specific target sequences on a solid support. The LOD of the proposed sensor was around 10–17 moles per well and the relative sensitivity at this target concentration was around 0.3%/attomoles per well. The signal produced by the sensor upon hybridization with sequences that have mismatches or noncomplementary sequences was significantly smaller than the one obtained for the full complementary sequence at the same concentration. Finally, spiked-in samples were prepared by adding different amounts of a synthetic target sequence in samples containing 100 ng of total RNA extracted from healthy mosquitoes or human serum samples. The results of these experiments demonstrate the capacity of the sensor to detect the target sequence with high selectivity and sensitivity. In addition, its capacity to directly detect the target sequence in serum samples demonstrates its suitability to be used as a low cost point-of-care diagnostic, as the use of RNA extraction kits or sample pretreatment are not necessary.
Acknowledgments
The authors are grateful for the financial support from the Bill & Melinda Gates Foundation, with Grant OPP1128411, Asociación Española Contra el Cáncer, Santander-Universidad Complutense project PR26/16-12B-3, and from the Spanish MINECO for the projects MAT2014-55065-R, SAF2014-56763-R, and FIS2013-41709-P.
Supporting Information Available
The Supporting Information is available free of charge on the ACS Publications website at DOI: 10.1021/acsami.7b00575.
Materials, synthesis, characterization and detection method (PDF)
The authors declare no competing financial interest.
Supplementary Material
References
- Fire A.; Xu S.; Montgomery M. K.; Kostas S. A.; Driver S. E.; Mello C. C. Potent and Specific Genetic Interference by Double-Stranded RNA in Caenorhabditis elegans. Nature 1998, 391, 806–811. 10.1038/35888. [DOI] [PubMed] [Google Scholar]
- Hess A. M.; Prasad A. N.; Ptitsyn A.; Ebel G. D.; Olson K. E.; Barbacioru C.; Monighetti C.; Campbell C. L. Small RNA Profiling of Dengue Virus-Mosquito Interactions Implicates the PIWI RNA Pathway in Anti-Viral Defense. BMC Microbiol. 2011, 11, 45. 10.1186/1471-2180-11-45. [DOI] [PMC free article] [PubMed] [Google Scholar]
- Lopez J. P.; Diallo A.; Cruceanu C.; Fiori L. M.; Laboissiere S.; Guillet I.; Fontaine J.; Ragoussis J.; Benes V.; Turecki G.; Ernst C. Biomarker Discovery: Quantification of microRNAs and Other Small Non-Coding RNAs Using next Generation Sequencing. BMC Med. Genomics 2015, 8, 35. 10.1186/s12920-015-0109-x. [DOI] [PMC free article] [PubMed] [Google Scholar]
- Gilad S.; Meiri E.; Yogev Y.; Benjamin S.; Lebanony D.; Yerushalmi N.; Kushnir M.; Cholakh H.; Melamed N.; Bentwich Z.; Hod M.; Goren Y.; Chajut A. Serum MicroRNAs Are Promising Novel Biomarkers. PLoS One 2008, 3, e3148 10.1371/journal.pone.0003148. [DOI] [PMC free article] [PubMed] [Google Scholar]
- Calin G. A.; Croce C. M. MicroRNA Signatures in Human Cancers. Nat. Rev. Cancer 2006, 6, 857–866. 10.1038/nrc1997. [DOI] [PubMed] [Google Scholar]
- Flemming A. Targeting miRNA Pathology in Heart Disease. Nat. Rev. Drug Discovery 2014, 13, 336. 10.1038/nrd4311. [DOI] [PubMed] [Google Scholar]
- Munshi S. U.; Panda H.; Holla P.; Rewari B. B.; Jameel S. MicroRNA-150 Is a Potential Biomarker of HIV/AIDS Disease Progression and Therapy. PLoS One 2014, 9, e95920 10.1371/journal.pone.0095920. [DOI] [PMC free article] [PubMed] [Google Scholar]
- Liang H.; Zhou Z.; Zhang S.; Zen K.; Chen X.; Zhang C. Identification of Ebola Virus microRNAs and Their Putative Pathological Function. Sci. China: Life Sci. 2014, 57, 973–981. 10.1007/s11427-014-4759-2. [DOI] [PubMed] [Google Scholar]
- Hong Y.; Wang C.; Fu Z.; Liang H.; Zhang S.; Lu M.; Sun W.; Ye C.; Zhang C. Y.; Zen K.; Shi L.; Zhang C.; Chen X. Systematic Characterization of Seminal Plasma piRNAs as Molecular Biomarkers for Male Infertility. Sci. Rep. 2016, 6, 24229 10.1038/srep24229. [DOI] [PMC free article] [PubMed] [Google Scholar]
- Morazzani E. M.; Wiley M. R.; Murreddu M. G.; Adelman Z. N.; Myles K. M. Production of Virus-Derived Ping-Pong-Dependent piRNA-like Small RNAs in the Mosquito Soma. PLoS Pathog. 2012, 8, e1002470 10.1371/journal.ppat.1002470. [DOI] [PMC free article] [PubMed] [Google Scholar]
- Alonso-Cristobal P.; Vilela P.; El-Sagheer A.; Lopez-Cabarcos E.; Brown T.; Muskens O. L.; Rubio-Retama J.; Kanaras A. G. Highly Sensitive DNA Sensor Based on Upconversion Nanoparticles and Graphene Oxide. ACS Appl. Mater. Interfaces 2015, 7, 12422–12429. 10.1021/am507591u. [DOI] [PubMed] [Google Scholar]
- Laurenti M.; Paez-Perez M.; Algarra M.; Alonso-Cristobal P.; Lopez-Cabarcos E.; Mendez-Gonzalez D.; Rubio-Retama J. Enhancement of the Upconversion Emission by Visible-to-Near-Infrared Fluorescent Graphene Quantum Dots for miRNA Detection. ACS Appl. Mater. Interfaces 2016, 8, 12644–12651. 10.1021/acsami.6b02361. [DOI] [PMC free article] [PubMed] [Google Scholar]
- Yang X.; Yu Y.; Gao Z. A Highly Sensitive Plasmonic DNA Assay Based on Triangular Silver Nanoprism Etching. ACS Nano 2014, 8, 4902–4907. 10.1021/nn5008786. [DOI] [PubMed] [Google Scholar]
- Tang L.; Chun I. S.; Wang Z.; Li J.; Li X.; Lu Y. DNA Detection Using Plasmonic Enhanced near-Infrared Photoluminescence of Gallium Arsenide. Anal. Chem. 2013, 85, 9522–9527. 10.1021/ac401169c. [DOI] [PubMed] [Google Scholar]
- Tsang M.-K.; Ye W.; Wang G.; Li J.; Yang M.; Hao J. Ultrasensitive Detection of Ebola Virus Oligonucleotide Based on Upconversion Nanoprobe/Nanoporous Membrane System. ACS Nano 2016, 10, 598–605. 10.1021/acsnano.5b05622. [DOI] [PubMed] [Google Scholar]
- Chen Z.; Chen H.; Hu H.; Yu M.; Li F.; Zhang Q.; Zhou Z.; Yi T.; Huang C. Versatile Synthesis Strategy for Carboxylic Acid-Functionalized Upconverting Nanophosphors as Biological Labels. J. Am. Chem. Soc. 2008, 130, 3023–3029. 10.1021/ja076151k. [DOI] [PubMed] [Google Scholar]
- Ma W.; Kuang H.; Xu L.; Ding L.; Xu C.; Wang L.; Kotov N. A. Attomolar DNA Detection with Chiral Nanorod Assemblies. Nat. Commun. 2013, 4, 2689 10.1038/ncomms3689. [DOI] [PMC free article] [PubMed] [Google Scholar]
- Li S.; Xu L.; Ma W.; Wu X.; Sun M.; Kuang H.; Wang L.; Kotov N. A.; Xu C. Dual-Mode Ultrasensitive Quantification of MicroRNA in Living Cells by Chiroplasmonic Nanopyramids Self-Assembled from Gold and Upconversion Nanoparticles. J. Am. Chem. Soc. 2016, 138, 306–312. 10.1021/jacs.5b10309. [DOI] [PubMed] [Google Scholar]
- Wang F.; Liu X. Recent Advances in the Chemistry of Lanthanide-Doped Upconversion Nanocrystals. Chem. Soc. Rev. 2009, 38, 976–989. 10.1039/b809132n. [DOI] [PubMed] [Google Scholar]
- Liu C.; Wang H.; Li X.; Chen D. Monodisperse, Size-Tunable and Highly Efficient β-NaYF4:Yb,Er(Tm) up-Conversion Luminescent Nanospheres: Controllable Synthesis and Their Surface Modifications. J. Mater. Chem. 2009, 19, 3546–3553. 10.1039/b820254k. [DOI] [Google Scholar]
- Liu B.; Chen Y.; Li C.; He F.; Hou Z.; Huang S.; Zhu H.; Chen X.; Lin J. Poly(Acrylic Acid) Modification of Nd3+ -Sensitized Upconversion Nanophosphors for Highly Efficient UCL Imaging and pH-Responsive Drug Delivery. Adv. Funct. Mater. 2015, 25, 4717–4729. 10.1002/adfm.201501582. [DOI] [Google Scholar]
- Zhang C.; Yuan Y.; Zhang S.; Wang Y.; Liu Z. Biosensing Platform Based on Fluorescence Resonance Energy Transfer from Upconverting Nanocrystals to Graphene Oxide. Angew. Chem., Int. Ed. Engl. 2011, 50, 6851–6854. 10.1002/anie.201100769. [DOI] [PubMed] [Google Scholar]
- Wu S.; Duan N.; Ma X.; Xia Y.; Wang H.; Wang Z.; Zhang Q. Multiplexed Fluorescence Resonance Energy Transfer Aptasensor between Upconversion Nanoparticles and Graphene Oxide for the Simultaneous Determination of Mycotoxins. Anal. Chem. 2012, 84, 6263–6270. 10.1021/ac301534w. [DOI] [PubMed] [Google Scholar]
- Sedlmeier A.; Gorris H. H. Surface Modification and Characterization of Photon-Upconverting Nanoparticles for Bioanalytical Applications. Chem. Soc. Rev. 2015, 44, 1526–1560. 10.1039/C4CS00186A. [DOI] [PubMed] [Google Scholar]
- Doughan S.; Han Y.; Uddayasankar U.; Krull U. J. Solid-Phase Covalent Immobilization of Upconverting Nanoparticles for Biosensing by Luminescence Resonance Energy Transfer. ACS Appl. Mater. Interfaces 2014, 6, 14061–14068. 10.1021/am503391m. [DOI] [PubMed] [Google Scholar]
- Sedlmeier A.; Hlavek A.; Birner L.; Mickert M. J.; Muhr V.; Hirsch T.; Corstjens P. L. A. M.; Tanke H. J.; Soukka T.; Gorris H. H. Highly Sensitive Laser Scanning of Photon-Upconverting Nanoparticles on a Macroscopic Scale. Anal. Chem. 2016, 88, 1835–1841. 10.1021/acs.analchem.5b04147. [DOI] [PubMed] [Google Scholar]
- Kale V.; Päkkilä H.; Vainio J.; Ahomaa A.; Sirkka N.; Lyytikäinen A.; Talha S. M.; Kutsaya A.; Waris M.; Julkunen I.; Soukka T. Spectrally and Spatially Multiplexed Serological Array-in-Well Assay Utilizing Two-Color Upconversion Luminescence Imaging. Anal. Chem. 2016, 88, 4470–4477. 10.1021/acs.analchem.6b00337. [DOI] [PubMed] [Google Scholar]
- Ylihärsilä M.; Valta T.; Karp M.; Hattara L.; Harju E.; Hölsä J.; Saviranta P.; Waris M.; Soukka T. Oligonucleotide Array-in-Well Platform for Detection and Genotyping Human Adenoviruses by Utilizing Upconverting Phosphor Label Technology. Anal. Chem. 2011, 83, 1456–1461. 10.1021/ac103155f. [DOI] [PubMed] [Google Scholar]
- van de Rijke F.; Zijlmans H.; Li S.; Vail T.; Raap A. K.; Niedbala R. S.; Tanke H. J. Up-converting Phosphor Reporters for Nucleic Acid Microarrays. Nat. Biotechnol. 2001, 19, 273–276. 10.1038/85734. [DOI] [PubMed] [Google Scholar]
- Hlaváček A.; Farka Z.; Hübner M.; Horňáková V.; Němeček D.; Niessner R.; Skládal P.; Knopp D.; Gorris H. H. Competitive Upconversion-Linked Immunosorbent Assay for the Sensitive Detection of Diclofenac. Anal. Chem. 2016, 88, 6011–6017. 10.1021/acs.analchem.6b01083. [DOI] [PubMed] [Google Scholar]
- El-Sagheer A. H.; Brown T. Click Chemistry with DNA. Chem. Soc. Rev. 2010, 39, 1388–1405. 10.1039/b901971p. [DOI] [PubMed] [Google Scholar]
- Hulme E. C.; Trevethick M. A. Ligand Binding Assays at Equilibrium: Validation and Interpretation. Br. J. Pharmacol. 2010, 161, 1219–1237. 10.1111/j.1476-5381.2009.00604.x. [DOI] [PMC free article] [PubMed] [Google Scholar]
- Broder G. R.; Ranasinghe R. T.; Neylon C.; Morgan H.; Roach P. L. Kinetics and Thermodynamics of Biotinylated Oligonucleotide Probe Binding to Particle-Immobilized Avidin and Implications for Multiplexing Applications. Anal. Chem. 2011, 83, 2005–2011. 10.1021/ac102762q. [DOI] [PubMed] [Google Scholar]
- Noor M. O.; Krull U. J. Camera-Based Ratiometric Fluorescence Transduction of Nucleic Acid Hybridization with Reagentless Signal Amplification on a Paper-Based Platform Using Immobilized Quantum Dots as Donors. Anal. Chem. 2014, 86, 10331–10339. 10.1021/ac502677n. [DOI] [PubMed] [Google Scholar]
- Yang Y.; Li C.; Yin L.; Liu M.; Wang Z.; Shu Y.; Li G. Enhanced Charge Transfer by Gold Nanoparticle at DNA Modi Fi Ed Electrode and Its Application to Label-Free DNA Detection. ACS Appl. Mater. Interfaces 2014, 6, 7579–7584. 10.1021/am500912m. [DOI] [PubMed] [Google Scholar]
- Kang T.; Yoo S. M.; Yoon I.; Lee S. Y.; Kim B. Patterned Multiplex Pathogen DNA Detection by Au Particle-on-Wire SERS Sensor. Nano Lett. 2010, 10, 1189–1193. 10.1021/nl1000086. [DOI] [PubMed] [Google Scholar]
- López M. S.; Cabanillas G. F.; Castañón M. J. L.; López-Ruiz B. Development of a Genosensor for Peanut Allergen ARA H 2 Detection and Its Optimization by Surface Response Methodology. Biosens. Bioelectron. 2014, 62, 350–356. 10.1016/j.bios.2014.06.065. [DOI] [PubMed] [Google Scholar]
- Du Y.; Guo S.; Dong S.; Wang E. An Integrated Sensing System for Detection of DNA Using New Parallel-Motif DNA Triplex System and Graphene-Mesoporous Silica-Gold Nanoparticle Hybrids. Biomaterials 2011, 32, 8584–8592. 10.1016/j.biomaterials.2011.07.091. [DOI] [PubMed] [Google Scholar]
Associated Data
This section collects any data citations, data availability statements, or supplementary materials included in this article.


