

Abstract
A long-standing challenge in optical neuroimaging has been the assessment of hemodynamics and oxygen metabolism in the awake rodent brain at the microscopic level. Here, we report first-of-a-kind head-restrained photoacoustic microscopy (PAM), which enables simultaneous imaging of the cerebrovascular anatomy, total concentration and oxygen saturation of hemoglobin, and blood flow in awake mice. Combining these hemodynamic measurements allows us to derive two key metabolic parameters—oxygen extraction fraction (OEF) and the cerebral metabolic rate of oxygen (CMRO2). This enabling technology offers the first opportunity to comprehensively and quantitatively characterize the hemodynamic and oxygen-metabolic responses of the mouse brain to isoflurane, a general anesthetic widely used in preclinical research and clinical practice. Side-by-side comparison of the awake and anesthetized brains reveals that isoflurane induces diameter-dependent arterial dilation, elevated blood flow, and reduced OEF in a dose-dependent manner. As a result of the combined effects, CMRO2 is significantly reduced in the anesthetized brain under both normoxia and hypoxia, which suggests a mechanism for anesthetic neuroprotection. The head-restrained functional and metabolic PAM opens a new avenue for basic and translational research on neurovascular coupling without the strong influence of anesthesia and on the neuroprotective effects of various interventions, including but not limited to volatile anesthetics, against cerebral hypoxia and ischemia.
Keywords: anesthetic neuroprotection, awake-brain imaging, head-restrained photoacoustic microscopy, hemodynamics, oxygen metabolism
Introduction
Optical microscopy—providing detailed spatiotemporal views of neuronal networks (Stosiek et al., 2003), neuronal subtypes (Kleinfeld and Griesbeck, 2005), subcellular compartments of neurons (Chen et al., 2012), and hemodynamics (Yao et al., 2015) in the rodent brain in vivo—has been revolutionizing neuroscience in recent decades. To minimize motion artifacts during the course of high-resolution imaging, the majority of these studies have been carried out in anesthetized animals. However, anesthesia is known to have profound effects on neuronal activities and cerebral hemodynamics. A recent study shows direct evidence that the brain activity during wakefulness cannot be reliably inferred from the observations under anesthesia (Greenberg et al., 2008). Moreover, anesthetic-induced changes in cerebral hemodynamics have been observed across multiple species (human, primate, and rodent) (Kaisti et al., 2003; Martin et al., 2006; Qiu et al., 2008; Shtoyerman et al., 2000). Thus, there is a pressing need for novel microscopy technologies capable of imaging neuronal activities and hemodynamics in the awake rodent brain.
To meet this demand, head-mounted (Flusberg et al., 2008; F Helmchen et al., 2001; Sawinski et al., 2009) and head-restrained (Dombeck et al., 2010; Harvey et al., 2009; Scott et al., 2013) paradigms have been recently developed for fluorescence microscopy of the awake brain. The head-mounted approach allows imaging the neuronal activity in freely moving rodents but has limited field of view, insufficient mechanical stability, and suboptimal optical performance (Hamel et al., 2015). In contrast, head restraint provides extended imaging field, improved mechanical and optical performance, and the accessibility of electrode recording (Dombeck et al., 2007). The restraint-induced animal stress, as a primary concern, can be mitigated by the use of a treadmill and proper training (Dombeck et al., 2010; Harvey et al., 2009). With the aid of molecular probes, these new paradigms have enabled large-scale and time-lapse recording of the neuronal activity at the cellular level in awake mice, holding great potential to transform our understanding of neural circuits underlying behavior (Scott et al., 2013).
While molecular imaging of the neuronal activity in the awake brain rapidly advances, functional imaging of the coevolving hemodynamics falls far behind. With the aid of angiographic agents, fluorescence microscopy permits the quantification of cerebral blood flow (CBF) in awake mice (F Helmchen et al., 2001). However, it remains a challenge for fluorescence microscopy to directly measure multiple hemoglobin-related hemodynamic parameters, including the total concentration and oxygen saturation of hemoglobin (CHb and sO2, respectively) and oxygen extraction fraction (OEF). Recent advances in oxygen-sensitive fluorescent probes (Sakadzić et al., 2010) and visible light optical coherence tomography (Chong et al., 2015; Yi et al., 2014) provide new means to assess blood oxygenation, which in combination with CBF allows the quantification of oxygen metabolism. Capable of comprehensively and simultaneously measure all these hemodynamic parameters in a label-free manner (Hu, 2016; Wang and Hu, 2012), photoacoustic imaging is ideally suited for functional imaging of the awake brain. However, this research is still in a nascent stage, with only a couple of studies using macroscopic-resolution photoacoustic tomography (Jo et al., 2012; Tang et al., 2016).
Here, we report on a novel application of photoacoustic microscopy (PAM) for comprehensive and quantitative characterization of cerebral hemodynamics and metabolism at the microscopic level in awake mice. An angle- and height-adjustable head-restraint apparatus was exploited to enable high-resolution PAM of the awake brain with minimal motion artifacts, and an air-floated spherical treadmill was utilized to mitigate the restraint-induced stress. We first assessed the long-term stability of head-restrained PAM measurements in the awake mouse brain. Upon validation, we compared the cerebrovascular diameter, CHb, sO2, CBF, OEF, and the cerebral metabolic rate of oxygen (CMRO2) in the same region of interest under wakefulness and different levels (i.e., light, medium, and deep) of anesthesia, which revealed dose-dependent cerebral hemodynamic and metabolic responses to isoflurane—a commonly used volatile general anesthetic. We further studied the multifaceted cerebral responses under systemic hypoxia, whose results suggested a possible mechanism for the widely reported but poorly understood neuroprotective effect of volatile anesthetics (Zuo, 2012; Zwerus and Absalom, 2015).
Methods
Head-restrained PAM system
As shown in Fig. 1, the head-restrained PAM uses two nanosecond-pulsed lasers (BX40-2-G and BX40-2-GR, Edgewave) operating at the same pulse repetition rate of ~10 kHz. The two beams with orthogonal polarizations are combined by a polarizing beam splitter (48–545, Edmund Optics) and then coupled into a single-mode optical fiber (P1-460B-FC-2, Thorlabs) through a microscope objective (M-10X, Newport). Before entering the fiber, the dual-wavelength (i.e., 532 nm and 559 nm) beam is attenuated by a neutral density filter (NDC-50 C-2M, Thorlabs), reshaped by an iris (SM1D12D, Thorlabs), focused by a condenser lens (LA1608, Thorlabs), and filtered by a 50-μm-diameter pinhole (P50C, Thorlabs). To compensate for the fluctuation in the laser intensity, ~5% of the laser pulse energy is picked off by a beam sampler (BSF10-A, Thorlabs) and monitored by a high-speed photodiode (FDS100, Thorlabs). The beam coming out of the fiber is launched into the imaging head of the system, where it is collimated by an achromatic doublet (AC127-025-A, Thorlabs), reshaped by an iris (SM05D5, Thorlabs), and focused by an identical doublet through a correction lens (LA1207-A, Thorlabs) and the central opening of a customized ring-shaped ultrasonic transducer (inner diameter: 2.2 mm; outer diameter: 4.0 mm; focal length: 6.0 mm; center frequency: 35 MHz; 6-dB bandwidth: 70%) into the mouse brain. The optical and acoustic foci are confocally aligned for maximum sensitivity. Restraint of the awake mouse head is achieved using a nut-bolt configuration. As shown in the red-boxed inset of Fig. 1, a small nut (90730A005, McMaster-Carr) is attached to the exposed mouse skull using dental cement (S380, Parkell). Once being fixed in a customized head plate with a bolt, the mouse head can be angularly adjusted using a rotation mount (RSP-1T, Newport) to align the region of interest perpendicular to the imaging head and vertically adjusted using a right-angle clamp (RA90, Thorlabs) to allow the mouse limbs to comfortably rest on the surface of the spherical treadmill (blue-boxed inset of Fig. 1). The treadmill, consisting of two 8-inch-diameter hollow polystyrene hemispheres (03170-1008, Blick Art Materials), sits in a homemade cylindrical holder. The slightly compressed air (15 psi) from the bottom of the holder creates a thin cushion to float the treadmill, allowing the mouse to move freely with reduced reaction force.
Figure 1.

Schematic of the head-restrained PAM. PBS, polarizing beam splitter; NDF, neutral density filter; BS, beam sampler; SMF, single-mode fiber; AD, achromatic doublet; CL, correction lens; RT, ring-shaped ultrasonic transducer; RM, rotation mount; HP, head plate; RAC, right-angle clamp. Red-boxed inset: photograph of a mouse brain with a thinned-skull window and a nut attached using dental cement. Blue-boxed inset: photograph of the angle- and height-adjustable head-restraint apparatus. Green-boxed inset: the mouse placement during imaging.
To scan the optical-acoustic dual foci over the cortical region of interest, the exit end of the optical fiber and the imaging head are mounted on a 3-axis motorized scanning system, which consists of two transverse linear stages (PLS-85, PI miCos GmbH) for raster scan and a vertical linear stage (KR15, THK; motor: 28BYG201, Circuit Specialists) for automatic and precise adjustment of the dual foci. The cross-sectional scan (i.e., B-scan) speed is set to 1 mm/s, during which the two lasers are alternately triggered at a 50-μs interval to produce dual-wavelength A-line pairs with a spatial interval of 0.1 μm. Statistical, spectral, and correlation analysis of 100 successive A-line pairs (Ning et al., 2015) allows simultaneous quantification of CHb, sO2, and CBF at the same spatial scale (10 μm).
Hemodynamic and oxygen-metabolic analysis
Statistical analysis of the 100 successive A-lines acquired at 532 nm allows quantification of the average number of red blood cells (RBCs) within the detection volume as
| (1) |
in which E() and Var() respectively denotes the mean and variance operation, APAM represents the amplitude of the PAM signal, and NPAM is the electronic thermal noise of the PAM system. Given the experimentally quantified 263-μm3 detection volume of our PAM and the 15-pg average hemoglobin weight in each RBC (Everds, 2004), CHb can be calculated as (Ning et al., 2015):
| (2) |
Spectral analysis of the dual-wavelength A-line pair allows differentiation of the oxy-hemoglobin (HbO2) and deoxy-hemoglobin (HbR), from which sO2 can be computed (Zhang et al., 2007). With the aid of vessel segmentation (Soetikno et al., 2012), the average sO2 values of the feeding arteries (saO2) and draining veins (svO2) within the region of interest can be extracted to quantify OEF as
| (3) |
Correlation analysis of the same 100 A-lines allows CBF to be simultaneously quantified. Theoretically, the time course of the correlation coefficient follows a second-order exponential decay , in which the decay constant λf is linearly proportional to the blood flow speed (Chen et al., 2011). Fitting the experimentally measured decorrelation curve with the theoretical model leads to pixel-wise flow mapping (Ning et al., 2015). Moreover, with the aid of vessel segmentation, the flow speed and diameter of individual cortical vessels can be combined to derive CBF in the volumetric unit as (Shih et al., 2009)
| (4) |
where D is the vessel diameter and V is the blood flow speed along the central axis of the vessel.
With the simultaneously quantified CHb, OEF, and CBF, the total CMRO2 of the region of interest can be derived as
| (5) |
where ξ is the oxygen binding capacity of hemoglobin (1.36 mL oxygen per gram hemoglobin), CBFtotal is the total volumetric blood flow through the region, and W is the tissue weight estimated by assuming an average cortical thickness of 1.2 mm (DeFelipe, 2011) and a tissue density of 1.05 g/ml (Chong et al., 2015). Note that the total volumetric flow rates in the feeding arteries and draining veins need to be approximately equal to avoid possible bias in the CMRO2 calculation due to the unbalanced flow (Hu and Wang, 2010; Yao et al., 2015). Meeting this important condition in the cerebral cortex typically requires a relatively large field of view. For statistical analysis involving multiple animals, we can eliminate potential variations in the baseline CMRO2 across samples by deriving relative CMRO2 as
| (6) |
where rCHb, rsaO2, rOEF, and rCBFtotal are the relative values of these parameters calculated by normalizing to their corresponding baselines.
Animal preparation
Male CD-1 mice (9–13 weeks old, Charles River Laboratories) were used for the studies. Under anesthesia, the hair in the mouse head was removed and a surgical incision was made in the scalp to expose the skull. The dental cement was then applied to cover the surface of the exposed skull, except for the region of interest, and the nut was attached. After the cement was solidified and the nut was firmly adhered to the skull, the mouse was transferred to the head-restraint apparatus. To help acclimate the mouse to head restraint and attenuate the stress, each mouse was subjected to 5 training sessions on 5 consecutive days. Each session lasted for 45 minutes, during which the mouse was provided with drink as a positive reward.
One day before the PAM experiment, the skull over the region of interest was thinned by a surgical hand drill following the fascia removal for optimal image quality. The skull thinning was implemented following the well-established protocol (Drew et al., 2010; Yang et al., 2010) to alleviate potential inflammation and avoid possible damage to the brain. Once the desired skull thickness (~100 μm) was reached, the thinned-skull window was cleaned and dried. According to previous studies (Yang et al., 2010), no obvious inflammation or detectable microglia activation is expected if the thickness of the thinned skull is larger than 20 μm. One hour prior to the PAM experiment, the trained mouse was restrained and placed beneath the water tank for acoustic coupling (green-boxed inset of Fig. 1). Ultrasound gel was applied between the skull window and the ultrasonically and optically transparent polyethylene membrane at the bottom of the water tank. The temperature of the water tank was set at 37°C, and a heating lamp was used to help maintain the mouse body temperature. All experimental procedures were carried out in conformity with the animal protocol approved by the Animal Care and Use Committee at the University of Virginia.
Hypoxia and anesthesia
The physiological state of the experimental mouse was switched between systemic normoxia and hypoxia by adjusting the oxygen concentration of the inhalation gas. For normoxia, the mouse was supplied with medical-quality air (AI M-T, Praxair). For hypoxia, the air was mixed with medical-quality nitrogen (NI H, Praxair). By adjustment of the flow rates of the two gas components, the oxygen concentration of the mixture was set to 12%, which was confirmed by a clinical anesthesia monitor (Capnomac Ultima, Datex-Ohmeda). The anesthetic state of the mouse was altered by adjusting the inhaled isoflurane concentration. Specifically, the minimum alveolar concentration (MAC) of isoflurane for the CD-1 mouse used herein was pre-determined to be 1.6%, based on which 0% (i.e., 0 MAC), 0.8% (i.e., 0.5 MAC), 1.6% (i.e., 1.0 MAC), and 2.4% (i.e., 1.5 MAC) isoflurane were used during wakefulness and to induce light, medium, and deep anesthesia, respectively. After each switch of the physiological or anesthetic state, at least 15 minutes was waited to ensure equilibrium and to allow the animal to adapt to hypoxia.
Blood-gas analysis
The mouse neck was shaved and disinfected with povidone iodine, before a 2-cm midline incision was made. The soft tissue over the trachea was gently retracted to expose the left common carotid artery. Major blood-gas parameters of the blood samples collected from the artery—including pH, partial pressure of oxygen in arterial blood (PaO2), and partial pressure of carbon dioxide in arterial blood (PaCO2)—were quantified using a blood-gas analyzer (IRMA, Diametrics Medical). Note that we performed the blood-gas analysis only in anesthetized mice (0.5 MAC or 1.5 MAC) under hypoxia (12% oxygen). Prior to the blood collection, the mouse was maintained under the desired physiological and anesthetic state for at least 15 minutes to allow for equilibrium. The animal was euthanized immediately after the experiment.
Statistics
One-way analysis of variance (ANOVA) and Tukey’s honest significance test with correction for multiple comparison was used in Fig. 5a, Fig. 8a, and supplementary Fig. S1, supplementary Fig. S3 and supplementary Fig. S4. Paired t-test was used in Fig. 3, Fig. 5b, Fig. 8b, and supplementary Fig. S6. Two-sample t-test was used in supplementary Fig. S5. In Fig. 6 and Fig. 9, paired t-test was used for comparing the diameters of the same group of vessels under anesthesia and wakefulness (i.e., baseline) and two-sample t-test was used for the comparison between different groups of vessels under the same anesthetic state. The Pearson correlation coefficient was used in supplementary Fig. S2 to examine the linear relationship between the relative dilation of small arteries (diameter: <40 μm) and the corresponding baseline diameters measured during wakefulness. All statistical data are presented in the format of mean ± standard deviation.
Figure 5.

Dose-dependent effects of isoflurane on cerebral hemodynamics and oxygen metabolism. (a) Statistical comparison (N = 6) of the absolute arterial CHb, sO2, blood flow speed, and diameter, as well as svO2, under wakefulness (0 MAC) and different concentrations (0.5, 1.0, and 1.5 MAC) of isoflurane. (b) Statistical comparison of the relative CHb, saO2, OEF, CBF, and CMRO2 with their corresponding baselines (significance levels, if any, are marked on the top of the columns) and between different concentrations of isoflurane (significance levels, if any, are marked between the two compared columns). *, p<0.05; **, p<0.01; ***, p<0.001; ****, p<0.0001. Data are presented as mean ± SD.
Figure 8.

Influence of isoflurane on cerebral hemodynamic and oxygen-metabolic responses to systemic hypoxia. (a) Statistical comparison (N = 5) of the absolute arterial CHb, sO2, blood flow speed, and diameter, as well as svO2, under wakefulness (0 MAC) and different concentrations (0.5, 1.0, and 1.5 MAC) of isoflurane. (b) Statistical comparison of the relative CHb, saO2, OEF, CBF, and CMRO2 with their corresponding baselines (significance levels, if any, are marked on the top of the columns) and between different concentrations of isoflurane (significance levels, if any, are marked between the two compared columns). *, p<0.05; **, p<0.01; ***, p<0.001. Data are presented as mean ± SD.
Figure 3.
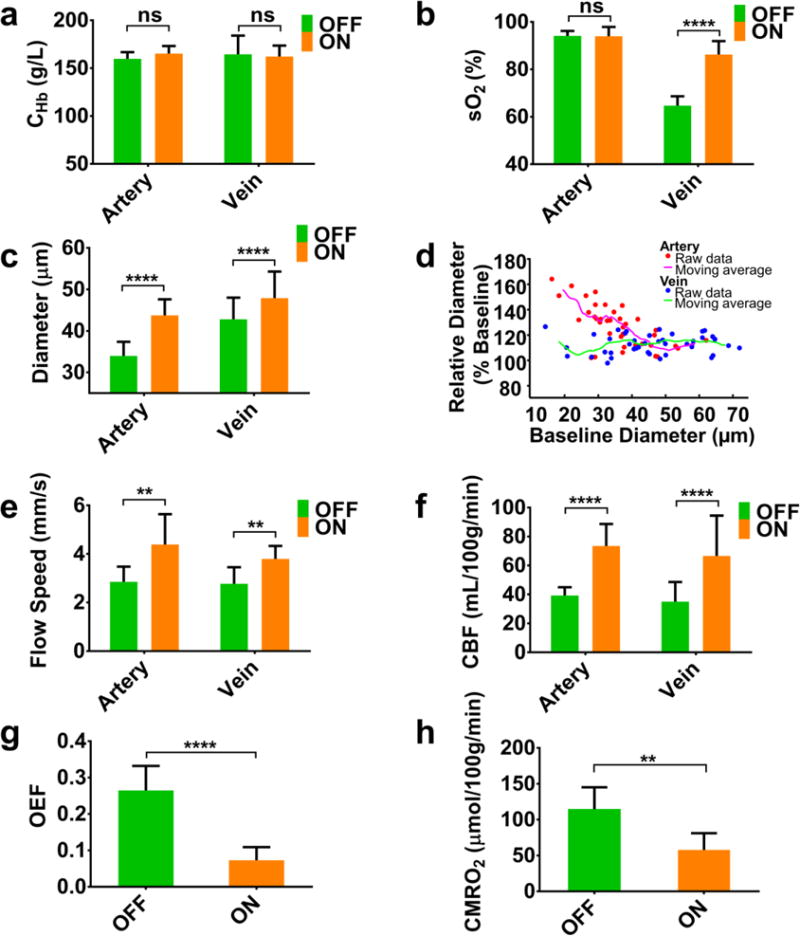
Statistical comparison (N = 5) of CHb, sO2, vessel diameter, blood flow speed, CBF, OEF, and CMRO2 in the awake and anesthetized mouse brains. In the paired t-test, ns, **, and **** respectively represent no significance, p<0.01, and p<0.0001. The right panel in the second row shows a strong dependence of isoflurane-induced arterial dilation on the baseline diameter measured under wakefulness. Data are presented as mean ± SD.
Figure 6.

Cerebral vasodilation in response to different concentrations of isoflurane (0.5, 1.0, and 1.5 MAC) under normoxia. The segmented feeding arteries and draining veins were divided into four different groups: small arteries (SA) and small veins (SV) with diameters less than 40 μm and large arteries (LA) and large veins (LV) with diameters larger than 40 μm. Statistical comparison (39 feeding arteries and 42 draining veins in 6 mice) of the vessel diameters measured under anesthesia with their corresponding baseline values measured under wakefulness shows significant vasodilation for all four groups across all three different anesthetic depths (significance levels are marked on the top of the columns). Moreover, statistical comparison between different groups of vessels under the same concentration of isoflurane shows a strong diameter-dependent vasodilation in the arteries but not veins (significance levels, if any, are marked between the two compared columns). Vasodilation shows no statistically significant dependence on isoflurane concentration. *, p<0.05; **, p<0.01; ****, p<0.0001. Data are presented as mean ± SD.
Figure 9.

(a) Cerebral vasodilation in response to different concentrations of isoflurane (0.5, 1.0, and 1.5 MAC) under systemic hypoxia. Statistical comparison (41 feeding arteries and 26 draining veins in 5 mice) of the vessel diameters measured under anesthesia with their corresponding baseline values measured under wakefulness shows significant arterial dilation but only moderate venous dilation across all three different anesthetic depths (significance levels, if any, are marked on the top of the columns). Moreover, statistical comparison between different groups of vessels under the same concentration of isoflurane shows no diameter-dependent dilation in either arteries or veins. Vasodilation shows no statistically significant dependence on isoflurane concentration under hypoxia. (b) Statistical comparison of the vessel diameters measured in the awake mouse brain under hypoxia with their baselines measured under normoxia shows statistically significant vasodilation in small arteries and veins (significance levels, if any, are marked on the top of the columns). Moreover, statistical comparison reveals a strong diameter-dependent dilation in the arteries but not veins (significance levels, if any, are marked between the two compared columns). *, p<0.05; ***, p<0.001; ****, p<0.0001. Data are presented as mean ± SD.
Results
Long-term stability of head-restrained PAM
Prior to characterizing the cerebral hemodynamic and oxygen-metabolic responses to isoflurane, we assessed the stability of head-restrained PAM for time-lapse measurements in the awake mouse brain to ensure that PAM-revealed changes were indeed due to physiological rather than technical variations. Specifically, we repeatedly imaged the same cortical region of interest 5 times over a 75-minute period, during which the physiological state of the mouse was carefully maintained. A total of 48 feeding arteries and draining veins that PAM imaged in 3 mice were segmented, and the relative changes in CHb, sO2, vessel diameter, and blood flow speed from their corresponding baseline values measured at the very beginning were quantified. As shown in Fig. S1, the statistical analysis showed no significant changes in any of the four parameters over time, indicating the stability of our system.
Cerebral hemodynamic and oxygen-metabolic responses to isoflurane
Upon validating the stability of head-restrained PAM for longitudinal and quantitative monitoring, we comprehensively characterized the cerebral hemodynamic and oxygen-metabolic responses to isoflurane under normoxia. For side-by-side comparison of the mouse brain in the absence and presence of isoflurane, we performed a 2-hour PAM monitoring, during which the isoflurane vaporizer (set at 1.0 MAC) was switched off and on. After each switch, at least 15 minutes was waited to ensure the equilibrium.
Under anesthesia, the mouse brain presented no evident changes in CHb but apparent upregulations in svO2 and flow speed (indicated by the arrows in the 2nd and 3rd rows of Fig. 2a). Furthermore, vessel segmentation-enabled analysis of the feeding arteries and draining veins (colored in red and blue, respectively, in Fig. 2b) provided quantitative and more comprehensive insights into the cerebral responses to isoflurane (Fig. 2c). As expected, the CHb in both the arteries and veins remained roughly constant during the alternations between wakefulness and anesthesia. Similarly, the saO2 maintained at a stable level, which was in striking contrast to the markedly increased svO2 in the presence of isoflurane. The high saO2 indicated sufficient oxygen supply to the mouse brain, while the elevated svO2 suggested reduced oxygen extraction of the cerebral tissue under anesthesia. In contrast to the decreased OEF, both the feeding and draining vessels underwent significant vasodilation and upregulation in the blood flow speed, which together should lead to a boost in CBF according to Equation 4. Indeed, the total volumetric flow rates (CBFtotal) of both the arterial blood into the region of interest and the venous blood out of it nearly doubled under anesthesia. Notably, the two rates were roughly identical throughout the monitoring period. Thus, the total CMRO2 of the region can be derived by Equation 5 without considerable bias induced by the unbalanced flow. Apparently, the reduced OEF and increased CBF exerted opposite effects on the cerebral oxygen metabolism. The combined effects resulted in a significant suppression of CMRO2 in the anesthetized mouse brain.
Figure 2.

Hemodynamic and oxygen-metabolic responses of the normoxic mouse brain to 1.0-MAC isoflurane. (a) Head-restrained PAM of cerebral CHb, sO2, and blood flow speed in the absence (OFF) and presence (ON) of isoflurane. The white arrows in the 2nd and 3rd rows highlight the isoflurane-induced changes in svO2 and blood flow speed. (b) 9 feeding arteries and 6 draining veins in the 2.5×2.5 mm2 region of interest identified and isolated by vessel segmentation. (c) Quantitative analysis of the isoflurane-induced changes in the average CHb, sO2, diameter, and flow speed of the feeding and draining vessels, from which OEF, CBF, and CMRO2 of the region of interest under wakefulness and anesthesia were derived. Scale bar, 500 μm.
Repeating this experiment in 5 mice enabled us to characterize the cerebral hemodynamic and oxygen-metabolic responses to isoflurane at the statistical level. As shown in Fig. 3a, no statistical difference was found between the CHb under wakefulness (160±7 g/L for arteries and 165±19 g/L for veins) and that under anesthesia (165±8 g/L for arteries and 162±11 g/L for veins). In contrast to the unchanged saO2 (94±2% and 94±4% under wakefulness and anesthesia, respectively), svO2 was increased from 65±4% to 86±6% following the exposure to isoflurane (Fig. 3b). In addition, marked arterial dilation (from 34±4 μm to 44±4 μm) and moderate venous dilation (from 43±5 μm to 48±6 μm) were observed (Fig. 3c). Further analysis of individual vessel segments revealed a striking negative correlation (r = −0.66) between the relative dilation of small arteries (diameter less than 40 μm) and the baseline (i.e., under wakefulness) diameter (Fig. 3d and supplementary Fig. S2). In contrast, arteries with larger diameters (>40 μm) and veins showed less pronounced and diameter-independent dilation (13±8% and 12±6%, respectively). Accompanying vasodilation was significant increase in the flow speed (on average, 54% in arteries and 37% in veins as shown in Fig. 3e), which together boosted the arterial CBFtotal from 39.2±5.7 mL/100g/min to 73.5±15.2 mL/100g/min and the venous CBFtotal from 35.0±13.5 mL/100g/min to 66.6±27.9 mL/100g//min (Fig. 3f). It is worth noting that the PAM-measured CBF is comparable to that measured by optical coherence tomography (Chong et al., 2015) and autoradiography (Nakao et al., 2001). Combining the multiple hemodynamic parameters, we revealed that the 1.0-MAC isoflurane induced a 73% decrease in OEF (from 0.26±0.07 to 0.07±0.04 as shown in Fig. 3g) and a 50% decline in CMRO2 (from 114.5±30.6 μmol/100g/min to 57.8±23.3 μmol/100g/min as shown in Fig. 3h).
Dose-dependent effects of isoflurane on cerebral hemodynamics and metabolism
Next, we examined whether the observed multifaceted cerebral responses to isoflurane were dose-dependent or not under normoxia. Specifically, 6 head-restrained mice were monitored by PAM for ~2 hours, during which their states were gradually altered from wakefulness to light then medium and finally deep anesthesia by a stepwise increase of the isoflurane concentration (0, 0.5, 1.0, and 1.5 MAC). After each switch, a minimum of 15 minutes was waited to allow for equilibrium.
Consistent with the observation in Fig. 2a, the mouse brain showed unchanged CHb and saO2 but apparently increased svO2 and flow speed under all three different levels of anesthesia compared with that under wakefulness (indicated by the arrows in Fig. 4). With the aid of vessel segmentation, the CHb, sO2, blood flow speed, and diameter of individual feeding arteries and draining veins were quantified and averaged for each mouse. Then, the average hemodynamic readouts under the four states were statistically compared (Fig. 5a and supplementary Fig. S3). As expected, CHb and saO2 were well maintained throughout the incremental exposure to isoflurane. In contrast, marked svO2 increase, flow speed upregulation, and vasodilation were observed under all three levels of anesthesia. Different from the dose-independent vasodilation, svO2 and blood flow speed partially regressed when switching from medium to deep anesthesia, likely due to the anesthetic depression of myocardial contractility (Rusy and Komai, 1987). The synchronous responses in svO2 and flow speed implied an inverse coupling between OEF and CBF. Indeed, when the state was switched from medium to deep anesthesia rOEF, (normalized to the baseline measured during wakefulness) dramatically increased from 21±8% to 37±9% along with a significant drop in rCBFtotal from 215±39% to 180±42% (Fig. 5b). Given the unchanged CHb and saO2, the tight CBF-OEF coupling managed to maintain CMRO2 at a statistically constant level—only about half of that under wakefulness—across different depths of anesthesia. It is worth noting that we did not observe the isoflurane dose-dependent CMRO2 decrease reported in a previous study (Stullken et al., 1977). The discrepancy might be attributed to the differences in animal species (dog vs. mouse) and experimental conditions. Unlike the previous study, which used active ventilation (PaCO2 was maintained roughly constant) with hyperoxic inhalation gas (40% oxygen), we used medical-quality air without ventilation. Thus, deep anesthesia-induced decrease in the respiratory rate may lead to hypercapnia. While the cerebral metabolic response to hypercapnia is still in controversy (Yablonskiy, 2011), previous studies have shown that hypercapnia can induce CMRO2 increase in rodents (Horvath et al., 1994). The metabolic effect of hypercapnia may counterbalance the dose-dependent effect of isoflurane on CMRO2
Figure 4.

Head-restrained PAM of CHb, sO2, and blood flow speed in the normoxic mouse brain in the absence (0 MAC) and presence of different concentrations (0.5, 1.0, and 1.5 MAC) of isoflurane. The white arrows in the 2nd and 3rd rows highlight the isoflurane-induced changes in svO2 and blood flow speed. Scale bar, 500 μm.
Considering the diameter-dependent dilation of small arteries (<40 μm in diameter) revealed in Fig. 3, we further analyzed whether the dilation of this subset of vessels had any dependence on isoflurane concentration. To this end, we divided the segmented vessels into four groups, including small arteries (<40 μm in diameter), small veins (<40 μm in diameter), large arteries (>40 μm in diameter), and large veins (>40 μm in diameter). As shown in Fig. 6, all four groups showed statistically significant vasodilation in comparison with their baselines and the diameter-dependent arterial dilation was observed under all three levels of anesthesia. However, no dose-dependent effect of isoflurane on vasodilation was observed in any of them at the three clinically relevant concentrations.
Influence of isoflurane on cerebral responses to systemic hypoxia
The anesthesia-induced profound reduction in CMRO2, as revealed by the head-restrained PAM in the normoxic mouse brain, suggested the potential of using isoflurane to protect the brain against hypoxia or ischemia. To gain more direct, quantitative, and comprehensive insights, we examined the influence of different concentrations of isoflurane on the multifaceted cerebral responses to systemic hypoxia. Similar to the normoxia study, 5 mice were monitored for ~2 hours under hypoxia, during which their states were altered by a stepwise increase of the isoflurane concentration (0, 0.5, 1.0, and 1.5 MAC). After each switch, a minimum of 15 minutes was waited to allow for equilibrium.
As shown in Fig. 7, the cerebral CHb remained unchanged when the awake mouse was switched from normoxia to hypoxia and later anesthetized with different doses of isoflurane, which was in contrast to the hypoxia-sensitive and isoflurane dose-dependent responses in sO2 and blood flow speed. As highlighted by the arrows, the arterial and venous sO2 dropped significantly in response to hypoxia. To compensate for the hypoxia-impaired cerebral oxygen supply, the flow speed was highly upregulated. Light anesthesia further elevated the blood flow, which partially retrieved sO2. However, increasing the isoflurane exposure to 1.5 MAC led to significant reduction in both sO2 and flow speed. By segmenting the feeding arteries and draining veins, we were able to calculate the average arterial and venous CHb, sO2, flow speed, and diameter for each mouse under both wakefulness and the three levels of anesthesia (Fig. 8a and supplementary Fig. S4). Again, CHb showed no statistically significant changes throughout the entire monitoring period. Different from that under normoxia, the average saO2 in the hypoxic brain exhibited a strong dependence on isoflurane concentration, increasing from 70±6% (awake baseline) to 82±4% (0.5 MAC) and then decreasing to 69±8% (1.0 MAC) and eventually to 52±7% (1.5 MAC). The significant decrease in saO2 was likely due to deep anesthesia-induced depression of respiration (Hedenstierna and Rothen, 2012). As shown in supplementary Fig. S5a, the respiratory rate of the mouse under systemic hypoxia decreased from 91±19 breaths/min to 22±4 breaths/min when the isoflurane concentration was increased from 0.5 MAC to 1.5 MAC. Blood-gas analysis revealed that the respiratory depression impaired oxygen supply and reduced PaO2 from 74±17 mmHg to 44±7 mmHg (supplementary Fig. S5b), which echoed the decrease in saO2 observed by our PAM. The low respiratory rate also compromised CO2 excretion, which consequently decreased the blood pH (supplementary Figs. S5c and S5d). The average svO2 followed the same trend as saO2, increasing to a peak at 66±4% (0.5 MAC) and then regressing to 37±6% (1.5 MAC). The sharp regression in svO2 exceeded that in saO2, which led to a significant increase in rOEF from 50±3% (0.5 MAC) to 73±15% (1.5 MAC) as shown in Fig. 8b. Similar to the biphasic response in sO2, both the blood flow speed and vessel diameter experienced moderate increases under light anesthesia and then gradually regressed back to the baselines with increased anesthetic depths. As a consequence of the combined effects on flow speed and vessel diameter, rCBFtotal showed a statistically significant drop from 141±14% (0.5 MAC) to 105±23% (1.5 MAC), which echoed our observation in the normoxic brain and was likely due to the anesthetic depression of myocardial contractility.
Figure 7.

Head-restrained PAM of CHb, sO2, and blood flow speed in the hypoxic mouse brain in the absence (0 MAC) and presence of different concentrations (0.5, 1.0, and 1.5 MAC) of isoflurane. The white arrows in the 2nd and 3rd rows highlight the hypoxia- and isoflurane-induced changes in sO2 and blood flow speed. Scale bar, 500 μm.
Interestingly, the CBF-OEF coupling seemed to remain effective in the hypoxic brain. As shown in Fig. 8b, the incremental exposure to isoflurane resulted in gradually elevated rOEF and reduced rCBFtotal, whose product was roughly a constant across different levels of anesthesia (70±6%, 68±14%, and 70±13% for light, medium, and deep anesthesia, respectively). Taking into consideration of the respiratory depression-induced decrease in saO2, however, rCMRO2 (normalized to the baseline measured in the hypoxic brain under wakefulness) showed an isoflurane dose-dependent decline from 83±7% (0.5 MAC) through 67±10% (1.0 MAC) to 53±10% (1.5 MAC). The anesthesia-induced reduction of CMRO2 from the awake baseline suggested a potential mechanism underlying the anesthetic neuroprotection against hypoxia- or ischemia-induced brain injury.
In striking contrast to the observation in the normoxic mouse brain, the isoflurane-induced dilation of small arteries (<40 μm in diameter) was much weaker under hypoxia and showed no statistically significant difference from that of large arteries (Fig. 9a). The reason was likely that these small arteries had been partially dilated under hypoxia (110±10%), prior to the isoflurane exposure (Fig. 9b). Besides vasodilation, hypoxia also showed profound impacts on other hemodynamic and metabolic parameters (supplementary Fig. S6), including decreased rsaO2 (79±7% of the baseline value measured under normoxia) and increased rOEF (148±14%), rCBFtotal (141±40%), and rCMRO2 (156±21%). These observations in the hypoxic mouse brain nicely echoed a recent human study using magnetic resonance imaging (Vestergaard et al., 2016).
Discussion
Anesthetic protection of the heart against ischemic injury has been established and widely applied in clinical practice (Zaugg et al., 2014). There is enormous interest in translating this great success from the heart to the brain, but the outcomes of clinical trials on anesthetic neuroprotection are controversial and the underlying mechanism remains inconclusive (Bilotta et al., 2013). Preclinical research in rodents, providing well controlled experimental conditions and relatively low heterogeneity among samples, is ideally suited for this mechanistic study. However, it has been a tremendous challenge to directly assess the anesthesia-induced changes in cerebral hemodynamics and oxygen metabolism from the “true” baseline under wakefulness, due to the lack of an appropriate tool to image the awake mouse brain (Kitano et al., 2007). The head-restrained PAM fills this technology gap.
Quantitative PAM characterization of cerebral hemodynamics and oxygen metabolism enables direct, reproducible, and comprehensive assessment of the brain responses to anesthesia (Fig. 2), advancing our current understanding based on the cerebral flow-metabolism coupling (Masamoto and Kanno, 2012). It has been shown that CBF and CMRO2 are tightly and dynamically coupled in the awake normal brain (Fox and Raichle, 1986). Interestingly, volatile anesthetics elevate CBF via vasodilation and reduce CMRO2 by suppressing brain activities, leading to the “uncoupling” of CBF and CMRO2 or so-called “luxury” perfusion (Kaisti et al., 2002). By simultaneous quantification of the evolutions of CBF, OEF, and CMRO2 from wakefulness to anesthesia, our head-restrained PAM reveals that the flow-metabolism uncoupling is mediated via a marked decrease in OEF (Fig. 3g). Follow-up studies in the normoxic mouse brain under different depths of anesthesia further reveals that, instead of the flow-metabolism coupling, a tight inverse coupling exists between CBF and OEF, which dynamically maintains CMRO2 at a statistically constant level (about half of that under wakefulness) across different anesthetic states (Fig. 5). The anesthesia-induced reduction in the oxygen demand may delay the hypoxia- or ischemia-induced brain injury, thereby holding the potential to expand the therapeutic window for other primary interventions to be effective. Along this direction, our study shows that the anesthesia-induced CMRO2 reduction remains effective in the hypoxic brain and that light anesthesia can partially retrieve the hypoxia-impaired saO2 (Fig. 8). However, increasing the depth of anesthesia without mechanical ventilation eventually results in respiratory depression, which suppresses the oxygen supply to the hypoxic brain and significantly reduces saO2. As a consequence, the CBF-OEF coupling is no longer able to maintain a constant metabolic level. The dose-dependent effects of isoflurane on OEF, CBF, and CMRO2 provide a possible explanation for the lack of consistency in previous experimental and clinical studies (Kitano et al., 2007).
Although the present study has demonstrated that volatile anesthetics can alleviate the metabolic crisis during hypoxia, the neuroprotective effect needs to be further examined in the diseased brain. Furthering this mechanistic study in mouse models of ischemic stroke will allow us to interrogate whether volatile anesthetics can attenuate cerebral infarction and improve neurological functions by reducing cerebral oxygen demand during ischemia.
On a different but related note, the profound effects of anesthesia on cerebral hemodynamics and metabolism revealed by our study suggest volatile anesthetics as potential confounding factors in understanding neurovascular and neurometabolic coupling—the foundation of all hemodynamics-based neuroimaging technologies. Moreover, different anesthetics may have different influence on the quantitative evaluation of the coupling (Franceschini et al., 2010; Masamoto and Kanno, 2012). Extending the isoflurane study to other volatile and intravenous anesthetics will help resolve the discrepancy between existing studies using different anesthetic settings. Carrying out neurovascular coupling studies in the awake mouse brain using the head-restrained PAM may lead to new observations that have been masked by anesthesia and allow more reliable evaluation of the effects of neuroactive drugs and interventions on cerebral hemodynamics and metabolism at the microscopic level.
There is plenty of space to improve our technology. One limitation of our current system is the relatively slow imaging speed, requiring ~15 minutes to scan an area of 2.5×2.5 mm2. This limitation prevents it from imaging rapid cerebral hemodynamic responses to neurostimulation and disease onsets (e.g., epileptic seizures). Integrating the head-restraint setting and our recently reported high-speed multi-parametric PAM (Wang et al., 2016) may provide a potential solution. Another limitation lies in the quantification of CMRO2. Using the average OEF and total CBF over the region of interest (ROI), our current calculation (Equation 5) does not take into consideration of the heterogeneity in the sO2 and CBF of individual feeding arteries and draining veins. Since vessels with higher flow typically exhibit larger sO2, the current method may lead to overestimation of CMRO2. Calculating the total oxygen inflow and outflow by respectively summing that of individual feeding arteries and draining veins may yield a more accurate estimation of CMRO2. However, this approach requires that the ROI has a perfectly closed circulation—the arterial blood flow is identical to the venous flow. Otherwise, the unbalance between the arterial and venous flow may cause considerable calculation errors. The histogram approach reported recently (Chong et al., 2015) represents a practical and reasonable compromise.
Conclusion
We have developed first-of-a-kind head-restrained PAM for time-lapse and quantitative imaging of hemodynamics and oxygen metabolism in the awake mouse brain. Side-by-side comparison of the awake and anesthetized brain using this enabling technology revealed strong and multifaceted cerebral responses to isoflurane—including the diameter-dependent arterial dilation, elevated CBF, reduced OEF, and declined CMRO2. Further comparison of these responses to different depths of anesthesia uncovered intriguing dose-dependent effects of isoflurane on OEF, CBF, and CMRO2 under both systemic normoxia and hypoxia. Our results suggest that the widely reported but poorly understood anesthetic neuroprotection may be mediated through anesthesia-induced suppression of the cerebral oxygen demand and that the protection may be dose-dependent. The head-restrained PAM bridges the critical gap between functional and molecular microscopy of the awake mouse brain. Future integration of the two microscopy techniques with highly complementary contrasts into one head-restrained setting will open up exciting new opportunities in basic and translational neuroscience.
Supplementary Material
Acknowledgments
This work was supported by the National Institutes of Health (Grants AG052062, EB020843, and GM098308) and the American Heart Association (National Scientist Development Grant 15SDG25960005).
Footnotes
Publisher's Disclaimer: This is a PDF file of an unedited manuscript that has been accepted for publication. As a service to our customers we are providing this early version of the manuscript. The manuscript will undergo copyediting, typesetting, and review of the resulting proof before it is published in its final citable form. Please note that during the production process errors may be discovered which could affect the content, and all legal disclaimers that apply to the journal pertain.
References
- Bilotta F, Gelb AW, Stazi E, Titi L, Paoloni FP, Rosa G. Pharmacological perioperative brain neuroprotection: a qualitative review of randomized clinical trials. Br J Anaesth. 2013;110:113–20. doi: 10.1093/bja/aet059. [DOI] [PubMed] [Google Scholar]
- Chen SL, Xie Z, Carson PL, Wang X, Guo LJ. In vivo flow speed measurement of capillaries by photoacoustic correlation spectroscopy. Opt Lett. 2011;36:4017–9. doi: 10.1364/OL.36.004017. [DOI] [PMC free article] [PubMed] [Google Scholar]
- Chen X, Leischner U, Varga Z, Jia H, Deca D, Rochefort NL, Konnerth A. LOTOS-based two-photon calcium imaging of dendritic spines in vivo. Nat Protoc. 2012;7:1818–1829. doi: 10.1038/nprot.2012.106. [DOI] [PubMed] [Google Scholar]
- Chong SP, Merkle CW, Leahy C, Srinivasan VJ. Cerebral metabolic rate of oxygen (CMRO_2) assessed by combined Doppler and spectroscopic OCT. Biomed Opt Express. 2015;6:3941. doi: 10.1364/BOE.6.003941. [DOI] [PMC free article] [PubMed] [Google Scholar]
- DeFelipe J. The evolution of the brain, the human nature of cortical circuits, and intellectual creativity. Front Neuroanat. 2011;5:29. doi: 10.3389/fnana.2011.00029. [DOI] [PMC free article] [PubMed] [Google Scholar]
- Dombeck DA, Harvey CD, Tian L, Looger LL, Tank DW. Functional imaging of hippocampal place cells at cellular resolution during virtual navigation. Nat Neurosci. 2010;13:1433–40. doi: 10.1038/nn.2648. [DOI] [PMC free article] [PubMed] [Google Scholar]
- Dombeck DA, Khabbaz AN, Collman F, Adelman TL, Tank DW. Imaging large-scale neural activity with cellular resolution in awake, mobile mice. Neuron. 2007;56:43–57. doi: 10.1016/j.neuron.2007.08.003. [DOI] [PMC free article] [PubMed] [Google Scholar]
- Drew PJ, Shih AY, Driscoll JD, Knutsen PM, Blinder P, Davalos D, Akassoglou K, Tsai PS, Kleinfeld D. Chronic optical access through a polished and reinforced thinned skull. Nat Methods. 2010;7:981–984. doi: 10.1038/nmeth.1530. [DOI] [PMC free article] [PubMed] [Google Scholar]
- Everds N. The Laboratory Mouse, The Laboratory Mouse. Elsevier. 2004 doi: 10.1016/B978-012336425-8/50070-4. [DOI] [Google Scholar]
- Flusberg BA, Nimmerjahn A, Cocker ED, Mukamel EA, Barretto RPJ, Ko TH, Burns LD, Jung JC, Schnitzer MJ. High-speed, miniaturized fluorescence microscopy in freely moving mice. Nat Methods. 2008;5:935–938. doi: 10.1038/nmeth.1256. [DOI] [PMC free article] [PubMed] [Google Scholar]
- Fox PT, Raichle ME. Focal physiological uncoupling of cerebral blood flow and oxidative metabolism during somatosensory stimulation in human subjects. Proc Natl Acad Sci U S A. 1986;83:1140–4. doi: 10.1073/pnas.83.4.1140. [DOI] [PMC free article] [PubMed] [Google Scholar]
- Franceschini MA, Radhakrishnan H, Thakur K, Wu W, Ruvinskaya S, Carp S, Boas DA. The effect of different anesthetics on neurovascular coupling. Neuroimage. 2010;51:1367–77. doi: 10.1016/j.neuroimage.2010.03.060. [DOI] [PMC free article] [PubMed] [Google Scholar]
- Greenberg DS, Houweling AR, Kerr JND. Population imaging of ongoing neuronal activity in the visual cortex of awake rats. Nat Neurosci. 2008;11:749–751. doi: 10.1038/nn.2140. [DOI] [PubMed] [Google Scholar]
- Hamel EJO, Grewe BF, Parker JG, Schnitzer MJ. Cellular Level Brain Imaging in Behaving Mammals: An Engineering Approach. Neuron. 2015;86:140–159. doi: 10.1016/j.neuron.2015.03.055. [DOI] [PMC free article] [PubMed] [Google Scholar]
- Harvey CD, Collman F, Dombeck DA, Tank DW. Intracellular dynamics of hippocampal place cells during virtual navigation. Nature. 2009;461:941–6. doi: 10.1038/nature08499. [DOI] [PMC free article] [PubMed] [Google Scholar]
- Hedenstierna G, Rothen HU. Comprehensive Physiology. John Wiley & Sons, Inc.; Hoboken, NJ, USA: 2012. Respiratory Function During Anesthesia: Effects on Gas Exchange. [DOI] [PubMed] [Google Scholar]
- Helmchen F, Fee MS, Tank DW, Denk W. A Miniature Head-Mounted Two-Photon Microscope. Neuron. 2001;31:903–912. doi: 10.1016/S0896-6273(01)00421-4. [DOI] [PubMed] [Google Scholar]
- Helmchen F, Fee MS, Tank DW, Denk W. A miniature head-mounted two-photon microscope. high-resolution brain imaging in freely moving animals. Neuron. 2001;31:903–12. doi: 10.1016/s0896-6273(01)00421-4. [DOI] [PubMed] [Google Scholar]
- Horvath I, Sandor NT, Ruttner Z, McLaughlin AC. Role of nitric oxide in regulating cerebrocortical oxygen consumption and blood flow during hypercapnia. J Cereb blood flow Metab. 1994;14:503–509. doi: 10.1038/jcbfm.1994.62. [DOI] [PubMed] [Google Scholar]
- Hu S. Listening to the Brain with Photoacoustics. IEEE J Sel Top Quantum Electron. 2016;22:1–10. doi: 10.1109/JSTQE.2015.2487890. [DOI] [Google Scholar]
- Hu S, Wang LV. Neurovascular photoacoustic tomography. Front Neuroenergetics. 2010;2:10. doi: 10.3389/fnene.2010.00010. [DOI] [PMC free article] [PubMed] [Google Scholar]
- Jo J, Zhang H, Cheney PD, Yang X. Photoacoustic detection of functional responses in the motor cortex of awake behaving monkey during forelimb movement. J Biomed Opt. 2012;17:110503. doi: 10.1117/1.JBO.17.11.110503. [DOI] [PMC free article] [PubMed] [Google Scholar]
- Kaisti KK, Langsjo JW, Aalto S, Oikonen V, Sipila H, Teras M, Hinkka S, Metsahonkala L, Scheinin H. Effects of sevoflurane, propofol and adjunct nitrous oxide on regional cerebral blood flow, oxygen consumption, and blood volume in humans. Anesthesiology. 2003;99:603–613. doi: 10.1097/00000542-200309000-00015. [DOI] [PubMed] [Google Scholar]
- Kaisti KK, Metsähonkala L, Teräs M, Oikonen V, Aalto S, Jääskeläinen S, Hinkka S, Scheinin H. Effects of Surgical Levels of Propofol and Sevoflurane Anesthesia on Cerebral Blood Flow in Healthy Subjects Studied with Positron Emission Tomography. J Am Soc Anesthesiol. 2002;96:1358–1370. doi: 10.1097/00000542-200206000-00015. [DOI] [PubMed] [Google Scholar]
- Kitano H, Kirsch JR, Hurn PD, Murphy SJ. Inhalational anesthetics as neuroprotectants or chemical preconditioning agents in ischemic brain. J Cereb Blood Flow Metab. 2007;27:1108–28. doi: 10.1038/sj.jcbfm.9600410. [DOI] [PMC free article] [PubMed] [Google Scholar]
- Kleinfeld D, Griesbeck O. From art to engineering? The rise of in vivo mammalian electrophysiology via genetically targeted labeling and nonlinear imaging. PLoS Biol. 2005 doi: 10.1371/journal.pbio.0030355. [DOI] [PMC free article] [PubMed] [Google Scholar]
- Martin C, Martindale J, Berwick J, Mayhew J. Investigating neural–hemodynamic coupling and the hemodynamic response function in the awake rat. Neuroimage. 2006;32:33–48. doi: 10.1016/j.neuroimage.2006.02.021. [DOI] [PubMed] [Google Scholar]
- Masamoto K, Kanno I. Anesthesia and the quantitative evaluation of neurovascular coupling. J Cereb Blood Flow Metab. 2012;32:1233–47. doi: 10.1038/jcbfm.2012.50. [DOI] [PMC free article] [PubMed] [Google Scholar]
- Nakao Y, Itoh Y, Kuang TY, Cook M, Jehle J, Sokoloff L. Effects of anesthesia on functional activation of cerebral blood flow and metabolism. Proc Natl Acad Sci U S A. 2001;98:7593–7598. doi: 10.1073/pnas.121179898. [DOI] [PMC free article] [PubMed] [Google Scholar]
- Ning B, Sun N, Cao R, Chen R, SHung KK, Hossack JA, Lee JM, Zhou Q, Hu S. Ultrasound-aided multi-parametric photoacoustic microscopy of the mouse brain. Sci Rep. 2015:1–7. doi: 10.1038/srep18775. [DOI] [PMC free article] [PubMed] [Google Scholar]
- Qiu M, Ramani R, Swetye M, Rajeevan N, Constable RT. Anesthetic effects on regional CBF, BOLD, and the coupling between task-induced changes in CBF and BOLD: An fMRI study in normal human subjects. Magn Reson Med. 2008;60:987–996. doi: 10.1002/mrm.21759. [DOI] [PMC free article] [PubMed] [Google Scholar]
- Rusy BF, Komai H. Anesthetic depression of myocardial contractility: a review of possible mechanisms. Anesthesiology. 1987;67:745–66. doi: 10.1097/00000542-198711000-00020. [DOI] [PubMed] [Google Scholar]
- Sakadzić S, Roussakis E, Yaseen Ma, Mandeville ET, Srinivasan VJ, Arai K, Ruvinskaya S, Devor A, Lo EH, Vinogradov Sa, Boas Da. Two-photon high-resolution measurement of partial pressure of oxygen in cerebral vasculature and tissue. Nat Methods. 2010;7:755–9. doi: 10.1038/nmeth.1490. [DOI] [PMC free article] [PubMed] [Google Scholar]
- Sawinski J, Wallace DJ, Greenberg DS, Grossmann S, Denk W, Kerr JND. Visually evoked activity in cortical cells imaged in freely moving animals. Proc Natl Acad Sci U S A. 2009;106:19557–62. doi: 10.1073/pnas.0903680106. [DOI] [PMC free article] [PubMed] [Google Scholar]
- Scott BB, Brody CD, Tank DW. Cellular Resolution Functional Imaging in Behaving Rats Using Voluntary Head Restraint. Neuron. 2013;80:371–384. doi: 10.1016/j.neuron.2013.08.002. [DOI] [PMC free article] [PubMed] [Google Scholar]
- Shih AY, Friedman B, Drew PJ, Tsai PS, Lyden PD, Kleinfeld D. Active dilation of penetrating arterioles restores red blood cell flux to penumbral neocortex after focal stroke. J Cereb Blood Flow Metab. 2009;29:738–751. doi: 10.1038/jcbfm.2008.166. [DOI] [PMC free article] [PubMed] [Google Scholar]
- Shtoyerman E, Arieli A, Slovin H, Vanzetta I, Grinvald A. Long-term optical imaging and spectroscopy reveal mechanisms underlying the intrinsic signal and stability of cortical maps in V1 of behaving monkeys. J Neurosci. 2000;20:8111–8121. doi: 10.1523/JNEUROSCI.20-21-08111.2000. pii. [DOI] [PMC free article] [PubMed] [Google Scholar]
- Soetikno B, Hu S, Gonzales E, Zhong Q, Maslov K, Lee JM, Wang LV. Vessel segmentation analysis of ischemic stroke images acquired with photoacoustic microscopy. SPIE BiOS. 2012;8223:822345. doi: 10.1117/12.911089. [DOI] [Google Scholar]
- Stosiek C, Garaschuk O, Holthoff K, Konnerth A. In vivo two-photon calcium imaging of neuronal networks. Proc Natl Acad Sci U S A. 2003;100:7319–7324. doi: 10.1073/pnas.1232232100. [DOI] [PMC free article] [PubMed] [Google Scholar]
- Stullken EH, Milde JH, Michenfelder JD, Tinker JH. The nonlinear responses of cerebral metabolism to low concentrations of halothane, enflurane, isoflurane, and thiopental. Anesthesiology. 1977;46:28–34. doi: 10.1097/00000542-197701000-00007. [DOI] [PubMed] [Google Scholar]
- Tang J, Dai X, Jiang H. Wearable scanning photoacoustic brain imaging in behaving rats. J Biophotonics. 2016;6:n/a–n/a. doi: 10.1002/jbio.201500311. [DOI] [PubMed] [Google Scholar]
- Vestergaard MB, Lindberg U, Aachmann-Andersen NJ, Lisbjerg K, Christensen SJ, Law I, Rasmussen P, Olsen NV, Larsson HB. Acute hypoxia increases the cerebral metabolic rate - a magnetic resonance imaging study. J Cereb Blood Flow Metab. 2016;36:1046–58. doi: 10.1177/0271678X15606460. [DOI] [PMC free article] [PubMed] [Google Scholar]
- Wang T, Sun N, Cao R, Ning B, Chen R, Zhou Q, Hu S. Multiparametric photoacoustic microscopy of the mouse brain with 300-kHz A-line rate. Neurophotonics. 2016;3:45006. doi: 10.1117/1.NPh.3.4.045006. [DOI] [PMC free article] [PubMed] [Google Scholar]
- Wang LV, Hu S. Photoacoustic Tomography: In Vivo Imaging from Organelles to Organs. Science (80-) 2012;335:1458–1462. doi: 10.1126/science.1216210. [DOI] [PMC free article] [PubMed] [Google Scholar]
- Yablonskiy DA. Cerebral metabolic rate in hypercapnia: controversy continues. J Cereb Blood Flow Metab. 2011;31:1502–1503. doi: 10.1038/jcbfm.2011.32. [DOI] [PMC free article] [PubMed] [Google Scholar]
- Yang G, Pan F, Parkhurst CN, Grutzendler J, Gan WB. Thinned-skull cranial window technique for long-term imaging of the cortex in live mice. Nat Protoc. 2010;5:201–208. doi: 10.1038/nprot.2009.222. [DOI] [PMC free article] [PubMed] [Google Scholar]
- Yao J, Wang L, Yang JM, Maslov KI, Wong TTW, Li L, Huang CH, Zou J, Wang LV. High-speed label-free functional photoacoustic microscopy of mouse brain in action. Nat Methods. 2015;12:407–10. doi: 10.1038/nmeth.3336. [DOI] [PMC free article] [PubMed] [Google Scholar]
- Yi J, Chen S, Backman V, Zhang HF. In vivo functional microangiography by visible-light optical coherence tomography. Biomed Opt Express. 2014;5:3603–3612. doi: 10.1364/BOE.5.003603. [DOI] [PMC free article] [PubMed] [Google Scholar]
- Zaugg M, Lucchinetti E, Behmanesh S, Clanachan AS. Anesthetic cardioprotection in clinical practice from proof-of-concept to clinical applications. Curr Pharm Des. 2014;20:5706–26. doi: 10.2174/1381612820666140204120829. [DOI] [PubMed] [Google Scholar]
- Zhang HF, Maslov K, Sivaramakrishnan M, Stoica G, Wang LV. Imaging of hemoglobin oxygen saturation variations in single vessels in vivo using photoacoustic microscopy. Appl Phys Lett. 2007;90:53901. doi: 10.1063/1.2435697. [DOI] [Google Scholar]
- Zuo Z. Are volatile anesthetics neuroprotective or neurotoxic? Med Gas Res. 2012;2:10. doi: 10.1186/2045-9912-2-10. [DOI] [PMC free article] [PubMed] [Google Scholar]
- Zwerus R, Absalom A. Update on anesthetic neuroprotection. Curr Opin Anaesthesiol. 2015;28:424–30. doi: 10.1097/ACO.0000000000000212. [DOI] [PubMed] [Google Scholar]
Associated Data
This section collects any data citations, data availability statements, or supplementary materials included in this article.