

Abstract
Narcolepsy is characterized by chronic sleepiness and cataplexy—sudden muscle paralysis triggered by strong, positive emotions. This condition is caused by a lack of orexin (hypocretin) signaling, but little is known about the neural mechanisms that mediate cataplexy. The amygdala regulates responses to rewarding stimuli and contains neurons active during cataplexy. In addition, lesions of the amygdala reduce cataplexy. Because GABAergic neurons of the central nucleus of the amygdala (CeA) target brainstem regions known to regulate muscle tone, we hypothesized that these cells promote emotion-triggered cataplexy. We injected adeno-associated viral vectors coding for Cre-dependent DREADDs or a control vector into the CeA of orexin knock-out mice crossed with vGAT-Cre mice, resulting in selective expression of the excitatory hM3 receptor or the inhibitory hM4 receptor in GABAergic neurons of the CeA. We measured sleep/wake behavior and cataplexy after injection of saline or the hM3/hM4 ligand clozapine-N-oxide (CNO) under baseline conditions and under conditions that should elicit positive emotions. In mice expressing hM3, CNO approximately doubled the amount of cataplexy in the first 3 h after dosing under baseline conditions. Rewarding stimuli (chocolate or running wheels) also increased cataplexy, but CNO produced no further increase. In mice expressing hM4, CNO reduced cataplexy in the presence of chocolate or running wheels. These results demonstrate that GABAergic neurons of the CeA are sufficient and necessary for the production of cataplexy in mice, and they likely are a key part of the mechanism through which positive emotions trigger cataplexy.
SIGNIFICANCE STATEMENT Cataplexy is one of the major symptoms of narcolepsy, but little is known about how strong, positive emotions trigger these episodes of muscle paralysis. Prior research shows that amygdala neurons are active during cataplexy and cataplexy is reduced by lesions of the amygdala. We found that cataplexy is substantially increased by selective activation of GABAergic neurons in the central nucleus of the amygdala (CeA). We also demonstrate that inhibition of these neurons reduces reward-promoted cataplexy. These results build upon prior work to establish the CeA as a crucial element in the neural mechanisms of cataplexy. These results demonstrate the importance of the CeA in regulating responses to rewarding stimuli, shedding light on the broader neurobiology of emotions and motor control.
Keywords: cataplexy, DREADDs, hypocretin, mouse, narcolepsy, orexin
Introduction
Narcolepsy is one of the more common sleep disorders and its major symptoms include chronic sleepiness and cataplexy—brief episodes of muscle weakness or complete paralysis triggered by strong, usually positive emotions. Narcolepsy is caused by severe and selective loss of the hypothalamic neurons producing the orexin (hypocretin) neuropeptides (Peyron et al., 2000; Thannickal et al., 2000; Crocker et al., 2005). Just as in people, mice lacking the orexin neuropeptides have severe sleepiness and their cataplexy is increased by rewarding stimuli such as social interaction, access to running wheels, or highly palatable foods such as chocolate (Chemelli et al., 1999; Mochizuki et al., 2004; España et al., 2007; Clark et al., 2009; Scammell et al., 2009; Novak et al., 2012; Dubreucq et al., 2013; De Luca, 2014; Vichaya et al., 2014).
Cataplexy is thought to be driven by the same brainstem mechanisms that produce the paralysis of rapid eye movement (REM) sleep (Burgess and Scammell, 2012), but clinicians and researchers have long wondered how cataplexy is triggered by positive emotions such as those that occur when joking or unexpectedly meeting a friend (Overeem et al., 2011). The amygdala plays an essential role in processing and driving emotional responses to positive stimuli (Holland and Gallagher, 1999; Paton et al., 2006; Tye et al., 2008) and the central nucleus (CeA) and basolateral nucleus (BLA) of the amygdala contain neurons that fire in association with cataplexy (Gulyani et al., 2002). The CeA is the major output nucleus of the amygdala, and GABAergic neurons of the CeA strongly innervate and likely inhibit several brainstem regions that normally increase muscle tone (Burgess et al., 2013). In addition, excitotoxic lesions of the CeA and BLA substantially reduce cataplexy in orexin knock-out (KO) mice across a variety of conditions (Burgess et al., 2013). These findings suggest that the amygdala is necessary for cataplexy, but the specific amygdala nuclei and cell types mediating cataplexy remain unknown.
We hypothesized that neural signals related to positive emotions promote cataplexy by activating GABAergic neurons in the CeA. To test this idea, we investigated whether selective, chemogenetic activation of GABAergic CeA neurons in orexin KO mice increases cataplexy under baseline conditions and under conditions that likely elicit positive emotions. In addition, we tested whether selective chemogenetic inhibition of these neurons reduces cataplexy under the same conditions.
Materials and Methods
Animals
These experiments were approved by the Institutional Animal Care and Use Committee of Beth Israel Deaconess Medical Center and Harvard Medical School and were performed in accordance with the National Institutes of Health Guide for the Care and Use of Laboratory Animals.
To limit gene expression to GABAergic neurons in a mouse model of narcolepsy, we crossed recombinant mice in which the vesicular GABA/glycine transporter gene drives expression of cre recombinase (vGAT-IRES-cre mice) with pre-pro-orexin KO (OXKO) mice (Chemelli et al., 1999; Mochizuki et al., 2004; Vong et al., 2011), resulting in mice heterozygous for vGAT-cre and homozygous for the null pre-pro-orexin gene (vGAT-cre/OXKO). We chose to use OXKO mice as a model of narcolepsy because they consistently exhibit cataplexy. Mice lacking the orexin neurons are also a good model of human narcolepsy, but we find that these mice have less cataplexy than OXKO mice (although ample cataplexy has been reported by other groups: Hara et al., 2001; Kantor et al., 2009; Kantor et al., 2013; Black et al., 2014; Tabuchi et al., 2014). Mice were housed on a 12/12 light/dark cycle (lights on at 0700) with constant temperature (22 ± 1.6°C) and humidity (25 ± 2.2 mmHg). Regular chow and water were available ad libitum. In all experiments, we used male, vGAT-cre/OXKO mice that were age 14–21 weeks and weighed 19–28 g at the time of surgery.
Experimental design
In Experiment 1, we tested whether CeA GABAergic neurons can increase cataplexy. The hM3 DREADD receptor is an engineered muscarinic receptor that depolarizes neurons in response to clozapine-N-oxide (CNO) but not to acetylcholine (Armbruster et al., 2007; Sternson and Roth, 2014). We injected vGAT-cre/OXKO mice with an adeno-associated viral (AAV) vector coding for a Cre-dependent hM3-mCherry fusion protein in a double-floxed inverted open reading frame under the human synapsin 1 (hsyn) promoter (AAV8-hsyn-DIO-hM3(Gq)-mCherry, referred to as AAV-hM3-mCherry; titer 2 × 10¹²). Two weeks later, we implanted mice with a polysomnogram head stage. After 10 d of recovery, we injected each mouse twice with intraperitoneal saline to habituate them to handling and injection.
We tested mice under three sequential conditions: regular chow, followed 2 weeks later by chocolate plus regular chow, followed 3 weeks later by ad libitum running wheel access plus regular chow. Within each condition, we treated mice with CNO (0.3 mg/kg; 0.1 cc/10 g mouse weight, i.p.) or saline (equivalent volume, i.p.) 15 min before lights off in random order with at least a 3 d washout between treatments. We also tested the effects of higher doses of CNO (0.6 and 1.0 mg/kg) and found these had effects on cataplexy very similar to those seen with the 0.3 mg/kg dose (data not shown). For the chocolate condition, we placed a single Hershey's kiss (4.5–4.7 g) in the cage at lights off, and we removed any remaining chocolate after 24 h. We allowed at least 5 d between chocolate doses to minimize any habituation to chocolate. For the running wheel condition, we allowed 10 d for mice to habituate to the running wheel and recorded wheel rotations using a photodetector beneath a low-torque, polycarbonate running wheel (Fast-Trac; Bio-Serv) (España et al., 2007). Based on the kinetics of CNO and because the amounts of cataplexy can vary from hour to hour, our primary end points were the amount of cataplexy and the number of cataplexy bouts in the first 3 h after administration of CNO or saline (Alexander et al., 2009). A subset of mice were injected with CNO or saline or given chocolate and perfused 2 h later to examine the pattern of Fos expression induced by CNO.
In Experiment 2, we tested whether CeA GABAergic neurons are necessary for cataplexy. We used the hM4 DREADD receptor, an engineered muscarinic receptor that hyperpolarizes neurons in response to CNO, but not to acetylcholine (Armbruster et al., 2007). We injected vGAT-cre/OXKO mice with Cre-dependent AAV8-hsyn-DIO-hM4(Gi)-mCherry (referred to as AAV-hM4-mCherry; titer 5 × 10¹²) and implanted them with a head stage for sleep recordings 2 weeks later. Testing conditions and data analysis were the same as in Experiment 1.
In Experiment 3, we tested whether CNO itself might have any effects on cataplexy or sleep/wake behavior by injecting a group of vGAT-cre/OXKO mice with an AAV coding for Cre-dependent-mCherry (AAV8-hsyn-DIO-mCherry; titer 4 × 10¹², referred to as AAV-mCherry). In these negative control mice, surgery, testing conditions, and data analysis were the same as in Experiments 1 and 2.
Validation of hM3 expression in vGAT neurons
To determine whether hM3 and hM4 expression was limited to GABAergic neurons of the CeA, we conducted fluorescent in situ hybridization (FISH) against vGAT mRNA followed by immunostaining for mCherry in three mice.
Neuronal activation with CNO
To test whether CNO activates GABAergic CeA neurons expressing hM3, we unilaterally injected 30 nl of AAV-hM3-mCherry into three vGAT-cre/OXKO mice. Four weeks later, we administered CNO (0.3 mg/kg, i.p.) and perfused the mice 2 h later. We immunostained brain sections for Fos and mCherry and counted the numbers of fluorescent single- and double-labeled neurons in the CeA across three adjacent sections. To test whether CNO activated a similar number of neurons as in the chocolate condition, we injected a subset of hM3 mice with saline (n = 4) or CNO 0.3 mg/kg (n = 4) or provided access to chocolate (n = 4) 2 h before perfusion.
Surgery
We anesthetized vGAT-cre/OXKO mice with ketamine/xylazine (100/10 mg/kg, i.p.) and placed them in a stereotaxic alignment system (model 1900; Kopf Instruments). In Experiment 1, we unilaterally or bilaterally injected mice with 30 nl of AAV-hM3-mCherry (n = 10 and 20, respectively) using an air pressure injection system and glass micropipette (∼20 μm tip diameter). In Experiment 2, we injected mice with 40 nl of AAV-hM4-mCherry (n = 14) and injected negative control mice with 40 nl of AAV-mCherry (n = 15). Microinjections were targeted at the CeA (AP: ±1.45, ML: ±2.75, DV: −4.7 from bregma). Two weeks later, we implanted electroencephalogram (EEG) and electromyogram (EMG) electrodes for polysomnogram recordings under ketamine/xylazine anesthesia. We implanted two stainless steel screws into the skull 1.5 mm lateral and 0.5 mm rostral to bregma and 1.0 mm rostral to lambda. We made EMG electrodes from multistranded stainless steel wire (Cooner Wire) and placed them into the neck extensor muscles. We soldered the electrodes to a 2 × 2 pin microstrip connector and affixed it to the skull with dental cement. We treated each mouse with meloxicam (5 mg/kg, s.c.) immediately after surgery and 24 h later.
Sleep recordings and scoring
One week after implantation of EEG and EMG electrodes, we transferred mice to recording cages in a sound-attenuated box. We attached the recording cable to a low-torque electrical swivel that was fixed to the cage top to allow free movement. We allowed the mice >4 d to habituate to the recording cable and chamber. After injection of CNO or saline, we acquired EEG/EMG and simultaneous infrared video for 48 h. The EEG/EMG signals were amplified, filtered (high-pass, 0.3 Hz; low-pass, 1 kHz), digitized at a sampling rate of 256 Hz, and recorded with SleepSign software (Kissei Comtec). We used SleepSign (filter settings: EEG, 0.25–64 Hz; EMG, 10–60 Hz) for preliminary, semiautomatic scoring of wake, REM, and non-REM (NREM) sleep in 10 s epochs and then examined all epochs and made corrections when necessary. We scored cataplexy according to previously published criteria (Scammell et al., 2009). Specifically, we scored behavior as cataplexy if it met four criteria: (1) the behavior consisted of an abrupt episode of nuchal atonia lasting at least 10 s; (2) the mouse was immobile during the episode; (3) the EEG showed high theta activity and low delta activity during the episode (Vassalli et al., 2013); and (4) at least 40 s of wakefulness preceded the episode. We also closely examined video recordings for any signs of freezing and saw none under any conditions. Based on the kinetics of CNO, our primary end points were the amount of cataplexy and the number of cataplexy bouts in the first 3 h after administration of CNO or saline.
Histology
We deeply anesthetized mice with ketamine/xylazine (150/15 mg/kg) and transcardially perfused them with 0.1 m PBS followed by 10% formalin. We stored mouse brains in 10% formalin overnight and cryoprotected them for at least 24 h in 20% sucrose in formalin–PBS at 4°C. Using a freezing microtome cleaned with RNaseZap (Life Technologies), we sectioned brains at 30 μm and collected the sections in a 1:4 series in 1% formalin in DEPC–PBS. We transferred 3 of the 4 series to PBS-azide and stored them at 4°C. We transferred the remaining series to RNAlater cryoprotectant solution (Ambion), left the sections on the shaker at room temperature for 1 h, and then stored them at −20°C.
We used all four series for anatomic studies. To map AAV injection sites, we immunostained one series for mCherry (the fluorescent marker of hM3 and hM4 expression). To determine AAV transduction efficiency and whether hM3-mCherry is expressed only in GABAergic neurons, we processed a second series for fluorescence in situ hybridization (FISH) for vGAT mRNA followed by fluorescent immunolabeling for mCherry. For these FISH sections, we immunolabeled for mCherry because FISH reduced the intensity of the native mCherry fluorescence. To determine whether CNO activates neurons expressing hM3, we processed a third series of sections from hM3 mice for Fos and mCherry double-fluorescence immunocytochemistry. To compare overall Fos expression across conditions, we immunostained the fourth series for Fos using nickel–3,3′-diaminobenzidine (DAB) in hM3 mice treated with saline, CNO, or chocolate 2 h before perfusion.
Immunohistochemistry
Mapping AAV injection sites.
To label mCherry, we incubated sections overnight in rabbit anti-dsRed antiserum (Clontech #632496, lot #1304038, RRID: AB_10013483; mCherry is a variant of dsRed), diluted 1:5000 in PBT-normal horse serum (NHS) solution. We washed sections 4 times (5 min each) in PBS and incubated them for 2 h in biotinylated donkey anti-rabbit secondary antiserum (Jackson ImmunoResearch catalog #711065152, lot #108377, RRID: AB_2340593) diluted 1:500 in PBT–NHS, followed by 1 h in avidin-biotin complex (Vectastain ABC Elite Kit; Vector Laboratories) and labeled neurons brown with DAB. Dark-field images were taken to identify anatomic landmarks and determine injection site boundaries.
Fos expression in hM3-expressing neurons.
To label Fos fluorescently, we incubated sections overnight in rabbit anti-Fos antiserum (Millipore #PC38, lot #D00088552, RRID: AB_2106755), diluted 1:10,000 in PBT–NHS solution. We washed sections 4 times (5 min each) in PBS. We then incubated them for 2 h in Alexa Fluor 488-conjugated donkey anti-rabbit secondary antiserum (Invitrogen #A21206, lot #1674651, RRID: AB_141708) diluted 1:500 in PBT-NHS. We collected 10 1-μm-thick optical sections using confocal microscopy of native mCherry (red) and Fos (green) at 400× magnification and collapsed these using the z-stack function of ImageJ.
Fos expression in the CeA.
To single label Fos for bright-field microscopy, we incubated sections overnight in rabbit anti-Fos antiserum (Millipore #ABE457, lot #2672548, RRID: AB_2631318), diluted 1:5000 in PBT–NHS solution. We washed sections 4 times (5 min each) in PBS. We then incubated them for 2 h in biotinylated donkey anti-rabbit secondary antiserum diluted 1:500 in PBT–NHS, followed by 1 h in avidin-biotin complex (Vectastain ABC Elite Kit; Vector Laboratories) and labeled Fos-immunoreactive nuclei dark blue using DAB with 0.16% nickel.
In situ hybridization followed by immunocytochemistry
We rinsed sections 4 times (5 min each) in DEPC–PBS and incubated them in hybridization buffer (50% formamide; 5× SSC; 0.5 mg/ml t-RNA, Roche; 5% dextran; 1× Denhardt's solution; 0.1% Tween 20; DEPC–water) for 1 h at 54°C. We transcribed the digoxigenin-labeled RNA probe (542 bp, refer to NM_009508.2, bp 875 to 1416) from a pGEM-T Easy plasmid (with a 3557 bp insert). We linearized the plasmid with Sac1 (New England Lab) and transcribed riboprobes with T7 polymerase (Roche) in the presence of digoxigenin-conjugated-UTP (Roche, DIG RNA labeling mix). We added digoxigenin-labeled antisense vGAT riboprobe (300 ng/μl probe) to each well and incubated the sections at 54°C overnight.
We washed the tissue in 2× SSC in 50% formamide for 45 min at 54°C, followed by two 30 min washes in 2× SSC. We eliminated the non-hybridized RNA probes with an RNaseA step: sections were washed 2× (5 min each) in RNAase buffer (0.5 m NaCl and 10 mm Tris-HCl) before and after a 30 min incubation at 37°C in RNAase A (50 μg/ml). We washed the sections in 2× SSC (5 min), then 2× SSC-50% formamide (5 min at 54C), followed by two 5 min washes in 1× SSC-50% formamide in DEPC-H2O, and then three 5 min washes in TBS. We incubated the sections in Boehringer blocking reagent (Roche, diluted to 5% w/v in TBS with 0.1% Tween) at 54°C for 30 min and then incubated the tissue with anti-digoxigenin-peroxidase antigen-binding fragments (Roche #11-207-733-910, lot #14299300, RRID: AB_541500) at 1:200 in blocking reagent overnight.
We washed the sections in TBS 3 times (10 min each) in preparation for the tyramide signal amplification step. We incubated the tissue for 30 min with biotinylated tyramide (PerkinElmer #FP1019, lot #1673734) diluted 1:50 in amplification buffer (#FP1050). We washed the tissue in TBS (5 min), PBS (rinse), PBS (10 min), and then PBT (2 h), and incubated the tissue in streptavidin-Alexa488 (Invitrogen #S11223, lot #1256181), diluted 1:1000 in PBT, for 2 h. To immunolabel mCherry, we incubated the sections in rabbit anti-dsRed antiserum (Clontech #632496, lot #1304038, RRID: AB_10013483), diluted 1:5000 in PBS with 0.25% Triton X-100 and 3% NHS for 12 h. We washed the sections 4× in PBS and incubated them for 2 h in Alexa Fluor 555-conjugated donkey anti-rabbit secondary antiserum (Invitrogen A31572, lot #1636859, AB_162543) diluted 1:500 in PBT–NHS. After four washes in PBS, we mounted the sections and coverslipped the slides with fluorescent mounting medium (Dako #S3023).
After FISH for vGAT mRNA and immunolabeling for mCherry, sections were imaged on a confocal microscope (Zeiss, 400× magnification, red/green, 1-μm-thick optical sections). ImageJ was used to assess neuronal colocalization of vGAT (green) and mCherry (red).
Mapping of AAV injection sites
We used mCherry immunostaining and dark-field images to map injection sites to standard brain atlas levels (Franklin and Paxinos, 2008). Injections were considered successful if they met inclusion criteria: >85% of the mCherry neurons were within the bounds of the CeA and the injections had to include the CeL. In Experiment 1, we bilaterally microinjected AAV-hM3-mCherry into the CeA of 30 vGATcre/OXKO mice. We excluded 14 mice because their injection sites did not meet the anatomic criteria in either CeA, and we excluded two more mice because their head stages failed before completing the experiments. Some of these injections hit the CeA on only one side, but CNO had identical effects in mice with unilateral (n = 6) or bilateral (n = 8) injections; we present these as one group in the Results. In Experiment 2, we bilaterally microinjected AAV-hM4-mCherry into the CeA of 12 vGAT-cre/OXKO mice and excluded three mice because the injections did not meet the anatomic criteria. In the 15 negative control mice injected with AAV-mCherry, the injection sites of 10 mice met anatomic criteria with bilateral expression of mCherry in the CeA.
Most injections covered the entire CeA. Some injections spread medially toward the optic tract or laterally to the intermediate fork of the external capsule, but most injections encapsulated the stria terminalis, remained ventral to the caudate/putamen, and were dorsal to the basal medial amygdala (Fig. 1). A few injections spread slightly into the BLA and parts of the globus pallidus immediately adjacent to the CeA. The rostral–caudal distribution ranged from −0.82 mm to −1.82 mm relative to bregma.
Figure 1.

AAV injections in the CeA. Injection sites for AAV-hM3-mCherry (6 unilateral and 8 bilateral) and AAV-hM4-mCherry (9 bilateral) were mapped to template drawings (−1.04 to −1.4 mm from bregma). Dark blue represents 1 injection site, and red represents 14 injection sites for hM3 and 9 sites for hM4. CeL, Central lateral amygdala; CeM, central medial amygdala; CeC, capsular subdivision; fx, fornix; ic, internal capsule; opt, optic tract; st, stria terminalis, 3v, third ventricle. Scale bar, 1 mm.
Statistical analysis
In each experiment, we used a two-way, repeated-measures, fixed effects ANOVA (treatment × experimental condition), followed by post hoc t tests with Bonferroni corrections for detection of differences within the experimental (AAV-hM3-mCherry or AAV-hM4-mCherry) and control (AAV-mCherry) groups. For each state (wake, NREM sleep, REM sleep, and cataplexy), we compared the total amount, bout duration, and number of bouts. Statistical analyses were performed using StatPlus (version 5.7.8) with a two-tailed α value of p < 0.05. ANOVA results are listed in Tables 1, 2, and 3 as (F(degrees of freedom, residual), p-value, and Bonferroni corrections t(degrees of freedom) p-value). Data are presented as mean ± SEM.
Table 1.
Effects of hM3 chemogenetic activation with regular chow, chocolate, and running wheels
| hM3 0–3 h | Chow |
Chocolate |
Running wheel |
Two-way ANOVA (condition * treatment) | ||||
|---|---|---|---|---|---|---|---|---|
| Saline | CNO | Saline | CNO | Saline | CNO | |||
| Wake | % time | 65 ± 3 | 65 ± 3 | 82 ± 2 | 75 ± 3 | 71 ± 6 | 66 ± 7 | F(2,66) = 0.63, p = 0.53 |
| t(13) = 3.8, p = 0.001a | F(2,66) = 9, p = 0.0004 | |||||||
| F(1,66) = 1.38, p = 0.25 | ||||||||
| Bout duration (s) | 255 ± 30 | 210 ± 23 | 331 ± 50 | 215 ± 19* | 285 ± 81 | 209 ± 42 | F(2,68) = 0.7, 0.5 | |
| t(13) = 2.54, p = 0.013 | F(2,68) = 0.875, 0.42 | |||||||
| F(1,68) = 7.7, 0.007 | ||||||||
| Bout number | 34 ± 3 | 40 ± 3 | 35 ± 3 | 43 ± 2 | 38 ± 6 | 39 ± 5 | F(2,68) = 0.22, p = 0.805 | |
| F(2,68) = 0.2, p = 0.819 | ||||||||
| F(1,68) = 5.1, p = 0.027 | ||||||||
| NREM sleep | % time | 29 ± 3 | 26 ± 3 | 8 ± 2a | 14 ± 4b | 23 ± 6 | 27 ± 8 | F(2,66) = 0.76, p = 0.4735 |
| t(13) = 4.4, p = 0.0001 | t(13) = 2.7, p = 0.025 | F(2,66) = 12.87, p = 0.0 | ||||||
| F(1,66) = 0.47, p = 0.49 | ||||||||
| Bout duration (s) | 117 ± 13 | 129 ± 18 | 63 ± 8a | 79 ± 12b | 94 ± 13 | 97 ± 22 | F(2,65) = 0.099, p = 0.91 | |
| t(13) = 3.0, p = 0.01 | t(13) = 2.67, p = 0.028 | F(2,65) = 8.56, p = 0.0005 | ||||||
| F(1,65) = 0.97, p = 0.33 | ||||||||
| Bout number | 29 ± 3 | 27 ± 4 | 12 ± 3a | 17 ± 4 | 27 ± 8 | 27 ± 6 | F(2,68) = 0.47, p = 0.63 | |
| t(13) = 3.2, p = 0.006 | F(2,68) = 7.3, p = 0.00135 | |||||||
| F(1,68) = 0.57, p = 0.452 | ||||||||
| REM sleep | % time | 4 ± 0.5 | 3 ± 0.6 | 1.8 ± 0.4 | 1.8 ± 0.6b | 1.6 ± 0.7 | 2.2 ± 0.5 | F(2,66) = 25.1, p = 0.0 |
| t(13) = 8.8, p = 2.4E-12 | F(2,66) = 22.9, p = 0.0 | |||||||
| F(1,66) = 30.7, p = 0.0 | ||||||||
| Bout duration (s) | 70 ± 5 | 68 ± 7 | 64 ± 9 | 74 ± 13 | 45 ± 11 | 51 ± 10 | F(2,60) = 0.25, p = 0.78 | |
| F(2,60) = 1.66, p = 0.2 | ||||||||
| F(1,60) = 0.34, p = 0.56 | ||||||||
| Bout number | 7 ± 1 | 6 ± 1 | 3 ± 1a | 3 ± 2 | 5 ± 2 | 5.5 ± 2 | F(2,68) = 0.44, p = 0.65 | |
| t(13) = 2.7, p = 0.03 | F(2,68) = 4.8, p = 0.01 | |||||||
| F(1,68) = 0.055, p = 0.82 | ||||||||
| Cataplexy | % time | 2.3 ± 0.5 | 5 ± 1* | 8.2 ± 1.0a | 9.3 ± 1.1b | 4.5 ± 0.8a,c | 4.3 ± 1.0d | F(2,64) = 0.54, p = 0.58 |
| t(13) = 2.35, p = 0.02 | t(13) = 4.9, p = 0.2E-4 | t(13) = 3.5, p = 0.004 | t(7) = 3.0, p = 0.04 | t(7) = 2.6, p = 0.038 | F(2,64) = 18.9, p = 0.0 | |||
| t(7) = 2.8, p = 0.02 | F(1,64) = 6.07, p = 0.016 | |||||||
| as % of wake | 3 ± 1 | 7 ± 1* | 9 ± 1a | 10 ± 1 | 6 ± 0.6c | 6 ± 1.3 | F(2,68) = 0.81, p = 0.449 | |
| t(13) = 2.95, p = 0.004 | t(13) = 4.63, p = 0.5E-4 | t(7) = 3.2, p = 0.006 | F(2,68) = 15.62, p = 0.0 | |||||
| F(1,68) = 11.03, p = 0.00145 | ||||||||
| Bout duration (s) | 50 ± 5 | 49 ± 5 | 42 ± 3 | 44 ± 3 | 55 ± 10 | 42 ± 2 | F(2,67) = 0.95, p = 0.4 | |
| F(2,67) = 0.81, p = 0.45 | ||||||||
| F(1,67) = 0.4, p = 0.52 | ||||||||
| Bout number | 5 ± 1 | 12 ± 2* | 22 ± 3a | 23 ± 3b | 11 ± 3c | 11 ± 2d | F(2,68) = 1.13, p = 0.33 | |
| t(13) = 2.2, p = 0.03 | t(13) = 5.3, p = 3.4E-6 | t(13) = 3.75, p = 0.001 | t(7) = 2.7, p = 0.03 | t(7) = 3.2, p = 0.0054 | F(2,68) = 21.7, p = 0.0 | |||
| F(1,68) = 2.97, p = 0.09 | ||||||||
| Amount consumed in 24 h | Chow (g) | 4 ± 0.3 | 4.3 ± 0.3 | 1.7 ± 0.3a | 2.1 ± 0.3b | F(1,52) = 0.83, p = 0.37 | ||
| t(13) = 8.05, p = 0.0 | t(13) = 8.7, p = 0.0 | F(1,52) = 103.5, p = 0.0 | ||||||
| F(1,52) = 0.36, p = 0.55 | ||||||||
| Chocolate (g) | 2.9 ± 0.1 | 2.9 ± 0.1 | F(1,26) = 0.34, p = 0.563 | |||||
| — | ||||||||
| F(1,26) = 0.34, p = 0.563 | ||||||||
| Running wheel revolutions in first 3 h | 547 ± 180 | 482 ± 131 | F(1,12) = 0.07, p = 0.802 | |||||
| — | ||||||||
| F(1,12) = 0.07, p = 0.802 | ||||||||
Values show means ± SEM across the 3 h period after saline or CNO. Bonferroni post hoc testing:
*p < 0.05 versus saline;
ap < 0.05 versus chow–saline;
bp < 0.05 versus chow–CNO;
cp < 0.05 versus chocolate–saline;
dp < 0.05 versus chocolate–CNO. The order of F values is: Condition × Treatment, Condition, and Treatment.
Table 2.
Effects of hM4 chemogenetic inhibition with regular chow, chocolate, and running wheels
| hM4 0–3 h | Chow |
Chocolate |
Running wheel |
Two-way ANOVA (condition * treatment) | ||||
|---|---|---|---|---|---|---|---|---|
| Saline | CNO | Saline | CNO | Saline | CNO | |||
| Wake | % time | 67 ± 2 | 66 ± 3 | 81 ± 2.4a | 73 ± 4.8 | 81.3 ± 3.1a | 68 ± 4.5* | F(2,45) = 1.64, p = 0.2 |
| t(8) = 3.0, p = 0.015 | t(7) = 3.0, p = 0.013 | t(7) = 2.6, p = 0.012 | F(2,45) = 5.4, p = 0.008 | |||||
| F(1,45) = 6.3, p = 0.016 | ||||||||
| Bout duration (s) | 189 ± 22 | 195 ± 21 | 239 ± 21 | 234 ± 38 | 335 ± 114 | 206 ± 25 | F(2,45) = 1.1, p = 0.35 | |
| F(2,45) = 1.3, p = 0.3 | ||||||||
| F(1,45) = 0.995, p = 0.32 | ||||||||
| Bout number | 44 ± 4 | 43 ± 2.5 | 40 ± 3 | 40 ± 4 | 41 ± 3.5 | 40 ± 3 | F(2,45) = 0.03, p = 0.97 | |
| F(2,45) = 0.68, p = 0.51 | ||||||||
| F(1,45) = 0.14, p = 0.71 | ||||||||
| NREM sleep | % time | 25 ± 2 | 27 ± 3 | 9 ± 2a | 19 ± 5* | 13 ± 3.5a | 24 ± 4.4* | F(2,44) = 1.1, p = 0.35 |
| t(8) = 3.5, p = 0.003 | t(8) = 2.02, p = 0.048 | t(7) = 2.5, p = 0.044 | t(7) = 2.2, p = 0.033 | F(2,44) = 6.8, p = 0.0026 | ||||
| F(1,44) = 6.8, p = 0.012 | ||||||||
| Bout duration (s) | 72 ± 4.5 | 73 ± 6.5 | 47 ± 5.5 | 58.2 ± 5.9 | 57 ± 8 | 76 ± 13 | F(2,45) = 0.63, p = 0.54 | |
| F(2,45) = 3.9, p = 0.03 | ||||||||
| F(1,45) = 3.0, p = 0.09 | ||||||||
| Bout number | 38 ± 3.5 | 39 ± 3 | 19 ± 4a | 32 ± 7 | 19 ± 4.5a | 31 ± 4.5 | F(2,45) = 1.14, p = 0.33 | |
| t(8) = 3.1, p = 0.01 | t(7) = 3.1, p = 0.01 | F(2,45) = 6.2, p = 0.004 | ||||||
| F(1,45) = 5.3, p = 0.026 | ||||||||
| REM sleep | % time | 5.5 ± 1 | 5.5 ± 1 | 2 ± 1a | 4.5 ± 1 | 1.1 ± 0.5a | 4 ± 1.2* | F(2,45) = 1.5, p = 0.23 |
| t(8) = 2.7, p = 0.03 | t(7) = 3.4, p = 0.004 | t(7) = 2.3, p = 0.025 | F(2,45) = 5.72, p = 0.006 | |||||
| F(1,45) = 5.83, p = 0.02 | ||||||||
| Bout duration (s) | 70 ± 12 | 75 ± 9 | 52 ± 10 | 66 ± 10 | 34.3 ± 8.4 | 63 ± 10 | F(2,39) = 0.9, p = 0.4 | |
| F(2,39) = 2.5, p = 0.09 | ||||||||
| F(1,39) = 2.8, p = 0.1 | ||||||||
| Bout number | 11 ± 2 | 9 ± 2 | 5 ± 2 | 8 ± 2 | 3 ± 1a | 7 ± 3 | F(2,45) = 1.3, p = 0.29 | |
| t(7) = 2.8, p = 0.02 | F(2,45) = 3.2, p = 0.0499 | |||||||
| F(1,45) = 0.977, p = 0.33 | ||||||||
| Cataplexy | % time | 2.5 ± 1 | 1.5 ± 0.5 | 8 ± 1a | 3.8 ± 2* | 6.5 ± 1a | 3.7 ± 1.1 | F(2,45) = 0.75, p = 0.48 |
| t(8) = 3.5, p = 0.003 | t(8) = 2.6, p = 0.012 | t(7) = 2.5, p = 0.046 | F(2,45) = 7.4, p = 0.0017 | |||||
| F(1,45) = 8.6, p = 0.0052 | ||||||||
| as % of wake | 3.6 ± 1 | 2 ± 0.6 | 9 ± 1a | 4.4 ± 2* | 7.2 ± 1 | 4.6 ± 1.2 | F(2,45) = 0.58, p = 0.57 | |
| t(8) = 3.2, p = 0.007 | t(8) = 2.7, p = 0.01 | F(2,45) = 6.3, p = 0.004 | ||||||
| F(1,45) = 9.3, p = 0.0038 | ||||||||
| Bout duration (s) | 47 ± 6 | 53 ± 12 | 45 ± 3 | 57 ± 8 | 37 ± 3.4 | 40 ± 6 | F(2,40) = 0.33, p = 0.72 | |
| F(2,40) = 2.1, p = 0.14 | ||||||||
| F(1,40) = 1.43, p = 0.24 | ||||||||
| Bout number | 6.4 ± 2 | 3.3 ± 1 | 19 ± 3a | 8 ± 4.5* | 17 ± 2a | 9 ± 2* | F(2,45) = 1.16, p = 0.3 | |
| t(8) = 3.7, p = 0.002 | t(8) = 3.2, p = 0.003 | t(7) = 2.85, p = 0.019 | t(7) = 2.1, p = 0.042 | F(2,45) = 7.68, p = 0.0014 | ||||
| F(1,45) = 12.8, p = 0.0008 | ||||||||
| Amount consumed in 24 h | Chow (g) | 3.5 ± 0.5 | 4.1 ± 0.8 | 1.6 ± 0.6a | 1.0 ± 0.4b | F(1,31) = 1.0, p = 0.32 | ||
| t(8) = 3.1, p = 0.015 | t(8) = 2.9, p = 0.024 | F(1,31) = 15.6, p = 0.0004 | ||||||
| F(1,31) = 0.0098, p = 0.92 | ||||||||
| Chocolate (g) | 2.5 ± 0.1 | 2.3 ± 0.1 | F(1,15) = 0.66, p = 0.431 | |||||
| — | ||||||||
| F(1,15) = 0.66, p = 0.431 | ||||||||
| Running wheel revolutions in first 3 h | 409 ± 102 | 307 ± 100 | F(1,15) = 0.52, p = 0.481 | |||||
| — | ||||||||
| F(1,15) = 0.52, p = 0.481 | ||||||||
Values show means ± SEM across the 3 h period after saline or CNO. Bonferroni post hoc testing:
*p < 0.05 versus saline;
ap < 0.05 versus chow–saline;
bp < 0.05 versus chow–CNO.
Table 3.
Effects of CNO in mCherry control mice with regular chow, chocolate, and running wheels
| mCherry control 0 to 3 h | Chow |
Chocolate |
Running wheel |
Two-way ANOVA (condition * treatment) | ||||
|---|---|---|---|---|---|---|---|---|
| Saline | CNO | Saline | CNO | Saline | CNO | |||
| Wake | % time | 66 ± 4 | 65 ± 3 | 80 ± 3a | 79 ± 3.2b | 71.4 ± 4.4 | 71 ± 4 | F(2,50) = 0.002, p = 0.99 |
| t(9) = 2.6, p = 0.033 | t(9) = 2.7, p = 0.28 | F(2,50) = 7.15, p = 0.002 | ||||||
| F(1,50) = 0.08, p = 0.78 | ||||||||
| Bout duration (s) | 246 ± 64 | 163 ± 16 | 277 ± 32 | 290 ± 48 | 226 ± 33 | 178 ± 18 | F(2,50) = 0.75, p = 0.48 | |
| F(2,50) = 2.7, p = 0.08 | ||||||||
| F(1,50) = 1.6, p = 0.22 | ||||||||
| Bout number | 39 ± 4 | 48 ± 3 | 36 ± 3 | 37 ± 2.3 | 41 ± 4 | 47 ± 3 | F(2,50) = 0.83, p = 0.44 | |
| F(2,50) = 3.2, p = 0.05 | ||||||||
| F(1,50) = 4.2, p = 0.046 | ||||||||
| NREM sleep | % time | 28 ± 4 | 28 ± 3 | 11 ± 3a | 11.4 ± 3.1b | 20.5 ± 4.6 | 21 ± 4 | F(2,50) = 0.0017, p = 0.99 |
| t(9) = 3.1, p = 0.009 | t(9) = 3.1, p = 0.008 | F(2,50) = 9.76, p = 0.0003 | ||||||
| F(1,50) = 0.015, p = 0.90 | ||||||||
| Bout duration (s) | 94 ± 10 | 71 ± 7 | 56 ± 8.5 | 62 ± 11.3 | 101 ± 31 | 72 ± 13 | F(2,50) = 0.74, p = 0.48 | |
| F(2,50) = 1.9, p = 0.16 | ||||||||
| F(1,50) = 1.6, p = 0.21 | ||||||||
| Bout number | 34 ± 4.5 | 43 ± 3.5 | 19 ± 5a | 19 ± 4b | 23 ± 4 | 30 ± 3b | F(2,50) = 0.72, p = 0.49 | |
| t(9) = 3.6, p = 0.002 | t(9) = 5.2, p = 0.86E-5 | t(9) = 2.7, p = 0.03 | F(2,50) = 19.4, p = 0.0 | |||||
| F(1,50) = 3.6, p = 0.065 | ||||||||
| REM sleep | % time | 4.4 ± 0.6 | 5.5 ± 1 | 2 ± 1 | 2.5 ± 1b | 1.3 ± 0.5a | 2 ± 0.5 | F(2,50) = 0.2, p = 0.82 |
| t(9) = 3.8, p = 0.0012 | t(9) = 3.0, p = 0.011 | F(2,50) = 13, p = 0.3E-4 | ||||||
| F(1,50) = 1.2, p = 0.28 | ||||||||
| Bout duration (s) | 77 ± 8 | 60 ± 8 | 63 ± 13 | 59.4 ± 8 | 59 ± 10 | 41 ± 8 | F(2,44) = 0.25, p = 0.78 | |
| F(2,44) = 2.1, p = 0.13 | ||||||||
| F(1,44) = 3.2, p = 0.078 | ||||||||
| Bout number | 7 ± 1 | 10.6 ± 2 | 3 ± 1 | 5 ± 1.6b | 2.4 ± 0.8a | 4 ± 1b | F(2,50) = 0.3, p = 0.73 | |
| t(9) = 3.1, p = 0.009 | t(9) = 2.6, p = 0.036 | t(9) = 3.7, p = 0.002 | F(2,50) = 11.75, p = 0.7E-4 | |||||
| F(1,50) = 4.0, p = 0.05 | ||||||||
| Cataplexy | % time | 2 ± 0.5 | 1.7 ± 0.6 | 7 ± 1a | 8 ± 1.3b | 6.7 ± 1.2a | 6.4 ± 1.3b | F(2,50) = 0.34, p = 0.7 |
| t(9) = 3.6, p = 0.0025 | t(9) = 4.6, p = 0.8E-4 | t(9) = 3.4, p = 0.0044 | t(9) = 3.5, p = 0.004 | F(2,50) = 19.36, p = 0.6E-6 | ||||
| F(1,50) = 0.018, p = 0.9 | ||||||||
| as % of wake | 3 ± 0.5 | 2.4 ± 0.7 | 8 ± 1a | 8 ± 1.0b | 8.4 ± 1.3a | 8 ± 1.5b | F(2,50) = 0.1, p = 0.9 | |
| t(9) = 3.5, p = 0.003 | t(9) = 4.1, p = 0.0004 | t(9) = 3.8, p = 0.001 | t(9) = 4.1, p = 0.0004 | F(2,50) = 20.4, p = 0.E-63 | ||||
| F(1,50) = 0.047, p = 0.83 | ||||||||
| Bout duration (s) | 46 ± 8 | 60 ± 10.5 | 53 ± 5 | 54 ± 4.5 | 50 ± 4 | 45 ± 4 | F(2,46) = 1.06, p = 0.36 | |
| F(2,46) = 0.5, p = 0.6 | ||||||||
| F(1,46) = 0.4, p = 0.52 | ||||||||
| Bout number | 4 ± 1 | 3.5 ± 1 | 16 ± 2a | 16.6 ± 3.3b | 16 ± 3a | 16 ± 3b | F(2,50) = 0.01, p = 0.99 | |
| t(9) = 3.4, p = 0.0035 | t(9) = 3.6, p = 0.002 | t(9) = 2.7, p = 0.03 | t(9) = 2.87, p = 0.018 | F(2,50) = 14.0, p = 0.00 | ||||
| F(1,50) = 0.013, p = 0.91 | ||||||||
| Amount consumed in 24 h | Chow (g) | 3 ± 1 | 2.5 ± 1 | 1 ± 0.4 | 1.6 ± 0.3 | F(2,37) = 0.66, p = 0.42 | ||
| F(1,37) = 4.72, p = 0.037 | ||||||||
| F(1,37) = 0.01, p = 0.92 | ||||||||
| Chocolate (g) | 2.7 ± 0.2 | 2.4 ± 0.2 | F(1,18) = 1.48, p = 0.24 | |||||
| — | ||||||||
| F(1,18) = 1.48, p = 0.24 | ||||||||
| Running wheel revolutions in first 3 h | 499 ± 132 | 408 ± 120 | F(1,18) = 0.26, p = 0.613 | |||||
| — | ||||||||
| F(1,18) = 0.26, p = 0.613 | ||||||||
Values show means ± SEM across the three hour period after saline or CNO. Bonferroni post hoc testing:
a, p < 0.05 versus chow-saline;
b, p < 0.05 versus chow-CNO
Results
Validation of hM3 expression in vGAT neurons
Expression of the hM3 (n = 2) and hM4 (n = 1) receptors was limited to neurons containing vGAT mRNA. Specifically, of the 109 ± 12 neurons per CeA expressing mCherry, 108 ± 11 also expressed vGAT mRNA (Fig. 2A–D). Transduction efficiency was moderate (45 ± 19% of the 434 ± 266 vGAT+ neurons expressed mCherry).
Figure 2.
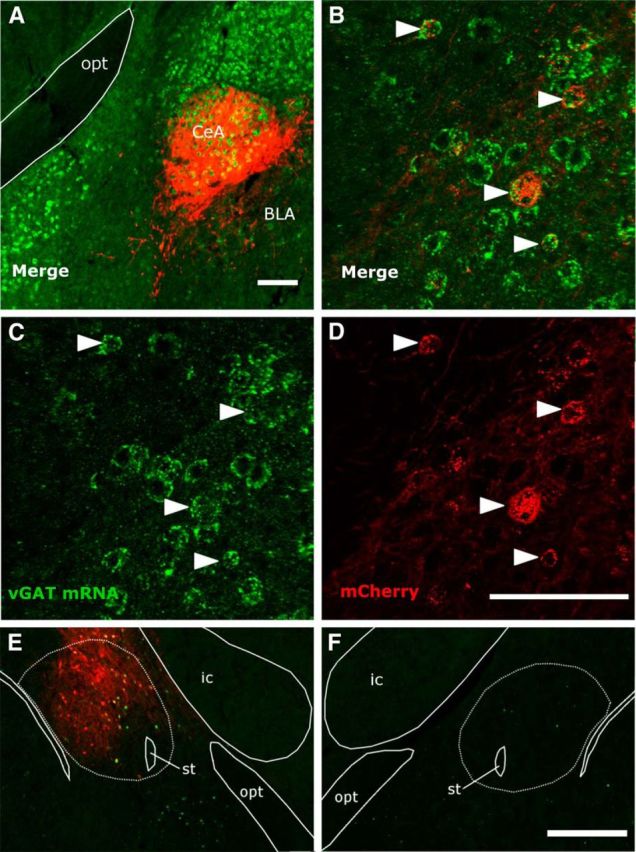
hM3 DREADD receptor (fused to mCherry) is expressed in GABAergic neurons of the CeA and increases expression of Fos. A–D, FISH labels vGAT mRNA green and immunostaining labels mCherry red in a vGAT-cre/OXKO mouse injected with AAV-hM3-mCherry. E, F, In an OXKO mouse unilaterally injected with AAV-hM3-mCherry (red), CNO increased the number of Fos+ (green) neurons in the ipsilateral CeA, but Fos was uncommon in the contralateral CeA. Scale bars, 0.1 mm for A-D and 1.0 mm for E, F.
Neuronal activation with CNO
Fos expression in hM3-expressing neurons
To test whether CNO activates GABAergic CeA neurons expressing hM3, we examined the pattern of Fos expression after CNO in vGAT-cre/OXKO mice (n = 3) unilaterally injected with AAV-hM3-mCherry. The CeA injected with AAV-hM3-mCherry contained 90 ± 11 Fos+ neurons compared with only 7 ± 6 in the contralateral, uninjected CeA (Fig. 2E,F). In addition, 68 ± 17% of the 67 ± 5 mCherry+ neurons contained Fos, and 78 ± 14% of Fos+ neurons contained mCherry. This demonstrates that CNO strongly activates GABAergic CeA neurons expressing hM3.
Fos expression across conditions
To compare Fos expression across conditions in mice bilaterally injected with AAV-hM3-mCherry, we perfused mice 2 h after injection of saline (n = 4), injection of CNO 0.3 mg/kg (n = 4), or access to chocolate (n = 4) and then counted Fos+ neurons in the CeA. Saline injected mice had few Fos+ neurons in the CeA (27 ± 4), CNO-injected mice had many (79 ± 8), and mice with access to chocolate had even more (97 ± 5) (F(2,30) = 36.8, p = 0.0). Pairwise comparisons showed more Fos+ cells in the CeA of mice injected with CNO than with saline (t(20) = −5.8, p = 0.0). Mice with access to chocolate had more Fos+ neurons than those injected with saline (t(20)= −10.5, p = 0.0) and slightly more than mice that received CNO (t(20) = −1.87, p = 0.07). This analysis indicates that both hM3 signaling and chocolate activate CeA neurons.
Experiment 1: Chemogenetic activation of GABAergic CeA neurons
Chow condition
The CeA has been implicated in the control of REM sleep (Smith and Miskiman, 1975; Sanford et al., 2002; Xi et al., 2012), so we first tested whether activation of GABAergic CeA neurons alters sleep/wake architecture in vGAT-cre/OXKO mice fed normal chow ad libitum. In mice expressing hM3 receptors in GABAergic neurons of the CeA (n = 14), CNO (0.3 mg/kg, 15 min before lights off) had no effect on basic sleep architecture. Specifically, the amounts of wake, NREM sleep, and REM sleep in the first 3 h after injection were similar to those seen with saline (Table 1). The number and duration of bouts of wake, NREM sleep, and REM sleep were also similar after CNO and saline injection. Mice consumed a similar amount of chow after saline.
In contrast, CNO substantially increased cataplexy (Fig. 3, Table 1). Injection of CNO more than doubled the number of cataplexy bouts compared with saline across the first 3 h after injection (t(13) = 2.2, p = 0.03). CNO also doubled the time spent in cataplexy (t(13) = 2.35, p = 0.02) even after normalizing for the amount of wake (t(13) = 2.95, p = 0.004). CNO did not alter the duration of cataplexy bouts.
Figure 3.

Effects of CNO on cataplexy across experiments. Chemoactivation of GABAergic CeA neurons increased the number of cataplexy bouts and the total amount of cataplexy in the 3 h after CNO with regular chow, but not under rewarding conditions. Chemoinhibition reduced cataplexy in the chocolate and running wheel conditions. CNO had no effect on cataplexy in negative control mice expressing just mCherry. *p < 0.05 versus saline; **p < 0.01 versus saline.
Chocolate condition
Prior studies have shown that chocolate substantially increases cataplexy in OXKO mice (Burgess et al., 2013; Oishi et al., 2013). To determine whether chemogenetic activation of CeA neurons enhances this response, we gave mice injected with AAV-hM3-mCherry access to chocolate and treated them with CNO or saline. Compared with the baseline regular chow condition, chocolate increased the total amount of cataplexy and the number of cataplexy bouts ∼3- to 4-fold in saline-treated mice (Table 1, t(13) = 4.9, p = 0.00002 and t(13) = 5.3, p = 3.4 × 10⁻⁶, respectively). Chocolate also mildly increased wake (t(13) = 3.8, p = 0.001), mainly at the expense of NREM sleep (total amount of NREM t(13) = 4.4, p = 0.0001, NREM duration t(13) = 3.0, p = 0.01 and NREM bouts t(13) = 3.2, p = 0.006). Mice consumed similar amounts of chocolate and chow after saline and CNO. Mice ate less chow under the chocolate condition than under the chow-only condition (t(13) = 8.05, p = 0.0 after saline and t(13) = 8.7, p = 0.0 after CNO).
In mice with access to chocolate, CNO did not significantly increase the amount of cataplexy or the number of cataplexy bouts beyond the high level already seen with saline (Fig. 3).
Running wheel condition
Prior studies have shown that access to a running wheel moderately increases cataplexy in OXKO mice (España et al., 2007; Burgess et al., 2013). To determine whether chemogenetic activation of CeA neurons enhances this response, we gave mice injected with AAV-hM3-mCherry (n = 8) access to running wheels and treated them with CNO or saline. Compared with the baseline chow condition, running wheels increased cataplexy in AAV-hM3-mCherry-injected mice treated with saline (Table 1). Specifically, running wheels approximately doubled the total amount of cataplexy under saline treatment (t(7) = 3.0, p = 0.04) and the number of cataplexy bouts (t(7) = 2.7, p = 0.03) compared with chow.
CNO did not alter the amounts or number of bouts of wake, NREM sleep, and REM sleep. The amounts of running were similar after saline and CNO. Treatment with CNO did not increase cataplexy beyond that seen with running wheels plus saline.
Experiment 2: Chemogenetic inhibition of GABAergic CeA neurons
Chow condition
To test whether GABAergic CeA neurons are necessary for cataplexy, we bilaterally injected the CeA of vGAT-cre/OXKO mice with AAV-hM4-mCherry, resulting in mCherry expression throughout the CeA with slight extension into the BLA (Fig. 1). In mice with bilateral hM4 expression in the CeA (n = 9), CNO had no effect on basic sleep architecture when mice were fed regular chow (Table 2). Mice consumed a similar amount of chow after saline and CNO. CNO did not significantly reduce the amount of cataplexy or the number of cataplexy bouts (Fig. 3).
Chocolate condition
To determine whether GABAergic CeA neurons are necessary for the increase of cataplexy in the presence of chocolate, we tested whether inhibition of GABAergic CeA neurons reduced cataplexy in mice with access to chocolate. Compared with the regular chow condition, chocolate approximately tripled the total amount of cataplexy and the number of cataplexy bouts in saline-treated mice (Table 2, t(8) = 3.5, p = 0.003 and t(8) = 3.7, p = 0.002, respectively). As in Experiment 1, chocolate increased wake ∼21% (t(8) = 3.0, p = 0.015), mainly at the expense of NREM sleep (t(8) = 3.5, p = 0.003). Mice consumed similar amounts of chocolate and chow after saline and CNO.
Treatment with CNO reduced the amount of cataplexy by ∼50% (t(8) = 2.6, p = 0.012), after normalizing for the amount of wake (t(8) = 2.7, p = 0.01) and decreased the number of cataplexy bouts by 60% (t(8) = 3.2, p = 0.003; Fig. 3). The duration of cataplexy bouts was similar after CNO and saline injections. These results suggest that inhibition of GABAergic CeA neurons reduces the high levels of cataplexy seen with chocolate, mainly by decreasing the number of cataplexy bouts.
Running wheel condition
To determine whether CeA neurons are necessary for the high levels of cataplexy in the presence of a running wheel, we tested whether inhibition of GABAergic CeA neurons reduces cataplexy in mice with access to running wheels. Compared with the baseline chow condition, running wheels increased cataplexy ∼2.6-fold in AAV-hM4-mCherry-injected mice treated with saline (n = 8) (Table 2). Specifically, running wheels increased the total amount of cataplexy (t(7) = 2.5, p = 0.046) and the number of cataplexy bouts (t(7) = 2.85, p = 0.019) compared with chow. Running wheels also moderately reduced the amount of REM sleep compared with the baseline condition (t(7) = 3.4, p = 0.004).
CNO decreased cataplexy bouts almost 50% compared with saline (t(7) = 2.1, p = 0.042). The amount of cataplexy was reduced similarly, but the difference was not statistically significant. CNO mildly increased the amounts of NREM and REM sleep at the expense of wake, but the amounts of running were unchanged.
Experiment 3: Control mice injected with AAV-mCherry
To test whether changes in cataplexy or sleep architecture were nonspecific responses to CNO, we studied the effects of CNO in negative control mice with bilateral injections of AAV-mCherry into the CeA (n = 10). When fed regular chow, CNO did not alter wake, NREM sleep, REM sleep, or cataplexy compared with saline (Table 3). Mice consumed a similar amount of chow after saline and CNO. When given chocolate or access to running wheels, control mice had more wake and cataplexy as in Experiments 1 and 2, but CNO did not alter cataplexy, sleep architecture, consumption of chocolate and chow, or the amounts of wheel running. These control experiments demonstrate that, across all three conditions, the effects of CNO on cataplexy in Experiments 1 and 2 are mediated by the hM3 and hM4 receptors, respectively.
Discussion
These studies demonstrate that activation of GABAergic CeA neurons increases cataplexy in OXKO mice under chow conditions and inhibition of these neurons reduces the high levels of cataplexy seen with chocolate and running wheels. It is unlikely that these changes in cataplexy are due to nonspecific changes in wake, NREM sleep, or REM sleep because, in general, hM3 and hM4 signaling had little effect on sleep/wake architecture. In addition, these behavioral effects were mediated by the hM3 and hM4 receptors because CNO had no effect in control mice injected with AAV-mCherry. Considered together, these experiments demonstrate that GABAergic CeA neurons are sufficient to increase cataplexy under basal conditions and are necessary for cataplexy under rewarding conditions.
Role of the amygdala in positive affect and cataplexy
The amygdala plays a major role in regulating emotional responses to both positive and negative stimuli. In brief, the amygdala receives salient sensory stimuli, processes these by intranuclear and internuclear projections, and produces appropriate behavioral responses mainly via projections from the CeA (Swanson and Petrovich, 1998; Duvarci and Pare, 2014; Janak and Tye, 2015; Namburi et al., 2015). Much amygdala research focuses on negative emotions such as fear and anxiety, but the amygdala also regulates emotional responses to positive stimuli (Holland and Gallagher, 1999; Gulyani et al., 2002; Paton et al., 2006; Tye et al., 2008). For example, amygdala activity increases in people viewing photos of happy faces (Canli et al., 2002; Killgore and Yurgelun-Todd, 2004; Williams et al., 2005; Sergerie et al., 2008; but see Straube et al., 2008). In monkeys, amygdala neurons fire faster when presented with stimuli of positive affective value (Paton et al., 2006; Belova et al., 2007; Zhang et al., 2013). Similar increases in amygdala activity to both positive and aversive stimuli are best explained by the intermingling of distinct neuronal populations with specific connectivity (Shabel and Janak, 2009; Janak and Tye, 2015; Namburi et al., 2015). For example, Namburi et al. (2015) recently showed that inhibition of BLA neurons that target the CeM enhances reward conditioning and impairs fear conditioning, whereas activation of BLA neurons that target the nucleus accumbens increases nose-poke behavior for intracranial self-stimulation but do not affect freezing behavior. These responses to opposing valences may be processed by specific amygdala pathways that reciprocally inhibit one another; specifically, positive affect mechanisms may inhibit anxiety-producing or fear-processing circuits (Namburi et al., 2015).
The findings that chemogenetic activation of CeA neurons increases cataplexy and inhibition decreases cataplexy build on a growing body of evidence that the amygdala mediates positive affect and is a crucial element in the neural circuitry of cataplexy. In OXKO mice, chocolate induces Fos expression in BLA neurons in proportion to the amount of cataplexy and lesions of the amygdala reduce cataplexy across a variety of conditions (Burgess et al., 2013; Oishi et al., 2013). In narcoleptic dogs, some CeA and BLA neurons fire faster during cataplexy (Gulyani et al., 2002) and, in children with narcolepsy, amygdala activity is increased during cataplexy, as shown by functional imaging (Meletti et al., 2015). Therefore, studies focused on gain of function, loss of function, and spontaneous activity collectively demonstrate that the amygdala is essential for the production of cataplexy.
Considering the role of the CeA in positive affect, we anticipated that activation of GABAergic CeA neurons would further increase cataplexy in mice exposed to running wheels and chocolate. As shown in prior studies, we find that running wheels and chocolate increase cataplexy, but CNO does not produce additional increases in cataplexy. Chemogenetic activation can be limited by many factors, including transduction efficiency and the degree of depolarization driven by hM3 signaling. We suspect that when cataplexy-promoting CeA neurons are already strongly activated by chocolate or running wheels, hM3 activation provides little additional activation. In support of this idea, the number of Fos+ neurons in the CeA with hM3 activation was less than the number of Fos+ neurons in mice with access to chocolate. Future gain-of-function experiments using techniques that substantially increase neuronal activity such as optogenetics should help to define whether the triggering of cataplexy by emotions can be further enhanced.
Which neural pathways promote cataplexy?
Many researchers hypothesize that the atonia of cataplexy is driven by engagement of the same brainstem mechanisms that are active during the atonia of REM sleep (Kiyashchenko et al., 2001; Scammell et al., 2009; Luppi et al., 2011; Peever, 2011). During REM sleep, the sublaterodorsal nucleus (SLD) in the pons activates premotor neurons in the medial medulla and spinal cord that strongly inhibit motor neurons (Boissard et al., 2002; Lu and Greco, 2006; Krenzer et al., 2011). During wakefulness, the SLD is thought to be inhibited by the locus ceruleus (LC), dorsal raphe (DR), and ventrolateral periaqueductal gray and lateral pontine tegmentum (vlPAG/LDT), regions that help maintain muscle tone and suppress REM sleep (Boissard et al., 2003; Lu and Greco, 2006).
Just how the CeA may engage these brainstem pathways remains unclear. In healthy people, heartfelt laughter can transiently reduce muscle tone, perhaps via CeA signals related to positive affect (Lammers et al., 2000). CeA neurons innervate atonia-suppressing regions including the vlPAG/LPT, DR, and LC, and the CeA likely promotes atonia by reducing activity in these target regions (Rizvi et al., 1991; Burgess et al., 2013). In addition, the CeA also lightly innervates neurons in the ventral medial medulla (Cassell et al., 1999), which may inhibit motor neurons directly. In narcolepsy, loss of orexin signaling enables positive emotions to strongly activate atonia pathways. The orexin neurons normally excite atonia-suppressing brain regions, including the vlPAG/LPT, LC, and DR, and orexin neuron activity may be especially high during positive emotions (Wu et al., 2011; Blouin and Siegel, 2013). Cataplexy is substantially reduced by restoration of orexin signaling in the DR (Hasegawa et al., 2014) or by medications that increase serotonergic and noradrenergic tone (Godbout and Montplaisir, 1986; Frey and Darbonne, 1994; Nishino and Mignot, 1997; Larrosa et al., 2001). In narcolepsy, cataplexy likely occurs when signals related to positive emotions from the CeA inhibit atonia-suppressing brain regions in the absence of orexin signaling.
Most likely, the CeA is not the only forebrain region that drives emotionally triggered cataplexy. Chemogenetic inhibition of GABAergic CeA neurons reduced cataplexy to about half its usual amount in mice given chocolate or with access to running wheels, but mice still had more bouts of cataplexy than seen in the regular chow condition. Similarly, excitotoxic lesions of the amygdala produced partial reductions in cataplexy, suggesting that other pathways are capable of producing cataplexy (Burgess et al., 2013).
We found that activation of GABAergic CeA neurons generally had little effect on REM sleep or other sleep stages, but inhibition of these cells moderately increased NREM and REM sleep under the chocolate and running wheel conditions. These observations fit well with prior work showing that lesions of the amygdala in OXKO mice reduce the hyperarousal seen with chocolate and running wheels (Burgess et al., 2013). In the presence of a rewarding stimulus, OXKO mice spend more time awake, and reduced CeA activity under rewarding stimuli may decrease the perceived valence of the stimulus, reducing the hyperarousal and enabling more NREM and REM sleep.
We found that activation or inhibition of the CeA generally had little effect on REM sleep, yet prior work suggests that the amygdala can influence REM sleep, especially with models of stress. Most likely, this lack of effect is because our research focused on rewarding stimuli, whereas most prior research on the role of the amygdala in sleep focused on stress and other negative emotions. Substantial research shows that the CeA regulates REM sleep under stressful conditions (Benca et al., 2000; Tang et al., 2005; Cano et al., 2008; Liu et al., 2009). Pharmacological inactivation of the amygdala in rats also reduces REM sleep and wake in open-field conditions (Tang et al., 2005). Furthermore, chair-restrained rhesus monkeys with bilateral lesions of the amygdala had more total sleep and REM sleep than intact controls (Benca et al., 2000). Differences in methods of amygdala lesion and types of stress (i.e., inescapable vs escapable stress) may determine whether the CeA functions to increase or decrease REM sleep. Much prior research on stress and sleep has examined behavior during the light period; however, we focused on the dark period because this is when cataplexy occurs, but we also examined hM3 activation during the light period and found no effects on sleep architecture (data not shown). In our experiments, we think that home cage conditions with little stress likely account for the lack of effects on REM sleep.
Technical considerations
These experiments highlight the importance of the CeA in cataplexy, but some methodological issues should be kept in mind. First, we assume that CNO increased or decreased the activity of GABAergic CeA neurons and, although hM3 signaling increased Fos in CeA neurons, we did not examine neuronal activity directly using electrophysiological techniques. Second, activation of CeA neurons may have been submaximal because of low transduction efficiency or low copy number, resulting in low amounts of hM3. This is unlikely to be a major concern because CNO approximately doubled the amount of cataplexy under baseline conditions. Nevertheless, methods that strongly activate greater numbers of neurons might produce more cataplexy or demonstrate an increase in cataplexy under rewarding conditions.
Future directions
These experiments demonstrate that GABAergic CeA neurons can increase cataplexy under baseline conditions and these neurons are necessary for cataplexy under rewarding conditions. In future experiments, it will be important to determine the type of GABAergic neurons mediating this response and to map the specific inputs to these neurons and their projections to brain regions that regulate muscle tone. Defining the role of the CeA in cataplexy should lead to novel targets for future cataplexy therapies. In addition, a better understanding of how the amygdala regulates positive affect should also provide new perspectives on the neurobiology of addiction and mood disorders.
Footnotes
This work was supported by the National Institutes of Health (Grants T32 AG000222 and T32 HL007901 to C.E.M. and Grant P01 HL095491 to T.E.S.) and Wake Up Narcolepsy. We appreciate statistical support from Harvard Catalyst: The Harvard Clinical and Translational Science Center, which is supported by the National Center for Research Resources and the National Center for Advancing Translational Sciences, NIH Grant UL1 TR001102, and financial contributions from Harvard University and its affiliated academic health care centers. We thank C. Burgess and D. Kroeger for critical feedback on this manuscript, A. Venner for sharing the injection site mapping script, and the animal facility staff for expert care of the mice.
The authors declare no competing financial interests.
References
- Alexander GM, Rogan SC, Abbas AI, Armbruster BN, Pei Y, Allen JA, Nonneman RJ, Hartmann J, Moy SS, Nicolelis MA, McNamara JO, Roth BL (2009) Remote control of neuronal activity in transgenic mice expressing evolved G protein-coupled receptors. Neuron 63:27–39. 10.1016/j.neuron.2009.06.014 [DOI] [PMC free article] [PubMed] [Google Scholar]
- Armbruster BN, Li X, Pausch MH, Herlitze S, Roth BL (2007) Evolving the lock to fit the key to create a family of G protein-coupled receptors potently activated by an inert ligand. Proc Natl Acad Sci U S A 104:5163–5168. 10.1073/pnas.0700293104 [DOI] [PMC free article] [PubMed] [Google Scholar]
- Belova MA, Paton JJ, Morrison SE, Salzman CD (2007) Expectation modulates neural responses to pleasant and aversive stimuli in primate amygdala. Neuron 55:970–984. 10.1016/j.neuron.2007.08.004 [DOI] [PMC free article] [PubMed] [Google Scholar]
- Benca RM, Obermeyer WH, Shelton SE, Droster J, Kalin NH (2000) Effects of amygdala lesions on sleep in rhesus monkeys. Brain Res 879:130–138. 10.1016/S0006-8993(00)02761-X [DOI] [PubMed] [Google Scholar]
- Black SW, Morairty SR, Chen TM, Leung AK, Wisor JP, Yamanaka A, Kilduff TS (2014) GABAB agonism promotes sleep and reduces cataplexy in murine narcolepsy. J Neurosci 34:6485–6494. 10.1523/JNEUROSCI.0080-14.2014 [DOI] [PMC free article] [PubMed] [Google Scholar]
- Blouin AM, Siegel JM (2013) Relation of melanin concentrating hormone levels to sleep, emotion and hypocretin levels. Sleep 36:1777. 10.5665/sleep.3194 [DOI] [PMC free article] [PubMed] [Google Scholar]
- Boissard R, Gervasoni D, Schmidt MH, Barbagli B, Fort P, Luppi PH (2002) The rat ponto-medullary network responsible for paradoxical sleep onset and maintenance: A combined microinjection and functional neuroanatomical study. Eur J Neurosci 16:1959–1973. 10.1046/j.1460-9568.2002.02257.x [DOI] [PubMed] [Google Scholar]
- Boissard R, Fort P, Gervasoni D, Barbagli B, Luppi PH (2003) Localization of the GABAergic and non-GABAergic neurons projecting to the sublaterodorsal nucleus and potentially gating paradoxical sleep onset. Eur J Neurosci 18:1627–1639. 10.1046/j.1460-9568.2003.02861.x [DOI] [PubMed] [Google Scholar]
- Burgess CR, Scammell TE (2012) Narcolepsy: Neural mechanisms of sleepiness and cataplexy. J Neurosci 32:12305–12311. 10.1523/JNEUROSCI.2630-12.2012 [DOI] [PMC free article] [PubMed] [Google Scholar]
- Burgess CR, Oishi Y, Mochizuki T, Peever JH, Scammell TE (2013) Amygdala lesions reduce cataplexy in orexin knock-out mice. J Neurosci 33:9734–9742. 10.1523/JNEUROSCI.5632-12.2013 [DOI] [PMC free article] [PubMed] [Google Scholar]
- Canli T, Sivers H, Whitfield SL, Gotlib IH, Gabrieli JD (2002) Amygdala response to happy faces as a function of extraversion. Science 296:2191. 10.1126/science.1068749 [DOI] [PubMed] [Google Scholar]
- Cano G, Mochizuki T, Saper CB (2008) Neural circuitry of stress-induced insomnia in rats. J Neurosci 28:10167–10184. 10.1523/JNEUROSCI.1809-08.2008 [DOI] [PMC free article] [PubMed] [Google Scholar]
- Cassell MD, Freedman LJ, Shi C (1999) The intrinsic organization of the central extended amygdala. Ann N Y Acad Sci 877:217–241. 10.1111/j.1749-6632.1999.tb09270.x [DOI] [PubMed] [Google Scholar]
- Chemelli RM, Willie JT, Sinton CM, Elmquist JK, Scammell T, Lee C, Richardson JA, Williams SC, Xiong Y, Kisanuki Y, Fitch TE, Nakazato M, Hammer RE, Saper CB, Yanagisawa M (1999) Narcolepsy in orexin knockout mice: molecular genetics of sleep regulation. Cell 98:437–451. 10.1016/S0092-8674(00)81973-X [DOI] [PubMed] [Google Scholar]
- Clark EL, Baumann CR, Cano G, Scammell TE, Mochizuki T (2009) Feeding-elicited cataplexy in orexin knockout mice. Neuroscience 161:970–977. 10.1016/j.neuroscience.2009.04.007 [DOI] [PMC free article] [PubMed] [Google Scholar]
- Crocker A, España RA, Papadopoulou M, Saper CB, Faraco J, Sakurai T, Honda M, Mignot E, Scammell TE (2005) Concomitant loss of dynorphin, NARP, and orexin in narcolepsy. Neurology 65:1184–1188. 10.1212/01.WNL.0000168173.71940.ab [DOI] [PMC free article] [PubMed] [Google Scholar]
- De Luca MA. (2014) Habituation of the responsiveness of mesolimbic and mesocortical dopamine transmission to taste stimuli. Front Integr Neurosci 8:21–26. 10.3389/fnint.2014.00021 [DOI] [PMC free article] [PubMed] [Google Scholar]
- Dubreucq S, Durand A, Matias I, Bénard G, Richard E, Soria-Gomez E, Glangetas C, Groc L, Wadleigh A, Massa F, Bartsch D, Marsicano G, Georges F, Chaouloff F (2013) Ventral tegmental area cannabinoid type-1 receptors control voluntary exercise performance. Biol Psychiatry 73:895–903. 10.1016/j.biopsych.2012.10.025 [DOI] [PubMed] [Google Scholar]
- Duvarci S, Pare D (2014) Amygdala microcircuits controlling learned fear. Neuron 82:966–980. 10.1016/j.neuron.2014.04.042 [DOI] [PMC free article] [PubMed] [Google Scholar]
- España RA, McCormack SL, Mochizuki T, Scammell TE (2007) Running promotes wakefulness and increases cataplexy in orexin knockout mice. Sleep 30:1417–1425. [DOI] [PMC free article] [PubMed] [Google Scholar]
- Franklin K, Paxinos G (2008) The mouse brain in stereotaxic coordinates. New York: Elsevier. [Google Scholar]
- Frey J, Darbonne C (1994) Fluoxetine suppresses human cataplexy: a pilot study. Neurology 44:707–709. 10.1212/WNL.44.4.707 [DOI] [PubMed] [Google Scholar]
- Godbout R, Montplaisir J (1986) All-day performance variations in normal and narcoleptic subjects. Sleep 9:200–204. [DOI] [PubMed] [Google Scholar]
- Gulyani S, Wu MF, Nienhuis R, John J, Siegel JM (2002) Cataplexy-related neurons in the amygdala of the narcoleptic dog. Neuroscience 112:355–365. 10.1016/S0306-4522(02)00089-1 [DOI] [PMC free article] [PubMed] [Google Scholar]
- Hara J, Beuckmann CT, Nambu T, Willie JT, Chemelli RM, Sinton CM, Sugiyama F, Yagami K, Goto K, Yanagisawa M, Sakurai T (2001) Genetic ablation of orexin neurons in mice results in narcolepsy, hypophagia, and obesity. Neuron 30:345–354. 10.1016/S0896-6273(01)00293-8 [DOI] [PubMed] [Google Scholar]
- Hasegawa E, Yanagisawa M, Sakurai T, Mieda M (2014) Orexin neurons suppress narcolepsy via 2 distinct efferent pathways. J Clin Invest 124:604–616. 10.1172/JCI71017 [DOI] [PMC free article] [PubMed] [Google Scholar]
- Holland PC, Gallagher M (1999) Amygdala circuitry in attentional and representational processes. Trends Cogn Sci 3:65–73. 10.1016/S1364-6613(98)01271-6 [DOI] [PubMed] [Google Scholar]
- Janak PH, Tye KM (2015) From circuits to behaviour in the amygdala. Nature 517:284–292. 10.1038/nature14188 [DOI] [PMC free article] [PubMed] [Google Scholar]
- Kantor S, Mochizuki T, Janisiewicz AM, Clark E, Nishino S, Scammell TE (2009) Orexin neurons are necessary for the circadian control of REM sleep. Sleep 32:1127–1134. [DOI] [PMC free article] [PubMed] [Google Scholar]
- Kantor S, Mochizuki T, Lops SN, Ko B, Clain E, Clark E, Yamamoto M, Scammell TE (2013) Orexin gene therapy restores the timing and maintenance of wakefulness in narcoleptic mice. Sleep 36:1129–1138. [DOI] [PMC free article] [PubMed] [Google Scholar]
- Killgore WD, Yurgelun-Todd DA (2004) Activation of the amygdala and anterior cingulate during nonconscious processing of sad versus happy faces. Neuroimage 21:1215–1223. 10.1016/j.neuroimage.2003.12.033 [DOI] [PubMed] [Google Scholar]
- Kiyashchenko LI, Mileykovskiy BY, Lai YY, Siegel JM (2001) Increased and decreased muscle tone with orexin (hypocretin) microinjections in the locus coeruleus and pontine inhibitory area. J Neurophysiol 85:2008–2016. [DOI] [PMC free article] [PubMed] [Google Scholar]
- Krenzer M, Anaclet C, Vetrivelan R, Wang N, Vong L, Lowell BB, Fuller PM, Lu J (2011) Brainstem and spinal cord circuitry regulating REM sleep and muscle atonia. PLoS One 6:e24998. 10.1371/journal.pone.0024998 [DOI] [PMC free article] [PubMed] [Google Scholar]
- Lammers GJ, Overeem S, Tijssen MA, van Dijk JG (2000) Effects of startle and laughter in cataplectic subjects: a neurophysiological study between attacks. Clin Neurophysiol 111:1276–1281. 10.1016/S1388-2457(00)00306-0 [DOI] [PubMed] [Google Scholar]
- Larrosa O, de la Llave Y, Bario S, Granizo JJ, Garcia-Borreguero D (2001) Stimulant and anticataplectic effects of reboxetine in patients with narcolepsy: a pilot study. Sleep 24:282–285. [DOI] [PubMed] [Google Scholar]
- Liu X, Yang L, Wellman LL, Tang X, Sanford LD (2009) GABAergic antagonism of the central nucleus of the amygdala attenuates reductions in rapid eye movement sleep after inescapable footshock stress. Sleep 32:888–896. [DOI] [PMC free article] [PubMed] [Google Scholar]
- Lu J, Greco MA (2006) Sleep circuitry and the hypnotic mechanism of GABAA drugs. J Clin Sleep Med 2:S19–S26. [PubMed] [Google Scholar]
- Luppi PH, Clément O, Sapin E, Gervasoni D, Peyron C, Léger L, Salvert D, Fort P (2011) The neuronal network responsible for paradoxical sleep and its dysfunctions causing narcolepsy and rapid eye movement (REM) behavior disorder. Sleep Med Rev 15:153–163. 10.1016/j.smrv.2010.08.002 [DOI] [PubMed] [Google Scholar]
- Meletti S, Vaudano AE, Pizza F, Ruggieri A, Vandi S, Teggi A, Franceschini C, Benuzzi F, Nichelli PF, Plazzi G (2015) The brain correlates of laugh and cataplexy in childhood narcolepsy. J Neurosci 35:11583–11594. 10.1523/JNEUROSCI.0840-15.2015 [DOI] [PMC free article] [PubMed] [Google Scholar]
- Mochizuki T, Crocker A, McCormack S, Yanagisawa M, Sakurai T, Scammell TE (2004) Behavioral state instability in orexin knock-out mice. J Neurosci 24:6291–6300. 10.1523/JNEUROSCI.0586-04.2004 [DOI] [PMC free article] [PubMed] [Google Scholar]
- Namburi P, Beyeler A, Yorozu S, Calhoon GG, Halbert SA, Wichmann R, Holden SS, Mertens KL, Anahtar M, Felix-Ortiz AC, Wickersham IR, Gray JM, Tye KM (2015) A circuit mechanism for differentiating positive and negative associations. Nature 520:675–678. 10.1038/nature14366 [DOI] [PMC free article] [PubMed] [Google Scholar]
- Nishino S, Mignot E (1997) Pharmacological aspects of human and canine narcolepsy. Prog Neurobiol 52:27–78. 10.1016/S0301-0082(96)00070-6 [DOI] [PubMed] [Google Scholar]
- Novak CM, Burghardt PR, Levine JA (2012) The use of a running wheel to measure activity in rodents: Relationship to energy balance, general activity, and reward. Neurosci Biobehav Rev 36:1001–1014. 10.1016/j.neubiorev.2011.12.012 [DOI] [PMC free article] [PubMed] [Google Scholar]
- Oishi Y, Williams RH, Agostinelli L, Arrigoni E, Fuller PM, Mochizuki T, Saper CB, Scammell TE (2013) Role of the medial prefrontal cortex in cataplexy. J Neurosci 33:9743–9751. 10.1523/JNEUROSCI.0499-13.2013 [DOI] [PMC free article] [PubMed] [Google Scholar]
- Overeem S, van Nues SJ, van der Zande WL, Donjacour CE, van Mierlo P, Lammers GJ (2011) The clinical features of cataplexy: A questionnaire study in narcolepsy patients with and without hypocretin-1 deficiency. Sleep Med 12:12–18. 10.1016/j.sleep.2010.05.010 [DOI] [PubMed] [Google Scholar]
- Paton JJ, Belova MA, Morrison SE, Salzman CD (2006) The primate amygdala represents the positive and negative value of visual stimuli during learning. Nature 439:865–870. 10.1038/nature04490 [DOI] [PMC free article] [PubMed] [Google Scholar]
- Peever J. (2011) Control of motoneuron function and muscle tone during REM sleep, REM sleep behavior disorder and cataplexy/narcolepsy. Arch Ital Biol 149:454–466. 10.4449/aib.v149i4.1257 [DOI] [PubMed] [Google Scholar]
- Peyron C, et al. (2000) A mutation in a case of early onset narcolepsy and a generalized absence of hypocretin peptides in human narcoleptic brains. Nat Med 6:991–997. 10.1038/79690 [DOI] [PubMed] [Google Scholar]
- Rizvi TA, Ennis M, Behbehani MM, Shipley MT (1991) Connections between the central nucleus of the amygdala and the midbrain periaqueductal gray: topography and reciprocity. J Comp Neurol 303:121–131. 10.1002/cne.903030111 [DOI] [PubMed] [Google Scholar]
- Sanford LD, Parris B, Tang X (2002) GABAergic regulation of the central nucleus of the amygdala: implications for sleep control. Brain Res 956:276–284. 10.1016/s0006-8993(02)03552-7 [DOI] [PubMed] [Google Scholar]
- Scammell TE, Willie JT, Guilleminault C, Siegel JM; International Working Group on Rodent Models of Narcolepsy (2009) A consensus definition of cataplexy in mouse models of narcolepsy. Sleep 32:111–116. [PMC free article] [PubMed] [Google Scholar]
- Sergerie K, Chochol C, Armony JL (2008) The role of the amygdala in emotional processing: a quantitative meta-analysis of functional neuroimaging studies. Neurosci Biobehav Rev 32:811–830. 10.1016/j.neubiorev.2007.12.002 [DOI] [PubMed] [Google Scholar]
- Shabel SJ, Janak PH (2009) Substantial similarity in amygdala neuronal activity during conditioned appetitive and aversive emotional arousal. Proc Natl Acad Sci U S A 106:15031–15036. 10.1073/pnas.0905580106 [DOI] [PMC free article] [PubMed] [Google Scholar]
- Smith CT, Miskiman DE (1975) Increases in paradoxical sleep as a result of amygdaloid stimulation. Physiol Behav 15:17–19. 10.1016/0031-9384(75)90272-3 [DOI] [PubMed] [Google Scholar]
- Sternson SM, Roth BL (2014) Chemogenetic tools to interrogate brain functions. Annu Rev Neurosci 37:387–407. 10.1146/annurev-neuro-071013-014048 [DOI] [PubMed] [Google Scholar]
- Straube T, Pohlack S, Mentzel HJ, Miltner WH (2008) Differential amygdala activation to negative and positive emotional pictures during an indirect task. Behav Brain Res 191:285–288. 10.1016/j.bbr.2008.03.040 [DOI] [PubMed] [Google Scholar]
- Swanson LW, Petrovich GD (1998) What is the amygdala? Trends Neurosci 21:323–331. 10.1016/S0166-2236(98)01265-X [DOI] [PubMed] [Google Scholar]
- Tabuchi S, Tsunematsu T, Black SW, Tominaga M, Maruyama M, Takagi K, Minokoshi Y, Sakurai T, Kilduff TS, Yamanaka A (2014) Conditional ablation of orexin/hypocretin neurons: A new mouse model for the study of narcolepsy and orexin system function. J Neurosci 34:6495–6509. 10.1523/JNEUROSCI.0073-14.2014 [DOI] [PMC free article] [PubMed] [Google Scholar]
- Tang X, Yang L, Liu X, Sanford LD (2005) Influence of tetrodotoxin inactivation of the central nucleus of the amygdala on sleep and arousal. Sleep 28:923–930. [DOI] [PubMed] [Google Scholar]
- Thannickal TC, Moore RY, Nienhuis R, Ramanathan L, Gulyani S, Aldrich M, Cornford M, Siegel JM (2000) Reduced number of hypocretin neurons in human narcolepsy. Neuron 27:469–474. 10.1016/S0896-6273(00)00058-1 [DOI] [PMC free article] [PubMed] [Google Scholar]
- Tye KM, Stuber GD, de Ridder B, Bonci A, Janak PH (2008) Rapid strengthening of thalamo-amygdala synapses mediates cue-reward learning. Nature 453:1253–1257. 10.1038/nature06963 [DOI] [PMC free article] [PubMed] [Google Scholar]
- Vassalli A, Dellepiane JM, Emmenegger Y, Jimenez S, Vandi S, Plazzi G, Franken P, Tafti M (2013) Electroencephalogram paroxysmal theta characterizes cataplexy in mice and children. Brain 136:1592–1608. 10.1093/brain/awt069 [DOI] [PubMed] [Google Scholar]
- Vichaya EG, Hunt SC, Dantzer R (2014) Lipopolysaccharide reduces incentive motivation while boosting preference for high reward in mice. Neuropsychopharmacology 39:2884–2890. 10.1038/npp.2014.141 [DOI] [PMC free article] [PubMed] [Google Scholar]
- Vong L, Ye C, Yang Z, Choi B, Chua S Jr, Lowell BB (2011) Leptin action on GABAergic neurons prevents obesity and reduces inhibitory tone to POMC neurons. Neuron 71:142–154. 10.1016/j.neuron.2011.05.028 [DOI] [PMC free article] [PubMed] [Google Scholar]
- Williams MA, McGlone F, Abbott DF, Mattingley JB (2005) Differential amygdala responses to happy and fearful facial expressions depend on selective attention. Neuroimage 24:417–425. 10.1016/j.neuroimage.2004.08.017 [DOI] [PubMed] [Google Scholar]
- Wu MF, Nienhuis R, Maidment N, Lam HA, Siegel JM (2011) Cerebrospinal fluid hypocretin (orexin) levels are elevated by play but are not raised by exercise and its associated heart rate, blood pressure, respiration or body temperature changes. Arch Ital Biol 149:492–498. 10.4449/aib.v149i4.1315 [DOI] [PMC free article] [PubMed] [Google Scholar]
- Xi M, Fung SJ, Zhang J, Sampogna S, Chase MH (2012) The amygdala and the pedunculopontine tegmental nucleus: interactions controlling active (rapid eye movement) sleep. Exp Neurol 238:44–51. 10.1016/j.expneurol.2012.08.001 [DOI] [PubMed] [Google Scholar]
- Zhang JN, Xiong KL, Qiu MG, Zhang Y, Xie B, Wang J, Li M, Chen H, Zhang Y, Zhang JJ (2013) Negative emotional distraction on neural circuits for working memory in patients with posttraumatic stress disorder. Brain Res 1531:94–101. 10.1016/j.brainres.2013.07.042 [DOI] [PubMed] [Google Scholar]