

Abstract
mTOR, the mammalian target of rapamycin, integrates growth factor and nutrient signals to promote a transformation from catabolic to anabolic metabolism, cell growth, and cell cycle progression. Phosphatidic acid (PA) interacts with the FK506-binding protein–12-rapamycin-binding (FRB) domain of mTOR, which stabilizes both mTOR complexes: mTORC1 and mTORC2. We report here that mTORC1 and mTORC2 are activated in response to exogenously supplied fatty acids via the de novo synthesis of PA, a central metabolite for membrane phospholipid biosynthesis. We examined the impact of exogenously supplied fatty acids on mTOR in KRas-driven cancer cells, which are programmed to utilize exogenous lipids. The induction of mTOR by oleic acid was dependent upon the enzymes responsible for de novo synthesis of PA. Suppression of the de novo synthesis of PA resulted in G1 cell cycle arrest. Although it has long been appreciated that mTOR is a sensor of amino acids and glucose, this study reveals that mTOR also senses the presence of lipids via production of PA.
Keywords: glycolysis, lipid, mammalian target of rapamycin (mTOR), phosphatidic acid, phospholipase D, Ras protein
Introduction
Cells divide in response to growth factors that indicate that it is appropriate to divide; however, cells must also determine whether there are sufficient nutrients to generate two daughter cells (1). The mammalian target of rapamycin (mTOR)3 is a critical sensor that links external nutrient signals to cellular growth (2). mTOR exists in two complexes: mTORC1 and mTORC2. mTORC1 is sensitive to amino acids and glucose and growth factor input. In contrast, mTORC2 is generally regarded as a responder to growth factor input and a regulator of cell metabolism (3). Although much is known about the dependence of mTORC1 on amino acids (4), less is known about the ability of mTOR to respond to the presence of other nutrients essential for cell growth, such as glucose and lipids.
Both mTORC1 and mTORC2 are dependent on phosphatidic acid (PA), which is critical for the stability and activity of both mTOR complexes (5, 6). The major source of PA generated in response to growth factor signals is the phospholipase D-mediated hydrolysis of phosphatidylcholine (7). However, PA is a key intermediate in de novo membrane phospholipid biosynthesis (8). This central position of PA in the generation of membrane phospholipids makes PA an ideal indicator of lipid sufficiency (9). In the de novo pathway, glycerol-3-phosphate (G3P), derived from the glycolytic intermediate dihydroxyacetone phosphate (DHAP), is doubly acylated with fatty acyl-CoA to generate PA (10). Thus, generation of PA via this mechanism is dependent upon both fatty acids and glucose. Because PA is generated from two critical metabolic needs for cell growth—glucose and fatty acids—it has been proposed that the PA dependence of mTOR evolved as an indicator of nutrient sufficiency (9, 11). Consistent with this hypothesis, the PA binding site within the FK506-binding protein–12-rapamycin-binding (FRB) domain of mTOR is highly conserved from yeast to mammals (9). The conservation of the PA binding site on mTOR was clearly not to retain sensitivity to rapamycin, indicating that PA binding in this region is important.
Cancer cells harboring Ras mutations scavenge exogenous proteins (12) and lipids (13–15). In this study, we provide evidence that exogenously supplied lipids in KRas-driven cancer cells, like amino acids and glucose, stimulate mTOR. Both mTORC1 and mTORC2 are activated in response to oleic acid via the de novo synthesis of PA. This finding expands the role of mTOR as a nutrient sensor to the sensing of lipids. Suppression of this metabolic pathway results in G1 cell cycle arrest.
Results
Exogenous unsaturated fatty acids stimulate mTORC1 and mTORC2
Fetal bovine serum is a complex mixture of nutrients and growth factors and the sole source of exogenous lipids for cultured cells. Ras-driven cancer cells are scavengers of unsaturated serum lipids that are needed for their proliferation (13, 14). mTOR is responsive to nutrients, including amino acids and glucose, and provides a link to cell growth (2, 16). We therefore looked at the impact of exogenous lipids on the activity of mTORC1 and mTORC2. We examined the ability of different classes of fatty acids, saturated (palmitic acid) and unsaturated (oleic acid, linoleic acid, and arachidonic acid) fatty acids, to activate mTORC1 and mTORC2 in the absence of serum lipids. We previously rescued the effect of delipidated serum on the viability of KRas-driven cancer cells with a lipid mixture that contained 10 μm fatty acids (14); for this reason, this was the concentration of fatty acids used to examine the ability to activate mTOR. Fatty acids were added to the KRas-driven cancer cell lines MDA-MB-231 and Calu-1 with BSA as a carrier. As seen in Fig. 1A, the unsaturated oleic acid caused a robust increase in mTORC1 and mTORC2 activity, as indicated by an increase in the phosphorylation of ribosomal subunit S6 kinase (S6K) at Thr-389 (mTORC1) and Akt at Ser-473 (mTORC2). The effect of oleic acid was more pronounced for the phosphorylation of the mTORC2 substrate Akt, which will be addressed under “Discussion.” Linoleic and arachidonic acid increased S6K phosphorylation in Calu-1 cells and, to a lesser extent, in MDA-MB-231 cells. It is not clear why the Calu-1 cells were more responsive to linoleic and arachidonic acid than the MDA-MB-231 cells, but neither cell line responded to palmitic acid for either S6K or Akt phosphorylation. siRNA-mediated knockdown of the mTOR binding partners Raptor and Rictor abrogated the oleic acid-mediated increase in mTORC1 and mTORC2 activity, respectively, in both MDA-MB-231 and Calu-1 cells (Fig. 1B). The knockdown of Raptor induced phosphorylation Akt, consistent with the feedback activation of mTORC2 reported previously in response to inhibition of mTORC1 (17). Thus, exogenously provided oleic acid activates both mTORC1 and mTORC2 in the absence of serum factors.
Figure 1.

Exogenously supplied unsaturated fatty acids stimulate mTOR activity. A, MDA-MB-231 and Calu-1 cells were plated at 60% confluence in complete medium (CM) and shifted to serum-free medium for 16 h. Fatty acid (10 μm):BSA in a 2:1 ratio was added for 30 min. Fatty acid-free BSA was used as a negative control. Lysates were collected and analyzed for the phosphorylated mTOR substrates P-S6KThr-389 (mTORC1) and P-AktSer-473 (mTORC2) by Western blotting. P, palmitic acid; O, oleic acid; L, linoleic acid; A, arachidonic acid. B, MDA-MB-231 and Calu-1 cells were plated at 40% confluence and transfected with siRNA against Raptor (100 nm) and Rictor (100 nm). Cells were shifted to serum-free medium for the last 16 h of transfection. Oleic acid (10 μm):BSA in a 2:1 ratio was added for 30 min. 72 h post-transfection, cells were collected, and lysates were analyzed for phosphorylated mTOR substrates by Western blotting as in A. The Western blots shown are representative of experiments repeated at least three times.
Oleic acid-induced mTOR Activation is dependent on lysophosphatidic acid acyltransferase β
PA, which is required for mTOR complex formation and activity (5, 6), is also at the center of membrane phospholipid biosynthesis (8). Thus, the ability of oleic acid to stimulate mTOR suggests that activation of mTOR is via de novo synthesis of PA. A critical step in the synthesis of PA is the acylation of lysophosphatidic acid (LPA) by LPA acyltransferase-β (LPAAT-β) (Fig. 2A). LPAAT-β also has a preference for unsaturated fatty acids, especially oleic acid (18). We therefore examined whether exogenously supplied oleic acid could activate mTOR in the absence of LPAAT-β. As shown in Fig. 2B, knockdown of LPAAT-β with siRNA suppressed the oleic acid-induced activation of both mTORC1 and mTORC2 in Calu-1 cells, with a stronger impact on the mTORC2 substrate Akt. Recently, Chen and co-workers (19) reported that exogenously supplied PA containing at least one monounsaturated fatty acid activated mTORC1. We have also demonstrated previously that 1-palmitoyl-2-oleoyl-PA (16:0, 18:1 PA) activates both mTORC1 and mTORC2 (5). Therefore, we examined whether the addition of 16:0, 18:1 PA, the product of LPAAT-β, could activate both mTORC1 and mTORC2 in Calu-1 cells where LPAAT-β expression was suppressed. As shown in Fig. 2B, 16:0, 18:1 PA overcame the effect of LPAAT-β knockdown, indicating that the suppressed mTOR activity observed with suppressed LPAAT-β expression was due to the lack of PA. Dioctanoyl-PA can also activate mTOR (19, 20), indicating that the effect of PA was not due to conversion of PA to LPA because the octanoyl-LPA is not an agonist for the LPA receptor (21). We also examined the incorporation of [3H]oleic acid into PA with and without LPAAT-β expression. As shown in Fig. 2C, we observed a 50% reduction of [3H]oleic acid incorporation into PA in Calu-1 cells where LPAAT-β expression was suppressed. These data reveal that exogenously supplied oleic acid is incorporated into PA in an LPAAT-β-dependent manner and that activation of mTOR by oleic acid is dependent on LPAAT-β.
Figure 2.
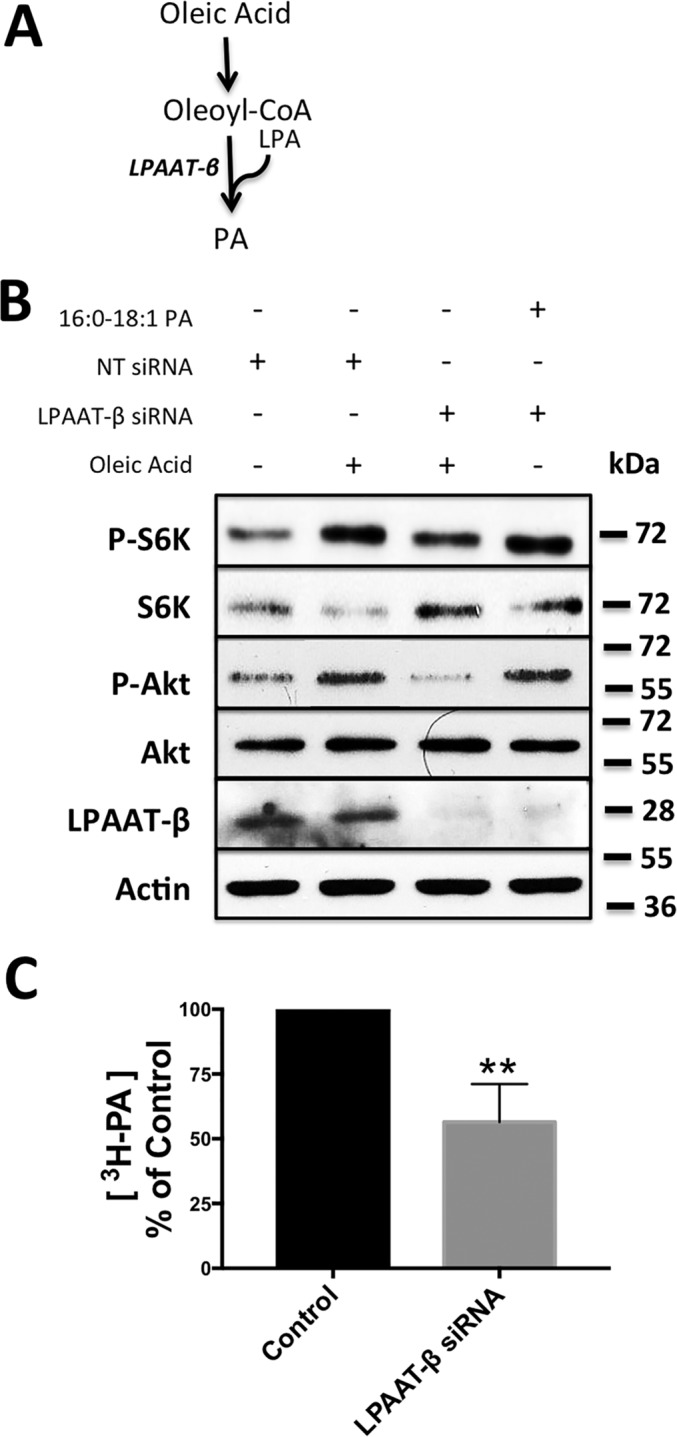
Exogenously supplied oleic acid activates mTOR through LPAAT-β-generated PA. A, schematic for the incorporation of oleic acid into PA. B, Calu-1 cells were plated at 40% confluence and transfected with LPAAT-β siRNA (100 nm) or non-targeting (NT) siRNA for 48 h. Cells were shifted to serum-free medium during the last 16 h of treatment, and 10 μm oleic acid:BSA (2:1) was added to the cells for 30 min. Lysates were collected and probed for mTOR substrate phosphorylation and LPAAT-β by Western blotting analysis as in Fig. 1. C, Calu-1 cells were plated at 40% confluence and transfected with LPAAT-β siRNA (100 nm) or non-targeting siRNA for 48 h. During the last 16 h, cells were shifted to serum-free medium, and [3H]oleic acid was added for 3 h. Total cellular lipids were extracted and subjected to thin-layer chromatography along with PA standard. PA levels were quantified using autoradiography as described under “Experimental Procedures.” The percentage of 3H-labeled PA in cells treated with LPAAT-β siRNA relative to cells treated with control non-targeting siRNA is presented. The statistical significance (p value) was determined by Student's two-tailed unpaired t test. **, p ≤ 0.01 compared with the control. The Western blots shown are representative of experiments repeated at least three times.
Acyl-CoA synthetase long chain 5 mediates mTOR activity in KRas-driven cancer cells
If the oleic acid is activating mTOR via the LPAAT-β-catalyzed acylation of LPA, then oleic acid needs to esterify with CoA. Fatty acids are esterified with CoA by a class of enzyme known as acyl-CoA synthetases (ACS) (Fig. 3A). Of the many isoforms of ACS, ACS long chain 1 (ACSL1) and ACSL5 have been shown to have substrate specificity for unsaturated fatty acids (22). Mutant KRas-driven cancers are known to scavenge for exogenous lipids (13–15). It was reported that mutant KRas drives ACSL5 expression in HCT-116 colon cancer cells (23). We examined the level of ACSL5 expression in the KRas-driven HCT-116 colon cancer cells and the MDA-MB-231 and Calu1 cells used in Figs. 1 and 2. We also examined the level of ACSL5 expression in several non-KRas-driven cancer cells (MCF7 breast, PC3 prostate, and 786-O renal) and the non-transformed human fibroblast cell line BJ-hTERT. As shown in Fig. 3B, the KRas-driven cancer cells express higher levels of ACSL5 expression relative to the non-KRas mutant cancer cell lines.
Figure 3.
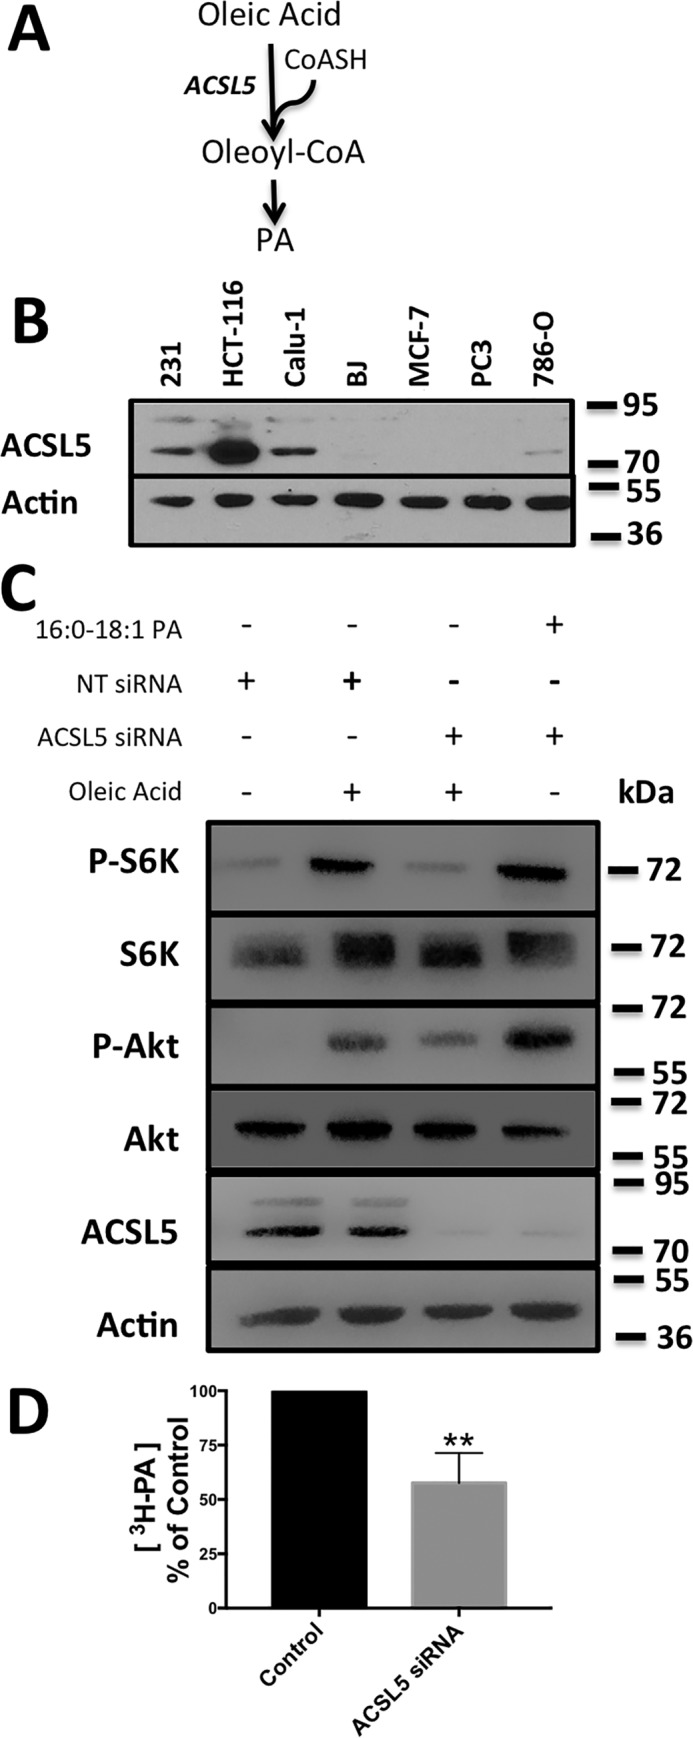
Suppression of acyl-CoA synthetase expression decreases oleic acid-induced mTOR activity. A, schematic for the incorporation of oleoyl-CoA into PA. B, cell lysates from the indicated cancer cell lines were probed for expression of ACSL5 by Western blotting. C, Calu-1 cells were transfected with ACSL5 siRNA or NT siRNA for 72 h. Cells were shifted to serum-free medium during the last 16 h of treatment. Oleic acid (10 μm):BSA (2:1) was added to the cells for 30 min, and lysates were probed for the indicated proteins by Western blotting. D, Calu-1 cells were transfected with ACSL5 siRNA or non-targeting siRNA for 72 h. During the last 16 h, cells were shifted to serum-free medium, and [3H]oleic acid was added for 3 h. Total lipids were extracted, and radiolabeled PA was determined as in Fig. 2. The Western blots shown are representative of experiments repeated at least three times.
To determine whether ACSL5 was required for the oleic acid-induced increases in mTOR activity, we performed siRNA knockdown of ACSL5. Knockdown of ACSL5 expression suppressed the oleic acid induction of both S6K and Akt phosphorylation (Fig. 3C). Exogenously provided 16:0, 18:1 PA was able to reverse the effect of ACSL5 knockdown on mTOR activity (Fig. 3C). ACSL5 knockdown also suppressed incorporation of [3H]oleic acid into PA (Fig. 3D). The data in Fig. 3 demonstrate that the oleic acid induction of mTOR is dependent on the generation of oleoyl-CoA.
Cytosolic G3P dehydrogenase 1 generates the G3P backbone required for de novo PA synthesis and mTOR activation stimulated by oleic acid
To generate PA from oleoyl-CoA, a G3P backbone is needed for acylation. The major source of G3P is the glycolytic intermediate DHAP, which is reduced by cytosolic NAD-linked G3P dehydrogenase 1 (GPD1). Isotope tracing experiments were performed with uniformly labeled [13C]glucose to determine whether DHAP is being shunted away from glycolysis to G3P (Fig. 4A). We employed a panel of non-small-cell lung cancer cell lines that were both KRas-driven and KRas wild-type. [13C]glucose was added to the cells, and the fraction of G3P labeled with 13C was determined at 6 and 24 h. As shown in Fig. 4B, all of the cells displayed substantial 13C-labeled G3P, indicating that some glucose-derived DHAP was being shunted to G3P. Although the KRas mutant cell lines Calu-1 and HCC44 showed the largest fractional enrichment of glucose into G3P, there was not a complete correlation between KRas-driven cancer cell lines and higher percentage of 13C-labeled G3P. However, it was clear that substantial G3P was being generated from glucose.
Figure 4.

Cytosolic GPD1 generates the G3P backbone required for de novo PA synthesis and oleic acid-induced mTOR activation. A, model for tracing [13C]glucose carbon labeling to generate G3P and PA. B, stable isotope tracing and GC-MS was used to measure fractional enrichment of [13C]glucose into m+3 G3P at 6 and 24 h in a set of wild-type and mutant KRas non-small-cell lung cancer cell lines grown in complete medium. C and D, Calu-1 (C) and HepG2 (D) cells were transfected with GPD1 or NT siRNA for 48 h. Cells were shifted to serum-free medium during the last 16 h of treatment, and 10 μm oleic acid:BSA (2:1) was added to the cells for 30 min. Lysates were probed for the phosphorylated mTOR substrates S6K and Akt by Western blotting analysis as in Fig. 1. GPD1 mRNA levels were determined for Calu-1 cells (C), and GPD1 protein levels were determined for HepG2 cells (D). E and F, Calu-1 (E) and HepG2 (F) cells were transfected with GPD1 or non-targeting siRNA for 48 h. Cells were shifted to serum-free medium for the last 16 h of treatment, and [3H]oleic acid was added for 3 h. Total lipids were extracted, and radiolabeled PA was determined as in Fig. 2. The Western blots shown are representative of experiments repeated at least three times.
We next examined the effect of suppressing the expression of GPD1, the enzyme that generates G3P from DHAP, on oleic acid-induced phosphorylation of S6K and Akt in Calu-1 cells. As shown in Fig. 4C, treatment with GPD1 siRNA suppressed mTORC1 and mTORC2 activation, as indicated by reduced phosphorylation of S6K and Akt. The effect on Akt phosphorylation was more pronounced than on S6K phosphorylation, which was generally true for the knockdown of LPAAT-β observed in Fig. 2. Exogenously provided 16:0, 18:1 PA was able to stimulate both S6K and Akt phosphorylation when GPD1 expression was suppressed. For reasons that are not clear, the levels of GPD1 protein are very low in Calu-1 cells, making it difficult to establish that knockdown of GPD1 was actually occurring in response to GPD1 siRNA. However, we could detect a strong reduction in GPD1 mRNA levels (Fig. 4C). To further establish a dependence of oleic acid-induced mTOR activation on GPD1, we examined the effect of GPD1 knockdown in N-Ras-driven HepG2 hepatoma cells (24), which are known to express detectable levels of GPD1 (25). As shown in Fig. 4D, knockdown of GPD1 suppressed the oleic acid-induced activation of both mTORC1 and mTORC2; with the HepG2 cells, we could see a reduction in GPD1 protein. As with Calu-1 cells, the impact of GPD1 knockdown was more pronounced for the mTORC2 phosphorylation of Akt.
We next determined whether the [3H]oleic acid incorporation into PA was dependent on GPD1. Calu-1 and HepG2 cells were treated with scrambled or GPD1 siRNA for 48 h. [3H]oleic acid was added for the final 3 h. Radiolabeled PA was determined as in Figs. 2 and 3. As shown in Fig. 4, E (Calu-1 cells) and F (HepG2 cells), the level of 3H-labeled PA was significantly reduced by knockdown of GPD1. Collectively, the data in Fig. 4 demonstrate that the oleic acid induction of mTOR is dependent on glucose-derived G3P and GPD1.
Suppressing ACSL5 expression causes G1 phase cell cycle arrest
The suppression of mTOR can cause the arrest of cells in G1 phase of the cell cycle (26, 27). We therefore examined the impact of suppressing ACSL5 on cell cycle progression in the KRas-driven cancer cell line Calu1. ACSL5 expression is elevated in KRas-driven cancer cells (Fig. 3B), which are known to scavenge lipids (13–15). Calu-1 cells were plated in complete medium with 10% fetal bovine serum as a source of lipids and TGF-β, which is required for the cell cycle arrest caused by mTORC1 inhibition (28, 29). The Calu-1 cells were then treated with either scrambled siRNA or siRNA targeting ACSL5 as in Fig. 3. After 96 h, cells were harvested and subjected to flow cytometric analysis to determine the distribution of cells in G1 and S phase. As shown in Fig. 5, the percentage of cells in G1 phase increased, whereas the cells in S phase decreased. There was also a substantial reduction in [3H]thymidine incorporation into DNA (Fig. 5B). We also observed a reduction in the levels of Rb, phospho-Rb, and the S phase cyclin, cyclin A (Fig. 3C). Thus, suppression of the pathway for scavenging fatty acids via ACSL5 that are ultimately incorporated into PA suppresses cell cycle progression, indicating that the scavenging pathway is important for cells to progress through G1 into S phase of the cell cycle.
Figure 5.
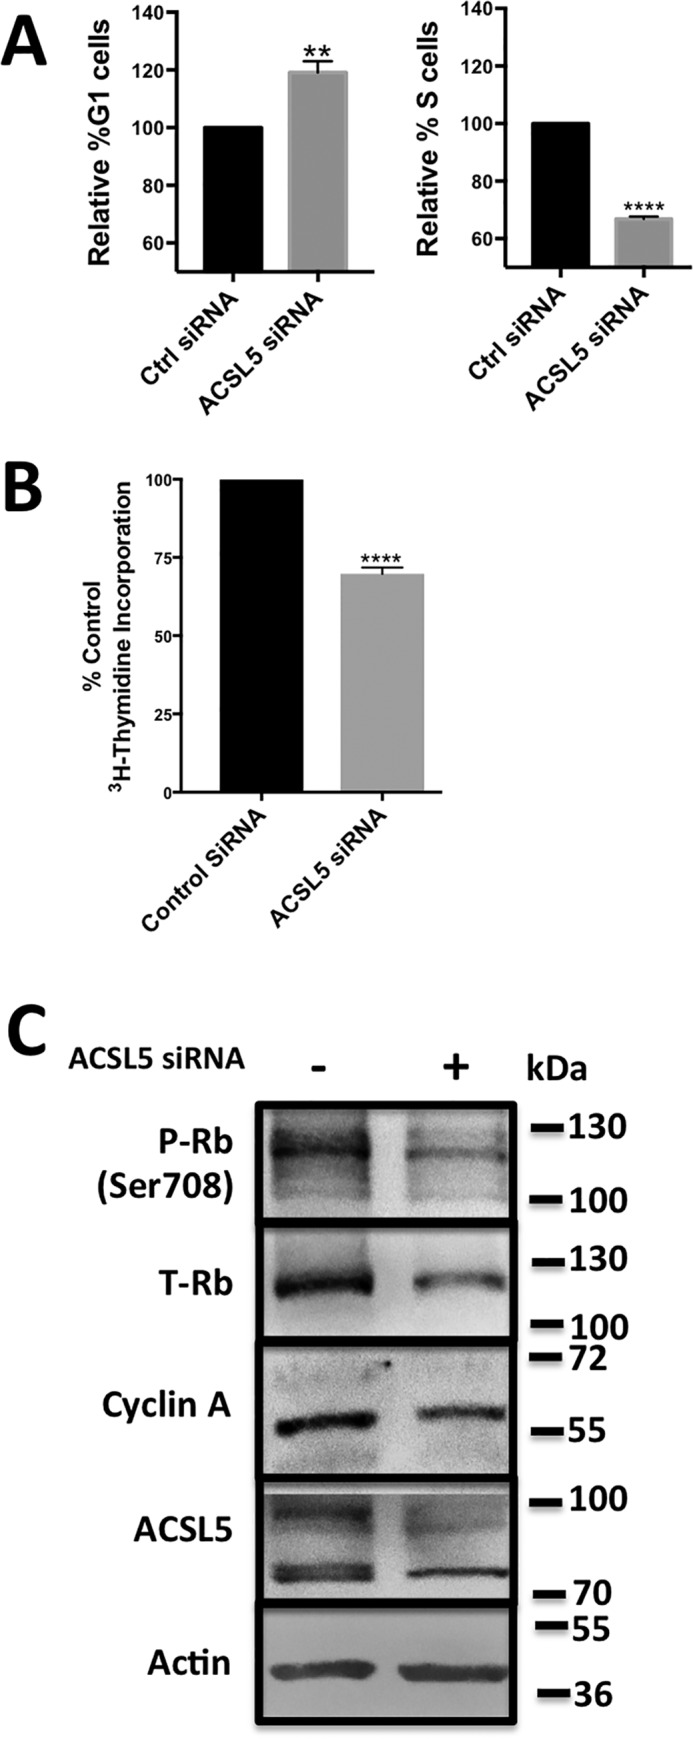
Suppressing ACSL5 expression causes G1 cell cycle arrest. A, Calu-1 cells were plated at 40% confluence and transfected with ACSL5 siRNA (25 nm) or control (Ctrl) siRNA. 96 h post-transfection, cells were collected and analyzed by flow cytometry. Data are shown in terms of the percentage of change in the number of cells in G1 and S phases of the cell cycle. Mean values for G1 phase cells were 53.4% ± 10.4% and 25.2% ± 9.4% for S phase cells in the controls and were normalized to 100%. Analysis was performed on at least 10,000 cells for each condition. B, Calu-1 cells were plated at 40% confluence and transfected with ACSL5 siRNA or control siRNA as in A. 48 h post-transfection, [3H]thymidine was added. After 24 h, cells were collected, and total radioactivity was determined by scintillation counter. Statistical significance (p values) for A and B were determined by Student's two-tailed unpaired t test. **, p ≤ 0.01; ****, p ≤ 0.0001 compared with the control. C, Calu-1 cells were plated at 40% confluency and transfected with ACSl5 siRNA (25 nm) or control siRNA. 96 h post-transfection, cells were collected and analyzed for the levels of ACSL5, phospho-Rb (P-Rb), total Rb (T-Rb), cyclin A, and actin by Western blotting. The Western blot shown is representative of experiments repeated twice.
Discussion
Although much is known about the amino acid input to mTORC1 on lysosomal membranes (4), there is very little known about the glucose input to mTOR and nothing about any input to mTOR involving lipids. In this report, we provide evidence that lipids impact both mTORC1 and mTORC2 via the de novo synthesis of PA, a central metabolite for membrane phospholipid biosynthesis. There is a requirement for both fatty acids and G3P, a product of glycolysis, for the activation of mTOR. A schematic for the activation of mTOR in response to fatty acids and glucose via the generation of PA is shown in Fig. 6. Thus, the PA needed for mTOR activation reflects the presence of both lipids and glucose. These data demonstrate that the nutrient sensing by mTOR goes beyond that for amino acids and includes input from both lipids and glucose via the production of PA.
Figure 6.

Schematic for mTOR activation in response to fatty acids. Exogenously supplied fatty acids stimulate mTOR via de novo PA synthesis. The glycerol backbone of PA comes from reduction of the glycolytic intermediate DHAP by GPD1. CoA is acylated with fatty acids by ACSL5 to generate fatty acyl-CoA. The fatty acid can then be transferred to the glycerol backbone of G3P by a glycerophosphate acyltransferase (GPAT) to generate LPA, which can then be acylated by LPAAT. The responsiveness of mTOR to lipids and glucose via the generation of PA represents a means for the sensing critical nutrients for cell growth.
An intriguing aspect of mTOR activation in response to oleic acid is that mTORC2 is more responsive to oleic acid than mTORC1. Akt is phosphorylated at the mTORC2 site at Ser-473 more strongly than S6K is phosphorylated at the mTORC1 site at Thr-389 (Fig. 1). This could be due to subcellular localization. Although mTORC2 has been reported to have several subcellular locations, it was recently reported that mTORC2 co-localizes with mitochondrion-associated membranes (MAMs) upon stimulation with insulin (30, 31). The MAMs are extensions of the endoplasmic reticulum that represent a hub for control over cellular metabolism (32). Importantly, the endoplasmic reticulum is enriched in lipid-metabolizing enzymes (33), including LPAAT-β (34) and ACSL5 (22). Thus, the more profound effect of oleic acid on mTORC2 may be due to the synthesis of PA on the endoplasmic reticulum where Akt localizes (35). It is speculated that the PA generated by de novo synthesis promotes the translocation mTORC2 to the MAMs, where it can phosphorylate Akt. In this regard, it is of interest that PA has been implicated vesicle trafficking and fusion (36, 37). The recruitment of mTORC2 to the MAMs in response to de novo PA synthesis is consistent with a proposed role of mTORC2 in regulating metabolism and mitochondrial functions (3). Thus, the responsiveness of mTORC2 to de novo PA biosynthesis on MAMs may represent a means for the sensing of both lipids and glucose and then altering mitochondrial activity via the phosphorylation of Akt.
Of all the lipids used to stimulate mTOR activity, the most consistent pattern was that oleic acid induced both S6K and Akt phosphorylation in both MDA-MB-231 and the Calu-1 cells and that palmitic acid did not induce phosphorylation of either substrate in either cell line. This is consistent with the observation that 16:0, 18:1 PA activates mTORC1 whereas dipalmitoyl-PA does not (19). The importance of oleic acid for KRas-driven cancer cells is underscored by the lack of expression of stearoyl-CoA desaturase, which converts stearic acid to oleic acid (14), explaining the need for oleic acid observed here. It is also of significance that dipalmitoyl-PA was shown to promote the disassembly of mTORC2 and inhibit the phosphorylation of Akt by mTORC2 (38), further supporting the importance of oleic acid. Although dioctanoyl-PA, which lacks an unsaturated fatty acid, is able to activate mTOR, this could be because the eight carbons reaches to where approximately oleic acid is desaturated, and the double bond puts a bend in the hydrocarbon chain. This suggests that the fatty acid chain is important for the PA-mTOR interaction.
The bulk of this study was performed using KRas-driven cancer cells, in which there is an enhanced need for exogenous lipids (13, 14). In this regard, it is of interest that LPAAT-β silencing was able to inhibit the proliferation and anchorage-independent growth of pancreatic cancer cells (39), in which KRas is mutated in 95% of the cases (40). Consistent with this report, we find that suppression of the de novo synthesis of PA in KRas-driven Calu1 lung cancer cells leads to G1 cell cycle arrest. Thus, the de novo PA biosynthesis pathway is apparently critical for the proliferation of cancer cells that are dependent on KRas signals. The data provided here demonstrate that mTOR responds to exogenously supplied fatty acids via the de novo synthesis of PA. The apparent importance of this pathway in KRas-driven cancers suggests the possibility of targeting the PA synthesis pathway in the large number of KRas-driven human cancers.
Experimental procedures
Materials
The lipids used were as follows: oleic acid (Sigma, O3008), linoleic acid (Sigma, L9530), palmitic acid (Sigma, P0500), arachidonic acid (Sigma-Aldrich, 10931), fatty acid-free BSA (Sigma-Aldrich, A7030), 18:1–16:0 phosphatidic acid (Avanti Polar Lipids, 840857C), and egg phosphatidic acid (Avanti Polar Lipids, 84010C). Antibodies for P-S6KThr-389 (9234), P-AktSer-473 (9271), S6K (9202), Akt (9272), Raptor (2280), Rictor (9476), cyclinA2 (4656), P-Rb (9307), and T-Rb (9309) were obtained from Cell Signaling Technology. Antibodies for ACSL5 (HPA007162) and GPD1 (HPA044620) were from Atlas Antibodies, for LPAAT-β (TA 323423) from Origene, and for actin (60008-1-lg) from Proteintech Group. Ultima Gold scintillation fluid (6013681) and [3H]thymidine (20 Ci/mm, 1 mCi/ml, NET-027E) were obtained from PerkinElmer Life Sciences.
Cells and culture conditions
The MDA-MB-231 breast, Calu-1 lung, HepG2 liver, MCF7 breast, PC3 prostate, and 786-O renal cancer cell lines and BJ-hTERT cells were obtained from the American Type Culture Collection. Calu-1 cells were cultured in McCoy's 5A medium (Sigma, M8403) containing 10% fetal bovine serum and 2 mm l-glutamine (Sigma, G7513). All other cells were cultured in Dulbecco's modified Eagle's medium (Sigma, D6429) containing 10% fetal bovine serum (Sigma, F4135). The non-small-cell lung cancer cell lines used were from the Hamon Cancer Center Collection (University of Texas Southwestern Medical Center) and were maintained in RPMI 1640 medium (Life Technologies) supplemented with 10% fetal calf serum.
siRNA treatment
Transient siRNA transfections were carried out as described previously (41). The following siRNAs were used in the study: Raptor siRNA (Santa Cruz Biotechnology, sc-44069), Rictor siRNA (Santa Cruz Biotechnology, sc-61478), LPAAT-β siRNA (Dharmacon, M003811), ACSL5 siRNA (Ambion, s28549), GPD1 siRNA (Ambion, s223769), non-targeting siRNA (Ambion, 4390843), and non-targeting siRNA (Dharmacon, D-001206-13).
Evaluation of mRNA levels
qRT-PCR was performed using the One-Step Cells Direct qRT-PCR kit (11753-100 Thermo Fisher Scientific) according to the instructions of the manufacturer. The TaqMan primers 6-carboxyfluorescein/minor grove binder (MGB) probe specific to GPD1 (Applied Biosystems, Hs01100039_m1) and GAPDH (4352934E) were obtained from Applied Biosystems. One-step qRT-PCR was performed using assays specific to GPD1 and GAPDH. The expression levels of GPD1 mRNA were measured relative to the average of GAPDH. Thermal cycling conditions were as follows: 50 °C for 15 min, 95 °C for 2 min, 40 cycles of 95 °C for 15 s, and 60 °C for 45 s. The samples were run on the Step One Plus RT-PCR system from Thermo Fisher Scientific and analyzed using Step One software (version 2.2.2).
Stable isotope tracing measurement of G3P labeling with [13C]glucose
Stable isotope tracing of uniformly labeled [13C]glucose to G3P was evaluated in eight non-small-cell lung carcinoma cell lines. Fractional enrichment of G3P was determined as described previously, except that ions 445–448 were monitored for the G3P peak (42).
Measurement of PA levels
Relative PA levels were determined as described previously by Hornberger et al. (43). Cells were plated in complete medium and then serum-starved during the last 16 h of siRNA treatment. 0.1 μm [3H]oleic acid (5 mCi/ml) was added to the culture for 3 h under conditions of siRNA-mediated knockdown. Cells were collected in ice-cold methanol:6 n HCl (50:2) and added to the first extraction buffer (155 ml of 1 m NaCl and 500 ml of chloroform). The lower organic layer was transferred to the second extraction buffer (350 μl of water, 115 μl of 1 m NaCl, and 115 μl of methanol). The radioactivity of the lower organic layer was quantified by scintillation counting, and equal radioactivity counts of total lipids from each sample were dried under nitrogen. The samples were resuspended in spotting solution (chloroform:methanol, 9:1; 2 μl of egg PA (10 mg/ml) and run on a thin-layer chromatography plate in 100 ml of the upper phase of ethyl acetate:iso-octane:glacial acetic acid:water (88:40:20:80). Plates were sprayed with En3hance spray (PerkinElmer Life Sciences, 6NE970C) exposed to a preflashed X-ray film (Amersham Biosciences, 28906836), and developed after 3 days at 80 °C. Bands corresponding to the PA standard were quantified using Image Studio Lite 4.0.21.
Preparation of PA vesicles
Immediately before addition, PA (16:0, 18:1) in chloroform was dried under nitrogen and resuspended in Dulbecco's phosphate-buffered saline (Thermo Scientific, 14190). The suspension was sonicated for 3 min. The resulting PA suspension was added to cells at a final concentration of 300 μm.
Western blotting analysis
Extraction of proteins from cultured cells and Western blotting analysis of extracted proteins were performed with the ECL system (Amersham Biosciences) as described previously (41).
Flow cytometric analysis
Cell cycle distribution was determined by flow cytometry as described previously (26). Briefly, cells were fixed in 70% ethanol, stained using propidium iodide, and passed through 70-μm meshes to remove cell aggregates. Fluorescence intensity corresponding to DNA content in different phases of the cell cycle was measured by flow cytometry (FACSCalibur, BD Biosciences) and analyzed using WinCycle software (Phoenix Flow Systems).
Thymidine incorporation assay
Cells were labeled with 1μCi/ml [3H]thymidine. At the indicated times, cells were washed twice with 1 ml of phosphate-buffered saline and then precipitated twice with 1 ml of 10% trichloroacetic acid. The precipitates were solubilized in 0.5 ml of 0.5% SDS/0.5 M NaOH solution, and the extent of [3H]thymidine incorporation was quantified using 75 μl of sample and 3 ml of scintillation fluid. Each experiment was performed twice.
Author contributions
D. M., D. S., E. B., M. A. F., R. D., and D. A. F. conceptualized the study. D. M., D. S., R. D., and D. A. F. developed the methodology. D. M., D. S., E. B., E. G., A. A., J. S., P. H. C., and S. K. performed the investigations. D. M. and D. A. F. wrote the manuscript. D. M., R. D., and D. A. F. supervised the study.
Acknowledgments
We thank Jack Singer (Cell Therapeutics Incorporated Biopharma, Seattle, WA) and Lydia Finley (Memorial Sloan-Kettering Cancer Center) for helpful suggestions.
Note added in proof
In the version of this article that was published as a Paper in Press on February 21, 2017, the wrong actin immunoblot was inadvertently used for Calu-1 cells in Fig. 1A. This error has now been corrected and does not affect the results or conclusions of this work.
This work was supported by National Institutes of Health Grants R01-CA046677 and R01-CA179542 (to D. A. F.) and Pilot Project Award RP-03037 from the Research Centers in Minority Institutions of the National Center for Research Resources of the National Institutes of Health. Ralph DeBerardinis is on the Scientific Advisory Board of Agios Pharmaceuticals. The content is solely the responsibility of the authors and does not necessarily represent the official views of the National Institutes of Health.
- mTOR
- mammalian target of rapamycin
- PA
- phosphatidic acid
- G3P
- glycerol-3-phosphate
- DHAP
- dihydroxyacetone phosphate
- S6K
- ribosomal subunit S6 kinase
- LPA
- lysophosphatidic acid
- LPAAT-β
- lysophosphatidic acid acyltransferase β
- ACS
- acyl-CoA synthetase(s)
- MAM
- mitochondrion-associated endoplasmic reticulum membrane
- NT
- non-targeting.
References
- 1. Foster D. A., Yellen P., Xu L., and Saqcena M. (2010) Regulation of G1 cell cycle progression: distinguishing the restriction point from a nutrient-sensing cell growth checkpoint(s). Genes Cancer 1, 1124–1131 [DOI] [PMC free article] [PubMed] [Google Scholar]
- 2. Laplante M., and Sabatini D. M. (2012) mTOR signaling in growth control and disease. Cell 149, 274–293 [DOI] [PMC free article] [PubMed] [Google Scholar]
- 3. Oh W. J., and Jacinto E. (2011) mTOR complex 2 signaling and functions. Cell Cycle 10, 2305–2316 [DOI] [PMC free article] [PubMed] [Google Scholar]
- 4. Efeyan A., Zoncu R., and Sabatini D. M. (2012) Amino acids and mTORC1: from lysosomes to disease. Trends Mol. Med. 18, 524–533 [DOI] [PMC free article] [PubMed] [Google Scholar]
- 5. Toschi A., Lee E., Xu L., Garcia A., Gadir N., and Foster D. A. (2009) Regulation of mTORC1 and mTORC2 complex assembly by phosphatidic acid: competition with rapamycin. Mol. Cell. Biol. 29, 1411–1420 [DOI] [PMC free article] [PubMed] [Google Scholar]
- 6. Fang Y., Vilella-Bach M., Bachmann R., Flanigan A., and Chen J. (2001) Phosphatidic acid-mediated mitogenic activation of mTOR signaling. Science 294, 1942–1945 [DOI] [PubMed] [Google Scholar]
- 7. Foster D. A. (2009) Phosphatidic acid signaling to mTOR: signals for the survival of human cancer cells. Biochim. Biophys. Acta 1791, 949–955 [DOI] [PMC free article] [PubMed] [Google Scholar]
- 8. Bonham L., Leung D. W., White T., Hollenback D., Klein P., Tulinsky J., Coon M., de Vries P., and Singer J. W. (2003) Lysophosphatidic acid acyltransferase-β: a novel target for induction of tumour cell apoptosis. Expert. Opin. Ther. Targets 7, 643–661 [DOI] [PubMed] [Google Scholar]
- 9. Foster D. A. (2013) Phosphatidic acid and lipid-sensing by mTOR. Trends Endocrinol. Metab. 24, 272–278 [DOI] [PMC free article] [PubMed] [Google Scholar]
- 10. Wendel A. A., Lewin T. M., and Coleman R. A. (2009) Glycerol-3-phosphate acyltransferases: rate limiting enzymes of triacylglycerol biosynthesis. Biochim. Biophys. Acta 1791, 501–506 [DOI] [PMC free article] [PubMed] [Google Scholar]
- 11. Mérida I., Avila-Flores A., and Merino E. (2008) Diacylglycerol kinases: at the hub of cell signalling. Biochem. J. 409, 1–18 [DOI] [PubMed] [Google Scholar]
- 12. Commisso C., Davidson S. M., Soydaner-Azeloglu R. G., Parker S. J., Kamphorst J. J., Hackett S., Grabocka E., Nofal M., Drebin J. A., Thompson C. B., Rabinowitz J. D., Metallo C. M., Vander Heiden M. G., and Bar-Sagi D. (2013) Macropinocytosis of protein is an amino acid supply route in Ras-transformed cells. Nature 497, 633–637 [DOI] [PMC free article] [PubMed] [Google Scholar]
- 13. Kamphorst J. J., Cross J. R., Fan J., de Stanchina E., Mathew R., White E. P., Thompson C. B., and Rabinowitz J. D. (2013) Hypoxic and Ras-transformed cells support growth by scavenging unsaturated fatty acids from lysophospholipids. Proc. Natl. Acad. Sci. U.S.A. 110, 8882–8887 [DOI] [PMC free article] [PubMed] [Google Scholar]
- 14. Salloum D., Mukhopadhyay S., Tung K., Polonetskaya A., and Foster D. A. (2014) Mutant ras elevates dependence on serum lipids and creates a synthetic lethality for rapamycin. Mol. Cancer Ther. 13, 733–741 [DOI] [PMC free article] [PubMed] [Google Scholar]
- 15. Padanad M. S., Konstantinidou G., Venkateswaran N., Melegari M., Rindhe S., Mitsche M., Yang C., Batten K., Huffman K. E., Liu J., Tang X., Rodriguez-Canales J., Kalhor N., Shay J. W., Minna J. D., et al. (2016) Fatty acid oxidation mediated by acyl-CoA synthetase long chain 3 is required for mutant KRAS lung tumorigenesis. Cell Rep. 16, 1614–1628 [DOI] [PMC free article] [PubMed] [Google Scholar]
- 16. Fingar D. C., and Blenis J. (2004) Target of rapamycin (TOR): an integrator of nutrient and growth factor signals and coordinator of cell growth and cell cycle progression. Oncogene 23, 3151–3171 [DOI] [PubMed] [Google Scholar]
- 17. O'Reilly K. E., Rojo F., She Q. B., Solit D., Mills G. B., Smith D., Lane H., Hofmann F., Hicklin D. J., Ludwig D. L., Baselga J., and Rosen N. (2006) mTOR inhibition induces upstream receptor tyrosine kinase signaling and activates Akt. Cancer Res. 66, 1500–1508 [DOI] [PMC free article] [PubMed] [Google Scholar]
- 18. Hollenback D., Bonham L., Law L., Rossnagle E., Romero L., Carew H., Tompkins C. K., Leung D. W., Singer J. W., and White T. (2006) Substrate specificity of lysophosphatidic acid acyltransferase β: evidence from membrane and whole cell assays. J. Lipid Res. 47, 593–604 [DOI] [PubMed] [Google Scholar]
- 19. Yoon M. S., Rosenberger C. L., Wu C., Truong N., Sweedler J. V., and Chen J. (2015) Rapid mitogenic regulation of the mTORC1 inhibitor, DEPTOR, by phosphatidic acid. Mol. Cell 58, 549–556 [DOI] [PMC free article] [PubMed] [Google Scholar]
- 20. Yoon M. S., Sun Y., Arauz E., Jiang Y., and Chen J. (2011) Phosphatidic acid activates mammalian target of rapamycin complex 1 (mTORC1) kinase by displacing FK506 binding protein 38 (FKBP38) and exerting an allosteric effect. J. Biol. Chem. 286, 29568–29574 [DOI] [PMC free article] [PubMed] [Google Scholar]
- 21. van Corven E. J., van Rijswijk A., Jalink K., van der Bend R. L., van Blitterswijk W. J., and Moolenaar W. H. (1992) Mitogenic action of lysophosphatidic acid and phosphatidic acid on fibroblasts: dependence on acyl-chain length and inhibition by suramin. Biochem. J. 281, 163–169 [DOI] [PMC free article] [PubMed] [Google Scholar]
- 22. Mashek D. G., Li L. O., and Coleman R. A. (2007) Long-chain acyl-CoA synthetases and fatty acid channeling. Future Lipidol. 2, 465–476 [DOI] [PMC free article] [PubMed] [Google Scholar]
- 23. Chun S. Y., Johnson C., Washburn J. G., Cruz-Correa M. R., Dang D. T., and Dang L. H. (2010) Oncogenic KRAS modulates mitochondrial metabolism in human colon cancer cells by inducing HIF-1α and HIF-2α target genes. Mol. Cancer 9, 293. [DOI] [PMC free article] [PubMed] [Google Scholar]
- 24. Omerovic J., Hammond D. E., Clague M. J., and Prior I. A. (2008) Ras isoform abundance and signalling in human cancer cell lines. Oncogene 27, 2754–2762 [DOI] [PMC free article] [PubMed] [Google Scholar]
- 25. Uhlén M., Fagerberg L., Hallström B. M., Lindskog C., Oksvold P., Mardinoglu A., Sivertsson Å., Kampf C., Sjöstedt E., Asplund A., Olsson I., Edlund K., Lundberg E., Navani S., Szigyarto C. A., et al. (2015) Proteomics. Tissue-based map of the human proteome. Science 347, 1260419. [DOI] [PubMed] [Google Scholar]
- 26. Saqcena M., Menon D., Patel D., Mukhopadhyay S., Chow V., and Foster D. A. (2013) Amino acids and mTOR mediate distinct metabolic checkpoints in mammalian G1 cell cycle. PLoS ONE 8, e74157. [DOI] [PMC free article] [PubMed] [Google Scholar]
- 27. Fingar D. C., Richardson C. J., Tee A. R., Cheatham L., Tsou C., and Blenis J. (2004) mTOR controls cell cycle progression through its cell growth effectors S6K1 and 4E-BP1/eukaryotic translation initiation factor 4E. Mol. Cell. Biol. 24, 200–216 [DOI] [PMC free article] [PubMed] [Google Scholar]
- 28. Chatterjee A., Mukhopadhyay S., Tung K., Patel D., and Foster D. A. (2015) Rapamycin-induced G1 cell cycle arrest employs both TGF-β and Rb pathways. Cancer Lett. 360, 134–140 [DOI] [PMC free article] [PubMed] [Google Scholar]
- 29. Gadir N., Jackson D. N., Lee E., and Foster D. A. (2008) Defective TGF-β signaling sensitizes human cancer cells to rapamycin. Oncogene 27, 1055–1062 [DOI] [PubMed] [Google Scholar]
- 30. Betz C., and Hall M. N. (2013) Where is mTOR and what is it doing there? J. Cell Biol. 203, 563–574 [DOI] [PMC free article] [PubMed] [Google Scholar]
- 31. Betz C., Stracka D., Prescianotto-Baschong C., Frieden M., Demaurex N., and Hall M. N. (2013) Feature Article: mTOR complex 2-Akt signaling at mitochondria-associated endoplasmic reticulum membranes (MAM) regulates mitochondrial physiology. Proc. Natl. Acad. Sci. U.S.A. 110, 12526–12534 [DOI] [PMC free article] [PubMed] [Google Scholar]
- 32. Vance J. E. (2014) MAM (mitochondria-associated membranes) in mammalian cells: lipids and beyond. Biochim. Biophys. Acta 1841, 595–609 [DOI] [PubMed] [Google Scholar]
- 33. Raturi A., and Simmen T. (2013) Where the endoplasmic reticulum and the mitochondrion tie the knot: the mitochondria-associated membrane (MAM). Biochim. Biophys. Acta 1833, 213–224 [DOI] [PubMed] [Google Scholar]
- 34. Agarwal A. K., Sukumaran S., Cortés V. A., Tunison K., Mizrachi D., Sankella S., Gerard R. D., Horton J. D., and Garg A. (2011) Human 1-acylglycerol-3-phosphate O-acyltransferase isoforms 1 and 2: biochemical characterization and inability to rescue hepatic steatosis in Agpat2−/− gene lipodystrophic mice. J. Biol. Chem. 286, 37676–37691 [DOI] [PMC free article] [PubMed] [Google Scholar]
- 35. Boulbés D. R., Shaiken T., and Sarbassov dos D. (2011) Endoplasmic reticulum is a main localization site of mTORC2. Biochem. Biophys. Res. Commun. 413, 46–52 [DOI] [PMC free article] [PubMed] [Google Scholar]
- 36. Freyberg Z., Sweeney D., Siddhanta A., Bourgoin S., Frohman M., and Shields D. (2001) Intracellular localization of phospholipase D1 in mammalian cells. Mol. Biol. Cell 12, 943–955 [DOI] [PMC free article] [PubMed] [Google Scholar]
- 37. Riebeling C., Morris A. J., and Shields D. (2009) Phospholipase D in the Golgi apparatus. Biochim. Biophys. Acta 1791, 876–880 [DOI] [PMC free article] [PubMed] [Google Scholar]
- 38. Zhang C., Wendel A. A., Keogh M. R., Harris T. E., Chen J., and Coleman R. A. (2012) Glycerolipid signals alter mTOR complex 2 (mTORC2) to diminish insulin signaling. Proc. Natl. Acad. Sci. U.S.A. 109, 1667–1672 [DOI] [PMC free article] [PubMed] [Google Scholar]
- 39. Blaskovich M. A., Yendluri V., Lawrence H. R., Lawrence N. J., Sebti S. M., and Springett G. M. (2013) Lysophosphatidic acid acyltransferase β regulates mTOR signaling. PLoS ONE 8, e78632. [DOI] [PMC free article] [PubMed] [Google Scholar]
- 40. Bryant K. L., Mancias J. D., Kimmelman A. C., and Der C. J. (2014) KRAS: feeding pancreatic cancer proliferation. Trends Biochem. Sci. 39, 91–100 [DOI] [PMC free article] [PubMed] [Google Scholar]
- 41. Patel D., Menon D., Bernfeld E., Mroz V., Kalan S., Loayza D., and Foster D. A. (2016) Aspartate rescues S-phase arrest caused by suppression of glutamine utilization in KRas-driven cancer cells. J. Biol. Chem. 291, 9322–9329 [DOI] [PMC free article] [PubMed] [Google Scholar]
- 42. DeNicola G. M., Chen P. H., Mullarky E., Sudderth J. A., Hu Z., Wu D., Tang H., Xie Y., Asara J. M., Huffman K. E., Wistuba I. I., Minna J. D., DeBerardinis R. J., and Cantley L. C. (2015) NRF2 regulates serine biosynthesis in non-small cell lung cancer. Nat. Genet. 47, 1475–1481 [DOI] [PMC free article] [PubMed] [Google Scholar]
- 43. Hornberger T. A., Chu W. K., Mak Y. W., Hsiung J. W., Huang S. A., and Chien S. (2006) The role of phospholipase D and phosphatidic acid in the mechanical activation of mTOR signaling in skeletal muscle. Proc. Natl. Acad. Sci. U.S.A. 103, 4741–4746 [DOI] [PMC free article] [PubMed] [Google Scholar]