

Abstract
BACKGROUND
Current guidelines recommend diet and lifestyle modifications for primary prevention and treatment of hypertension, but do not encourage dietary pulses specifically for lowering blood pressure (BP). To quantify the effect of dietary pulse interventions on BP and provide evidence for their inclusion in dietary guidelines, a systematic review and meta-analysis of controlled feeding trials was conducted.
METHODS
MEDLINE, EMBASE, Cochrane Library, and CINAHL were each searched from inception through 5 May 2013. Human trials ≥3 weeks that reported data for systolic, diastolic, and/or mean arterial BPs were included. Two reviewers independently extracted data and assessed methodological quality and risk of bias of included studies. Effect estimates were pooled using random effects models, and reported as mean differences (MD) with 95% confidence intervals (CIs). Heterogeneity was assessed (χ2 test) and quantified (I2).
RESULTS
Eight isocaloric trials (n = 554 participants with and without hypertension) were included in the analysis. Dietary pulses, exchanged isocalorically for other foods, significantly lowered systolic (MD = −2.25 mm Hg (95% CI, −4.22 to −0.28), P = 0.03) and mean arterial BP (MD = −0.75 mm Hg (95% CI, −1.44 to −0.06), P = 0.03), and diastolic BP non-significantly (MD = −0.71 mm Hg (95% CI, −1.74 to 0.31), P = 0.17). Heterogeneity was significant for all outcomes.
CONCLUSIONS
Dietary pulses significantly lowered BP in people with and without hypertension. Higher-quality large-scale trials are needed to support these findings.
CLINICAL TRIAL REGISTRATION
Keywords: blood pressure, dietary pulses, hypertension, legumes, meta analysis, guidelines.
Elevated blood pressure (BP) is a significant risk factor for stroke, cardiovascular disease (CVD), and renal failure.1 Even before progressing to hypertension (systolic BP (SBP) ≥140mm Hg or diastolic BP (DBP) ≥90mm Hg), individuals with prehypertension (120mm Hg ≤ SBP ≤ 139mm Hg or 80mm Hg ≤ DBP ≤ 89mm Hg)1–3 are at an elevated risk of developing hypertension and its associated complications.4–6 The prevalence of prehypertension in North America is estimated to be 31%.7
The American Heart/Stroke Associations (AHA/ASA);8 the Seventh Report of the Joint National Committee on Prevention, Detection, Evaluation, and Treatment of High Blood Pressure (JNC7);1 the Canadian Hypertension Education Program;3 and the European Society for Hypertension9 recommend diet and lifestyle approaches as a primary means for prevention and treatment of hypertension. Each recommends increasing the intake of dietary pulses (low-fat, dry seeds of leguminous plants such as beans, peas, chickpeas, and lentils, which are distinct from leguminous high-fat oil seeds such as soy or peanuts)10 as part of a dietary approaches to stop hypertension (DASH) diet to lower BP. Dietary pulses are generally consumed whole as boiled, canned, or dried foods or are ground into flour and incorporated into baked goods. Dietary pulses have a low glycemic index and saturated fat content and are high in fiber, potassium, and plant protein, each of which independently confers BP-lowering effects.11–13 Whether there is sufficient evidence to emphasize dietary pulses alone to lower BP, however, is unclear. Therefore, to synthesize and quantify the effect of dietary pulses on BP, a systematic review and meta-analysis of controlled feeding trials were conducted.
METHODS
Design
The Cochrane Handbook for Systematic Reviews of Interventions was followed in conducting this meta-analysis.14 Results were reported according to the Preferred Reporting Items for Systematic Reviews and Meta-Analyses Guidelines.15 The protocol was registered at ClinicalTrials.gov (identifier: NCT01594567).
Study selection
Databases searched included MEDLINE, EMBASE, CINAHL, and the Cochrane Central Register of Controlled Clinical Trials, each from inception through 5 May 2013 (Supplementary Table S1). Using the search term “(pulses OR fabaceae OR lentil OR chickpea OR bean OR pea OR peas OR legume OR leguminous) AND (blood pressure OR BP OR SBP OR DBP OR mean arterial pressure OR MAP),” human randomized controlled clinical trials were identified. Manual searches of reference lists of included studies supplemented database searches. Eligible studies included randomized trials where dietary pulses constituted the majority (>50%) of the intervention, with a ≥3-week follow-up,16 and an adequate comparator of equivalent caloric value (isocaloric). Soy and peanut interventions were excluded as they are not classified as dietary pulses.
Data extraction
Three reviewers (V.H.J., V.H., R.J.d.S.) independently reviewed and extracted all trial characteristics and outcomes from each study selected for analysis using a standardized pro forma. Extracted data included authorship, publication year, study design (crossover vs. parallel), randomization (yes/no), blinding (single/double/no), level of feeding control (metabolic/partial metabolic/non-metabolic), sample size, participant characteristics (including age, health status, and sex), baseline BP, dietary pulse form (whole/powdered), dose (grams/day), comparator, follow-up duration, dietary macronutrient profiles of treatment group at end of intervention, and funding sources (agency/industry).
Each study was subjectively assessed for risk of 5 major biases using the Cochrane Risk of Bias Assessment tool (sequence generation, allocation concealment, blinding, outcome data, and reporting).14 The quality of each study was assessed using a modified Heyland methodological quality score (MQS), with an added point for metabolic feeding control (min = 1, max = 13); an MQS of ≥8 was considered high quality.17 Disagreements were resolved by consensus.
Since no studies directly reported MAP, it was calculated at baseline and end of study from SBP and DBP using  , and mean differences were then subtracted. The standard deviation (SD) was imputed as
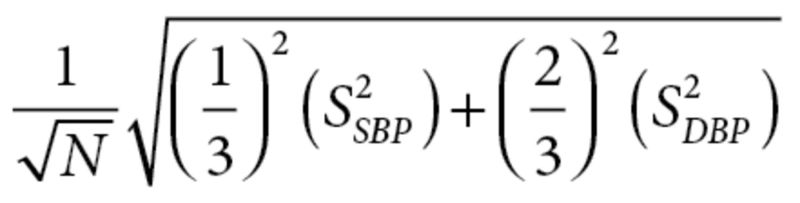 , where N = sample size and s = SDSBP/DBP, using the reported average SBP and DBP.18 Missing variance measures were calculated from reported P values, t statistics, or confidence intervals (CIs) if provided. If these values were not reported, variance measures were imputed using published formulae (Supplementary Table S2).14 Since between-treatment changes from baseline are optimal estimates of the true treatment effect,14 authors not providing these values were contacted to obtain them.
Statistical analyses
The co-primary outcomes were between-treatment mean differences in change from baseline SBP, DBP, and MAP. Pooled-effect estimates were generated using the generic inverse variance method with random effects models and expressed as mean change-from-baseline between-treatment differences (MDs) with 95% CIs (REVMAN v. 5.2). Descriptive statistics are provided as means ± SD. Paired analyses were applied to all crossover trials.14 To preserve power and mitigate unit-of-analysis error in 1 study with a 4-arm comparison,19 it was reduced to a single pairwise comparison using a weighted average of the 3 treatment means vs. control. The presence of interstudy heterogeneity was assessed with Cochrane Q (χ2) statistic at α <0.10 and quantified by the I2 statistic, where I2 ≥50% represented considerable heterogeneity. Sources of heterogeneity were explored using a priori subgroup analyses by mean reported baseline BP (normotensive vs. prehypertensive and as continuous BP), difference in dietary fiber intake between treatment and control arms, design (parallel vs. crossover), dose (<100g/d (~1 serving) or ≥100g/d; based on Diet and Lifestyle Recommendations of the AHA),20 duration (weeks), MQS (<8 or ≥8), and dietary pulse type (single dietary pulse vs. mixed dietary pulses). Meta-regression was used to assess the impact of these study-level covariates on the effect size. The impact of each individual study on the pooled effect estimate was explored in a sensitivity analysis in which each study was removed and the effect size recalculated. Publication bias was evaluated using 3 methods: visual inspection of funnel plots; assessment of the significance of the Egger weighted regression asymmetry and Begg and Mazumdar adjusted rank correlation tests; and Duval and Tweedie nonparametric “trim-and-fill” analyses, with P <0.10 considered evidence of small study effects. These were conducted using STATA 12 (StataCorp, College Station, TX).
RESULTS
Search results
Figure 1 summarizes the flow of literature during the search and study selection protocol. Of the 341 eligible reports identified, 8 articles reporting data from 8 isocaloric trials12,19,21–26 were included in the meta-analysis. The search did not retrieve any non-isocaloric trials.
Figure 1.

Flow diagram of the literature search. The search identified 341 reports, 326 of which were determined to be irrelevant based on review of titles and abstracts. The remaining 15 reports were reviewed in full. Eight reports providing data for 8 trials of isocaloric comparisons were included in the analysis.
Trial characteristics
Trial characteristics are provided in Table 1. The 8 trials included 554 participants, of which 215 participants were overweight or obese,21,23–25 121 were individuals living with diabetes,12 119 had features of metabolic syndrome,22 and 103 were without apparent disease at baseline.19,26 The median age of participants was 49 years (range: 28–60 years). All trials were randomized, and all but 2 trials19,26 used a parallel design. No trials were metabolically controlled. Cooked dietary pulse dose averaged 162g/d (12/3 servings/day; range: 81g/d–275g/d), and most interventions involved the incorporation of a mixture of dietary pulses into the diet,12,19,21–23,26 while 2 implemented a single dietary pulse intervention (i.e., chickpeas or lupin only).24,25 Most trials12,21–23,26 incorporated whole dietary pulses, while 3 trials19,24,25 used dried and powdered dietary pulses. The increase in fiber intake was greater in treatment arms compared with control arms (median between treatment difference: 10g/d (range: 5g/d–14g/d)), and the typical macronutrient profile at the end of follow-up of the dietary pulse interventions was 46% energy from carbohydrate, 21% from protein, and 32% from fat. Dietary pulses were substituted for isocaloric diets without dietary pulses,21–23 whole-meal flour,24 a high-fiber diet,12 white bread,25 or potato flakes.19 The median duration of follow-up was 10 weeks (range: 4–52 weeks). The Heyland MQS was considered low (MQS <8) in 63% of trials. Poor description of protocol, non-consecutive or poorly described patient selection, and absence of double blinding contributed to lower scores (Supplementary Table S3). Individual trials were judged as being at low or unclear risk of bias for the majority of domains measured by the Cochrane Risk of Bias tool (Supplementary Table S4). Three studies measured BP after 5min of sitting time, 2 measured 24-h ambulatory measures using automated sphygmomanometers, and 3 reported the average of 3 or more measures using automated sphygmomanometers. Funding of all trials was from agency alone (50%), agency–industry sources (37%), or industry alone (13%). All but 1 trialist19 declared no potential conflict of interests.
Table 1.
Trial characteristics
| Study | Subjectsa | Age | Design | Baseline blood pressure (mm Hg) | Metabolicb | Randomization | Dose (g/d)c | Dietary fiber(g/d)d | Pulse forme | |
|---|---|---|---|---|---|---|---|---|---|---|
| Abete et al.,21 | 18 OB [100%] (18M:0F) | 37.2±8.0 | P | 121/79 | No | Yes | 113 | 26±5 (6) | Whole | |
| Abeysekara et al.,26 | 87 N [94%] (30M:57F) | 59.7±6.3 | C | 123/78 | No | Yes | 250 | 30±15 (8) | Pulse-based meals | |
| Belski et al.,24 | 131 OW/OB [71%] (68M:63F) | 46.6±9.7 | P | 122/75 | Partial | Yes | 123 | 39±12 (14) | Powder (flour enriched [~32%]) | |
| Gravel et al.,22 | 132 Pre-MetSyn [87%] (0M:132F) | 51.3±8.6 | P | 120/76 | Partial | Yes | 81 | 23±10 (5) | Whole | |
| Hermsdorff et al.,23 | 30 OB [100%] (17M:13F) | 36.0±8.0 | P | 115/76 | No | Yes | 113 | 26±6 (8) | Whole | |
| Jenkins et al.,12 | 121 DM2 [100%] (61M:60F) | 59.5±9.0 | P | 122/72 | No | Yes | 211 | 38±11 (12) | Whole | |
| Lee et al.,25 | 74 OW/OB [100%] (26M:48F) | 57.9±8.0 | P | 126/76 | Partial | Yes | 132 | 36±10 (12) | Powder (flour enriched [~40%]) | |
| Veenstra et al.,19 | 26 N [81%] (26M:0F) | 28.1±5.9 | C | 127/78 | Partial | Yes | 275 | 38 (14) | Powder | |
| Study | Pulse type | Comparatorf | Blood pressure measurement | Diet (CHO/PRO/ FAT, % E)g | Methodological quality score | Follow-up | Funding sourceh | |||
|---|---|---|---|---|---|---|---|---|---|---|
| Abete et al.,21 | Varied pulses (lentils, chickpeas, peas, beans) | Isocaloric diet lacking legume/fatty fish | Standard mercury sphygmomanometer after the participant was quietly sitting for 5 minutes | 51.7/18.7/32.4 | 7 | 8 weeks | Agency | |||
| Abeysekara et al.,26 | Varied pulses (lentils, chickpeas, peas, beans) | Regular diet | Measured after the participant was in a comfortable seated position for 5 minutes | ~49.0/15.9/36.7 | 6 | 8 weeks | Agency-Industry | |||
| Belski et al.,24 | Lupin kernel | Isocaloric whole-meal flour | 24-hour ambulatory measurements from automated sphygmomanometer | ~39.0/22.5/31.7 | 8 | 1 year | Agency | |||
| Gravel et al.,22 | Varied pulses (lentils, chickpeas, peas, beans) | Isocaloric meal lacking pulses | Mean of 3 measurements with a 1-minute interval between each measurement | ~49.2/17.2/33.3 | 6 | 16 weeks | Industry | |||
| Hermsdorff et al.,23 | Varied pulses (lentils, chickpeas, peas, beans) | Isocaloric legume-free diet | Following World Health Organization criteria | 50.7/18.9/30.8 | 8 | 8 weeks | Agency | |||
| Jenkins et al.,12 | Varied pulses (lentils, chickpeas, peas, beans) | Isocaloric high–wheat fiber diet | Seated triplicate measures by automated sphygmomanometer | 47.0/22.7/30.3 | 8 | 12 weeks | Agency-Industry | |||
| Lee et al.,25 | Lupin kernel | Isocaloric white bread | 24-hour ambulatory measurements from automated sphygmomanometer | 38.9/24.3/30.9 | 7 | 16 weeks | Agency | |||
| Veenstra et al.,19 | Varied pulses (lentils, chickpeas, peas, beans) | Potatoe flakes | Duplicate measures using a digital sphygmomanometer | 54.7/17.3/28.3 | 6 | 29 days | Agency-Industry | |||
Abbreviations: C, crossover; P, parallel; M, male; F, female; N, normal; OB, obese; OW, overweight; Pre-MetSyn, premetabolic syndrome; DM2, type 2 diabetes.
a Numbers within brackets represent percentage of subjects included in the analysis as trial completers.
b Partial, some food was prepared and provided by investigators; no, no foods were prepared or given to patients, only dietary advice was provided.
c Obtained values are for treatment diet. Values are approximate or manually derived. All gram values represent cooked pulses. Doses provided in mL were converted to grams using 1mL = 0.76-g pulse; doses provided as dry weight were converted to cooked weight using a conversion factor of 2.75 [http://archive.saskpulse.com/consumer/recipes/index.php?page=8].
d Obtained values are for treatment diet. Values within parentheses indicate between-treatment end differences.
e Pulses were provided as follows: 1, whole cooked/canned for direct consumption; 2, powdered, cooked, and dehydrated in order to use in baked goods (flour-enriched (percent pulse of final weight)).
f Non-pulse controlled diet.
g Obtained values are for treatment diet at end of treatment. (CHO: % energy from carboyhdrate; PRO: % energy from protein; FAT: % energy from fat).
h Agency funding is from government, university, or not-for-profit health agency sources.
Dietary pulses for BP
Figure 2 shows the overall effect of dietary pulse consumption on SBP, DBP, and MAP. Consumption of dietary pulses significantly reduced SBP (MD = −2.25mm Hg (95% CI, −4.22 to −0.28), P = 0.03) and MAP (MD = −0.75mm Hg (95% CI to −1.44 to −0.06), P = 0.03), and reduced DBP nonsignificantly (MD = −0.74mm Hg (95% CI, −1.74 to 0.31), P = 0.17). Significant between-study heterogeneity was observed for SBP (χ2 = 25.73, I2 = 73%), DBP (χ2 = 16.86, I2 = 58%), MAP (χ2 = 383.78, I2 = 98%).
Figure 2.
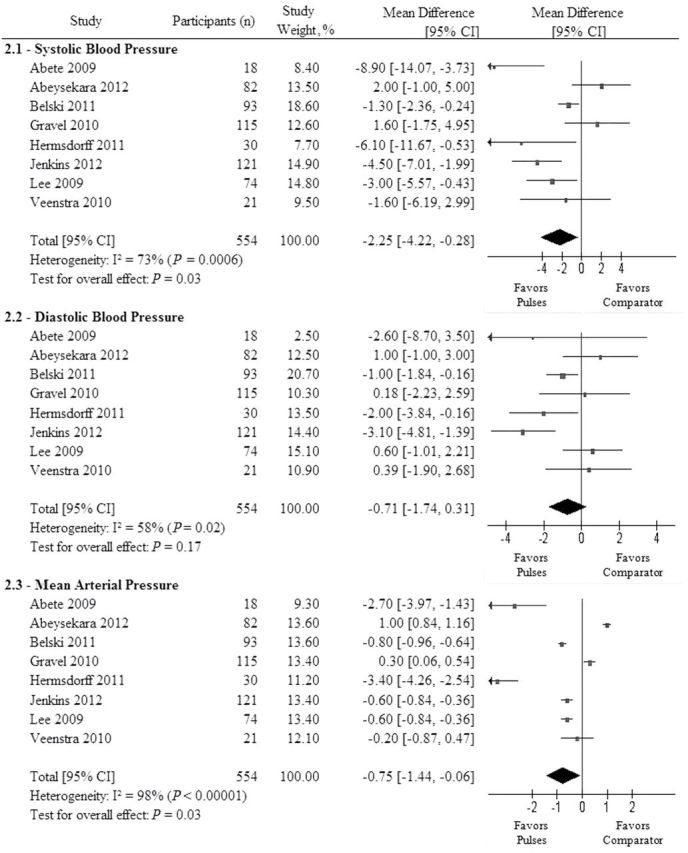
Forest plot of clinical trials investigating the effect of isocaloric exchange of dietary pulses for other adequate comparators on systolic blood pressure (SBP; 2.1), diastolic blood pressure (DBP; 2.2), and mean arterial pressure (MAP; 2.3). The pooled effect estimate is represented as a diamond. Data are represented as mean differences (MDs) with 95% confidence intervals (CIs). P values are for generic inverse variance random effects models. Interstudy heterogeneity was assessed via Cochrane Q (χ2) at a significance level of P <0.10 and quantified by I2, where I2 >50% was considered to be evidence of substantial heterogeneity.
Sensitivity and a priori subgroup analyses
Sensitivity analyses of systematically removing each study from the overall analysis and recalculating the summary effect for SBP revealed that removal of Abeysekara et al.,26 Gravel et al.,22 or Veenstra et al.,19 improved the observed beneficial effects (MD = −2.88mm Hg, P = 0.005; −2.79mm Hg, P = 0.007; −2.35mm Hg, P = 0.03, respectively); removal of all other studies eliminated significance in SBP. Sensitivity analyses did not modify the overall effect or the heterogeneity in DBP. Removal of Abete et al.,21 and Hermsdorff et al.,23 eliminated the significance in MAP.
Subgroup analyses by baseline BP, study design, dose, study duration, change in fiber, or pulse type neither modified the effect nor reduced the heterogeneity for the effect of dietary pulses on any BP outcome under continuous and dichotomous models (Supplementary Table S5; Supplementary Figures S1–S3). The subgroup analysis by MQS (<8 vs. ≥8) for DBP significantly modified the overall effect (between-subgroup MD: −2.19mm Hg (95% CI, −4.03 to −0.35), residual I2 = 5.4%, P = 0.03), favoring higher-quality trials. The MD in DBP between pulses and control was positively associated with baseline DBP (β = 0.56 (0.09 to 1.04) per 1 mmHg, residual I2 = 14.6%, P = 0.03).
Publication bias
Egger and Begg tests did not reveal significant evidence of publication bias in any of the analyses, and visual inspection of the funnel plot revealed no obvious asymmetry (Supplementary Figures S4.A–S6.A). The trim-and-fill analysis for SBP and DBP did not identify any potentially missed studies due to publication bias; however, a minor asymmetry in the funnel plot for MAP was identified, and 1 more study was “filled” in to mitigate publication bias. With the inclusion of the “filled” study, the MD for MAP was −1.05mm Hg (95% CI, −2.05 to −0.05, P = 0.04; Supplementary Figures S4.B–S6.B).
DISCUSSION
This systematic review and meta-analysis of 8 isocaloric dietary pulse intervention trials in 554 participants support existing dietary guidelines to increase the intake of dietary pulses (beans, peas, chickpeas, and lentils) as part of a dietary strategy to achieve optimal BP.1,3 A median of 12/3 servings/day (~162g/d) of dietary pulses significantly lowered SBP by 2.25mm Hg and MAP by 0.75mm Hg over a median 10-week follow-up in middle-age participants with or without hypertension in the context of a range of metabolic phenotypes (normal weight, overweight, obese, premetabolic syndrome, and type 2 diabetes).
These results are consistent with those reported in large observational studies.11,27,28 The 1999–2002 National Health and Nutrition Examination Survey (NHANES) found that adults in the United States who consumed approximately ½ cup (1 serving) of cooked dry beans or peas had higher intakes of fiber, protein, folate, zinc, iron, and magnesium and lower intakes of saturated and total fat.29 A secondary analysis of the NHANES data found that consumers of varied beans had lower odds of elevated BP and a 1.7-mm Hg lower mean SBP than non-consumers.27 Additionally, the NHANES Epidemiologic Follow-up Study found a 22% and 11% lower risk of coronary heart disease and CVD, respectively, with the consumption of legumes 4 times a week;28 both of which highly correlate with BP.
Dietary pulses may lower BP through several mechanisms. Dietary pulses are high in dietary fiber, plant protein, and potassium, all of which confer BP-lowering effects.11,13 In the Optimal Macronutrient Intake Heart study,30 the replacement of carbohydrates with protein lowered BP. However, since the diets in this meta-analysis were generally matched for protein, the observed effects cannot be ascribed to a protein for carbohydrate substitution. Notably, the possibility of a beneficial effect of replacing animal protein with plant protein from dietary pulses cannot be eliminated.31 Moreover, replacing high-starch foods with dietary pulses, which have a low glycemic index, can facilitate weight loss,32 likely contributing to BP reduction. Indeed, in a post-hoc meta-regression, SBP and MAP decreases were found to be linearly associated with weight loss ((βSBP = −3.32mm Hg; 95% CI: −5.95 to −0.69, P = 0.02) and (βMAP = −1.07mm Hg; 95% CI: −1.77 to −0.37, P = 0.01), for every 1-kg of weight lost), supporting the assertion that the weight loss associated with dietary pulse consumption contributed to the BP reductions.
The BP reductions observed in the present analysis were greater than those observed when comparing the DASH fruits and vegetables–only arm with the control arm in non-hypertensive participants (−2.3mm Hg vs. −0.8mm Hg for SBP and −0.7mm Hg vs. −0.3mm Hg for DBP, respectively).33 These results suggest that diets which emphasize dietary pulses alone or as part of a heart-healthy diet based on a DASH dietary pattern may benefit BP. Increasing dietary pulse consumption from the current average American intake (0.1–0.3 servings/day (10–30g/d)29 to the amount used in the included trials (mean approximate, 12/3 servings/day (162g/d) would be expected to result in a clinically significant decrease in BP. At the population level, an overall mean reduction of 2.25mm Hg in SBP may potentially ameliorate the risk of mortality from stroke, ischemic heart disease, and other vascular causes in the average middle-aged population.34 However, an analysis of the Nurses’ Health Study and the Health Professionals Follow-Up Study data found that legume protein (from dry beans, peas, soy, and tofu) was associated with an increased risk of ischemic stroke (RR, 1.45; 95% CI, 1.06–2.00).35 The reasons for this are unclear, and additional research is required to assess the effect of dietary pulses on CVD events, such as stroke.
Individuals with prehypertension are at greater risk for cardiovascular events than normotensive individuals.5,36,37 JNC7 recommends diet and lifestyle modifications as the first line of treatment of prehypertensive individuals.1 In addition, a recent Cochrane Review suggests the inadequacy of antihypertensives in the treatment of mild hypertension.38 Thus, BP reductions through dietary interventions may lead to modest improvements in cardiovascular outcomes.12 Consistently, a diet high in dietary pulses (12/3 servings/day) may offer a strategy to manage prehypertension39 and mild hypertension38 when supplementing pharmacological agents. Whereas adverse effects from antihypertensive drugs may be problematic,40 only a few participants on high dietary pulse diets experienced any discomfort.
Six of 8 included trials favored dietary pulses for lowering SBP. The 2 exceptions, Abeysekara et al., and Gravel et al., were conducted under ad libitum feeding, free-living conditions, and the participants of Gravel et al., were already achieving the generally recommended dietary fiber intake.22,26 Although statistically significant SBP- and MAP-lowering effects were found, the possibility that the effect of dietary pulses may be variable cannot be discounted, as a high amount of heterogeneity that could not be explained by study-level characteristics was observed.
Publication bias was rigorously evaluated. Although we found no evidence of publication bias in either the SBP or DBP analyses, it must be noted that with <10 studies, we are likely underpowered for formal tests. Nevertheless, a minor asymmetry in the funnel plot for MAP was identified in the trim-and-fill analysis. Although suggestive of publication bias, it is noteworthy that none of the MAP values were directly provided in any of the studies; and the optimal equation for deriving MAP is a subject of ongoing debate.41
Several limitations of this meta-analysis should be acknowledged. First, only 2 of 8 studies assessed BP as a primary endpoint; thus, the included trials might have been underpowered to detect a BP difference. In addition, although no subgroup effects were observed, the small number of studies limited the power to detect these differences. Second, the effect of sodium or other micronutrients were not investigated in any of the trials included in this meta-analysis. Since sodium, potassium, magnesium, and calcium influence BP,42 variations in these nutrients among diets may have influenced the overall effect size, particularly because dietary pulses may be purchased in a high-sodium canned form. Third, quality was poor (MQS <8), and risk of bias was unclear in the majority of trials. However, the observed effect modifications by study quality suggest a greater DBP reduction in higher-quality studies. Fourth, the relatively small sample size (n = 554) and heterogeneous disease phenotypes, doses, and durations limit the overall generalizability of these results. Last, most participants included in this meta-analysis were aged <60 years, thus these results provide limited information regarding the effects of dietary pulses on BP in older, higher-risk individuals.1
This is the first systematic review and meta-analysis to quantitatively synthesize the effect of dietary pulses on BP. Pooled analyses found a significant BP-lowering effect of dietary pulses in predominantly middle-age people with and without hypertension. Dietary pulse intake in Western countries is well below that consumed in the available trials. To achieve BP reductions similar to those observed in this systematic review and meta-analysis, an increase in consumption of at least 2 servings (1 cup) above current average intakes (0.1–0.3 servings/day) would need to be recommended. These findings, however, are limited by several design issues and the poor quality of the available trials. There is a need for larger and higher-quality long-term randomized controlled trials in different demographics to confirm these findings in normotensive, prehypertensive, and hypertensive individuals.
DISCLOSURE
This work was supported by a Canadian Institutes of Health Research (CIHR) Knowledge Synthesis grant. VH and AC were supported by Province of Ontario Graduate Scholarships. RJD was funded by a CIHR Postdoctoral Fellowship Award. DJAJ was funded by the Government of Canada through the Canada Research Chair Endowment. None of the sponsors had a role in any aspect of the present study, including design and conduct of the study; collection, management, analysis, and interpretation of the data; and preparation, review, and approval of the manuscript. J.B. has received research support from the CIHR, the National Sciences and Engineering Council of Canada (NSERC), Calorie Control Council, and the Coca-Cola Company (investigator initiated, unrestricted) R.J.D. has received research support from the CIHR, the Calorie Control Council, and The Coca-Cola Company (investigator-initiated, unrestricted grant). He has served as an external resource person to the WHO’s Nutrition Guidelines Advisory Group (NUGAG) and was the lead author of a systematic review and meta-analysis commissioned by the WHO of trans fatty acids and health outcomes. The WHO paid for his travel and accommodation to attend the Fifth NUGAG Meeting in Hangzhou, China (4–7 March 2013). J.L.S. has received research support from the Canadian Institutes of health Research (CIHR), Calorie Control Council, The Coca-Cola Company (investigator initiated, unrestricted grant), Pulse Canada, and The International Tree Nut Council Nutrition Research & Education Foundation. He has received travel funding, speaker fees, and/or honoraria from the American Heart Association (AHA), American College of Physicians (ACP), American Society for Nutrition (ASN), National Institute of Diabetes and Digestive and Kidney Diseases (NIDDK) of the National Institutes of Health (NIH), Canadian Diabetes Association (CDA), Canadian Nutrition Society (CNS), Calorie Control Council, Diabetes and Nutrition Study Group (DNSG) of the European Association for the Study of Diabetes (EASD), International Life Sciences Institute (ILSI) North America, International Life Sciences Institute (ILSI) Brazil, Abbott Laboratories, Pulse Canada, Dr. Pepper Snapple Group, and The Coca-Cola Company. He is on the Clinical Practice Guidelines Expert Committee for Nutrition Therapy of both the Canadian Diabetes Association (CDA) and European Association for the study of Diabetes (EASD), as well as being on the American Society for Nutrition (ASN) writing panel for a scientific statement on the metabolic and nutritional effects of fructose, sucrose and high fructose corn syrup. He is an unpaid scientific advisor for the International Life Science Institute (ILSI) North America, Food, Nutrition, and Safety Program (FNSP). His wife is an employee of Unilever Canada. A.M. has received research support from the CIHR. L.C. has received research support from the CIHR and works as a casual Clinical Research Coordinator at GI Laboratories, Toronto, Ontario, Canada. C.W.C.K. has received consultant fees, honoraria, travel funding, or research support from or served on the scientific advisory board for the CIHR, Calorie Control Council, the Coca Cola Company (investigator initiated, unrestricted), Abbott Laboratories, Advanced Food Materials Network, Almond Board of California, American Peanut Council, American Pistachio Growers, Barilla, California Strawberry Commission, Canola Council of Canada, Danone, General Mills, Hain Celestial, International Tree Nut Council, Kellogg, Loblaw Brands Ltd, Oldways, Orafti, Paramount Farms, Pulse Canada, Saskatchewan Pulse Growers, Solae, and Unilever. D.J.A.J. has received consultant fees, honoraria, travel funding, or research support from or served on the scientific advisory board for the CIHR, Canadian Foundation for Innovation, Ontario Research Fund, Advanced Foods and Material Network Calorie Control Council, the Coca Cola Company (investigator initiated, unrestricted), Barilla, Solae, Unilever, Hain Celestial, Loblaws Supermarkets Inc., Sanitarium Company, Herbalife International, Pacific Health Laboratories Inc., Metagenics/MetaProteomics, Bayer Consumer Care, Oldways Preservation Trust, International Tree Nut Council Nutrition Research and Education, the Peanut Institute, Procter and Gamble Technical Centre Limited, Griffin Hospital for the development of the NuVal System, Soy Advisory Board of Dean Foods, Alpro Soy Foundation, Nutritional Fundamentals for Health, Pacific Health Laboratories, Kellogg’s, Quaker Oats, the Coca-Cola Sugar Advisory Board, Pepsi Company, Agrifoods and Agriculture Canada, Canadian Agriculture Policy Institute, the Almond Board of California, the California Strawberry Commission, Orafti, the Canola and Flax councils of Canada, Pulse Canada, the Saskatchewan Pulse Growers, and Abbott Laboratories. V.V. holds the Canadian (2,410,556) and American (7,326.404) patent on medical use of viscous fiber blend for reducing blood glucose for treatment of diabetes, increasing insulin sensitivity, and reducing SBP and blood lipids; is the vice president and part owner of Glycemic Index Laboratories Inc., a clinical research organization; and has received an in-kind donation of chia (in 2000) and salba (2001, 2009, 2011) seeds for research and partial grant funding from companies that grow and distribute these products. V.H.J., M.D., A.M.B., L.A.L., and P.M.K. have no declared conflicts of interest related to this paper.
Supplementary Material
REFERENCES
- 1. Chobanian AV, Bakris GL, Black HR, Cushman WC, Green LA, Izzo JL, Jr., Jones DW, Materson BJ, Oparil S, Wright JT, Jr., Roccella EJ. The seventh report of the Joint National Committee on Prevention, Detection, Evaluation, and Treatment of High Blood Pressure: the JNC 7 report. JAMA 2003; 289:2560–2572. [DOI] [PubMed] [Google Scholar]
- 2. Whelton PK, He J, Appel LJ, Cutler JA, Havas S, Kotchen TA, Roccella EJ, Stout R, Vallbona C, Winston MC, Karimbakas J. Primary prevention of hypertension: clinical and public health advisory from the national high blood pressure education program. JAMA 2002; 288:1882–1888. [DOI] [PubMed] [Google Scholar]
- 3. Hackam DG, Quinn RR, Ravani P, Rabi DM, Dasgupta K, Daskalopoulou SS, Khan NA, Herman RJ, Bacon SL, Cloutier L, Dawes M, Rabkin SW, Gilbert RE, Ruzicka M, McKay DW, Campbell TS, Grover S, Honos G, Schiffrin EL, Bolli P, Wilson TW, Feldman RD, Lindsay P, Hill MD, Gelfer M, Burns KD, Vallee M, Prasad GV, Lebel M, McLean D, Arnold JM, Moe GW, Howlett JG, Boulanger JM, Larochelle P, Leiter LA, Jones C, Ogilvie RI, Woo V, Kaczorowski J, Trudeau L, Petrella RJ, Milot A, Stone JA, Drouin D, Lavoie KL, Lamarre-Cliche M, Godwin M, Tremblay G, Hamet P, Fodor G, Carruthers SG, Pylypchuk GB, Burgess E, Lewanczuk R, Dresser GK, Penner SB, Hegele RA, McFarlane PA, Sharma M, Reid DJ, Tobe SW, Poirier L, Padwal RS. The 2013 Canadian Hypertension Education Program recommendations for blood pressure measurement, diagnosis, assessment of risk, prevention, and treatment of hypertension. Can J Cardiol 2013; 29:528–542. [DOI] [PubMed] [Google Scholar]
- 4. Vasan RS, Larson MG, Leip EP, Kannel WB, Levy D. Assessment of frequency of progression to hypertension in non-hypertensive participants in the Framingham Heart Study: a cohort study. Lancet 2001; 358:1682–1686. [DOI] [PubMed] [Google Scholar]
- 5. Liszka HA, Mainous AG, 3rd, King DE, Everett CJ, Egan BM. Prehypertension and cardiovascular morbidity. Ann Fam Med 2005; 3:294–299. [DOI] [PMC free article] [PubMed] [Google Scholar]
- 6. Law MR, Morris JK, Wald NJ. Use of blood pressure lowering drugs in the prevention of cardiovascular disease: meta-analysis of 147 randomised trials in the context of expectations from prospective epidemiological studies. BMJ 2009; 338:b1665. [DOI] [PMC free article] [PubMed] [Google Scholar]
- 7. Wang Y, Wang QJ. The prevalence of prehypertension and hypertension among us adults according to the new Joint National Committee guidelines: new challenges of the old problem. Arch Intern Med 2004; 164:2126–2134. [DOI] [PubMed] [Google Scholar]
- 8. Goldstein LB, Bushnell CD, Adams RJ, Appel LJ, Braun LT, Chaturvedi S, Creager MA, Culebras A, Eckel RH, Hart RG, Hinchey JA, Howard VJ, Jauch EC, Levine SR, Meschia JF, Moore WS, Nixon JV, Pearson TA. Guidelines for the primary prevention of stroke: a guideline for healthcare professionals from the American Heart Association/American Stroke Association. Stroke 2011; 42:517–584. [DOI] [PubMed] [Google Scholar]
- 9. Mancia G, Fagard R, Narkiewicz K, Redon J, Zanchetti A, Bohm M, Christiaens T, Cifkova R, De Backer G, Dominiczak A, Galderisi M, Grobbee DE, Jaarsma T, Kirchhof P, Kjeldsen SE, Laurent S, Manolis AJ, Nilsson PM, Ruilope LM, Schmieder RE, Sirnes PA, Sleight P, Viigimaa M, Waeber B, Zannad F. 2013 ESH/ESC guidelines for the management of arterial hypertension: the Task Force for the Management of Arterial Hypertension of the European Society of Hypertension (ESH) and of the European Society of Cardiology (ESC). J Hypertension 2013; 31:1281–1357. [DOI] [PubMed] [Google Scholar]
- 10. Joint WHO/FAO Committee. Cereals, pulses, legumes and vegetable proteins. 2007. Retrieved from: ftp://ftp.fao.org/codex/Publications/Booklets/Cereals/CEREALS_2007_EN.pdf.
- 11. He J, Whelton PK. Effect of dietary fiber and protein intake on blood pressure: a review of epidemiologic evidence. Clin Exp Hypertens 1999; 21:785–796. [DOI] [PubMed] [Google Scholar]
- 12. Jenkins DJ, Kendall CW, Augustin LS, Mitchell S, Sahye-Pudaruth S, Blanco Mejia S, Chiavaroli L, Mirrahimi A, Ireland C, Bashyam B, Vidgen E, de Souza RJ, Sievenpiper JL, Coveney J, Leiter LA, Josse RG. Effect of legumes as part of a low glycemic index diet on glycemic control and cardiovascular risk factors in type 2 diabetes mellitus: a randomized controlled trial. Arch Intern Med 2012; 172:1653–1660. [DOI] [PubMed] [Google Scholar]
- 13. Lee YP, Puddey IB, Hodgson JM. Protein, fibre and blood pressure: potential benefit of legumes. Clin Exp Pharmacol Physiol 2008; 35:473–476. [DOI] [PubMed] [Google Scholar]
- 14. Higgins JPT, Green S, Cochrane Collaboration. Cochrane handbook for systematic reviews of interventions. Cochrane Book Series 2008:xxi, 649 p. [Google Scholar]
- 15. Moher D, Liberati A, Tetzlaff J, Altman DG. Preferred reporting items for systematic reviews and meta-analyses: the Prisma Statement. PLoS Med 2009; 6:e1000097. [DOI] [PMC free article] [PubMed] [Google Scholar]
- 16. US Food and Drug Administration. Guidance for Industry: Evidence-Based Review System for the Scientific Evaluation of Health Claims - Final. Retrieved from: Date Published: January 2009. http://www.fda.gov/Food/GuidanceRegulation/GuidanceDocumentsRegulatoryInformation/LabelingNutrition/ucm073332.htm.
- 17. Heyland DK, Novak F, Drover JW, Jain M, Su X, Suchner U. Should immunonutrition become routine in critically ill patients? A systematic review of the evidence. JAMA 2001; 286:944–953. [DOI] [PubMed] [Google Scholar]
- 18. Ha V, Sievenpiper JL, de Souza RJ, Chiavaroli L, Wang DD, Cozma AI, Mirrahimi A, Yu ME, Carleton AJ, Dibuono M, Jenkins AL, Leiter LA, Wolever TM, Beyene J, Kendall CW, Jenkins DJ. Effect of fructose on blood pressure: a systematic review and meta-analysis of controlled feeding trials. Hypertension 2012; 59:787–795. [DOI] [PubMed] [Google Scholar]
- 19. Veenstra JM, Duncan AM, Cryne CN, Deschambault BR, Boye JI, Benali M, Marcotte M, Tosh SM, Farnworth ER, Wright AJ. Effect of pulse consumption on perceived flatulence and gastrointestinal function in healthy males. Food Research International 2010; 43:553–559. [Google Scholar]
- 20. Lichtenstein AH, Appel LJ, Brands M, Carnethon M, Daniels S, Franch HA, Franklin B, Kris-Etherton P, Harris WS, Howard B, Karanja N, Lefevre M, Rudel L, Sacks F, Van Horn L, Winston M, Wylie-Rosett J. Diet and lifestyle recommendations revision 2006: a scientific statement from the American Heart Association Nutrition Committee. Circulation 2006; 114:82–96. [DOI] [PubMed] [Google Scholar]
- 21. Abete I, Parra D, Martinez JA. Legume-, fish-, or high-protein-based hypocaloric diets: effects on weight loss and mitochondrial oxidation in obese men. J Med Food 2009; 12:100–108. [DOI] [PubMed] [Google Scholar]
- 22. Gravel K, Lemieux S, Asselin G, Dufresne A, Lemay A, Forest J-C, Dodin S. Effects of pulse consumption in women presenting components of the metabolic syndrome: a randomized controlled trial. Med J Nutrition Metab 2010; 3:143–151. [Google Scholar]
- 23. Hermsdorff HH, Zulet MA, Abete I, Martinez JA. A legume-based hypocaloric diet reduces proinflammatory status and improves metabolic features in overweight/obese subjects. Eur J Nutr 2011; 50:61–69. [DOI] [PubMed] [Google Scholar]
- 24. Belski R, Mori TA, Puddey IB, Sipsas S, Woodman RJ, Ackland TR, Beilin LJ, Dove ER, Carlyon NB, Jayaseena V, Hodgson JM. Effects of lupin-enriched foods on body composition and cardiovascular disease risk factors: a 12-month randomized controlled weight loss trial. Int J Obes (Lond) 2011; 35:810–819. [DOI] [PubMed] [Google Scholar]
- 25. Lee YP, Mori TA, Puddey IB, Sipsas S, Ackland TR, Beilin LJ, Hodgson JM. Effects of lupin kernel flour-enriched bread on blood pressure: a controlled intervention study. Am J Clin Nutr 2009; 89:766–772. [DOI] [PubMed] [Google Scholar]
- 26. Abeysekara S, Chilibeck PD, Vatanparast H, Zello GA. A pulse-based diet is effective for reducing total and ldl-cholesterol in older adults. Br J Nutr 2012; 108(Suppl 1):S103–110. [DOI] [PubMed] [Google Scholar]
- 27. Papanikolaou Y, Fulgoni VL., 3rd Bean consumption is associated with greater nutrient intake, reduced systolic blood pressure, lower body weight, and a smaller waist circumference in adults: results from the National Health and Nutrition Examination Survey 1999–2002. J Am Coll Nutr 2008; 27:569–576. [DOI] [PubMed] [Google Scholar]
- 28. Bazzano LA, He J, Ogden LG, Loria C, Vupputuri S, Myers L, Whelton PK. Legume consumption and risk of coronary heart disease in us men and women: NHANES i epidemiologic follow-up study. Arch Intern Med 2001; 161:2573–2578. [DOI] [PubMed] [Google Scholar]
- 29. Mitchell DC, Lawrence FR, Hartman TJ, Curran JM. Consumption of dry beans, peas, and lentils could improve diet quality in the us population. J Am Diet Assoc 2009; 109:909–913. [DOI] [PubMed] [Google Scholar]
- 30. Appel LJ, Sacks FM, Carey VJ, Obarzanek E, Swain JF, Miller ER, 3rd, Conlin PR, Erlinger TP, Rosner BA, Laranjo NM, Charleston J, McCarron P, Bishop LM. Effects of protein, monounsaturated fat, and carbohydrate intake on blood pressure and serum lipids: results of the OMNIheart randomized trial. JAMA 2005; 294:2455–2464. [DOI] [PubMed] [Google Scholar]
- 31. Altorf-van der Kuil W, Engberink MF, Brink EJ, van Baak MA, Bakker SJ, Navis G, van ‘t Veer P, Geleijnse JM. Dietary protein and blood pressure: a systematic review. PLoS One 2010; 5:e12102. [DOI] [PMC free article] [PubMed] [Google Scholar]
- 32. Sievenpiper JL, Kendall CW, Esfahani A, Wong JM, Carleton AJ, Jiang HY, Bazinet RP, Vidgen E, Jenkins DJ. Effect of non-oil-seed pulses on glycaemic control: a systematic review and meta-analysis of randomised controlled experimental trials in people with and without diabetes. Diabetologia 2009; 52:1479–1495. [DOI] [PubMed] [Google Scholar]
- 33. Appel LJ, Moore TJ, Obarzanek E, Vollmer WM, Svetkey LP, Sacks FM, Bray GA, Vogt TM, Cutler JA, Windhauser MM, Lin PH, Karanja N. A clinical trial of the effects of dietary patterns on blood pressure. DASH collaborative research group. NEJM 1997; 336:1117–1124. [DOI] [PubMed] [Google Scholar]
- 34. Lewington S, Clarke R, Qizilbash N, Peto R, Collins R. Age-specific relevance of usual blood pressure to vascular mortality: a meta-analysis of individual data for one million adults in 61 prospective studies. Lancet 2002; 360:1903–1913. [DOI] [PubMed] [Google Scholar]
- 35. Bernstein AM, Pan A, Rexrode KM, Stampfer M, Hu FB, Mozaffarian D, Willett WC. Dietary protein sources and the risk of stroke in men and women. Stroke 2012; 43:637–644. [DOI] [PMC free article] [PubMed] [Google Scholar]
- 36. Vasan RS, Larson MG, Leip EP, Evans JC, O’Donnell CJ, Kannel WB, Levy D. Impact of high-normal blood pressure on the risk of cardiovascular disease. NEJM 2001; 345:1291–1297. [DOI] [PubMed] [Google Scholar]
- 37. Hsia J, Margolis KL, Eaton CB, Wenger NK, Allison M, Wu L, LaCroix AZ, Black HR. Prehypertension and cardiovascular disease risk in the Women’s Health Initiative. Circulation 2007; 115:855–860. [DOI] [PubMed] [Google Scholar]
- 38. Diao D, Wright JM, Cundiff DK, Gueyffier F. Pharmacotherapy for mild hypertension. Cochrane Database Syst Rev 2012; 8:CD006742. [DOI] [PMC free article] [PubMed] [Google Scholar]
- 39. McInnes GT. Drug treatment of prehypertension: not now, not ever? Blood Press 2009; 18:304–307. [DOI] [PubMed] [Google Scholar]
- 40. Olsen H, Klemetsrud T, Stokke HP, Tretli S, Westheim A. Adverse drug reactions in current antihypertensive therapy: a general practice survey of 2586 patients in Norway. Blood Press 1999; 8:94–101. [DOI] [PubMed] [Google Scholar]
- 41. Bos WJ, Verrij E, Vincent HH, Westerhof BE, Parati G, van Montfrans GA. How to assess mean blood pressure properly at the brachial artery level. J Hypertension 2007; 25:751–755. [DOI] [PubMed] [Google Scholar]
- 42. Dickinson HO, Mason JM, Nicolson DJ, Campbell F, Beyer FR, Cook JV, Williams B, Ford GA. Lifestyle interventions to reduce raised blood pressure: a systematic review of randomized controlled trials. J Hypertension 2006; 24:215–233. [DOI] [PubMed] [Google Scholar]
Associated Data
This section collects any data citations, data availability statements, or supplementary materials included in this article.