

Abstract
Breast cancer is the most common solid organ malignancy and the most frequent cause of cancer death among women worldwide. Previous research has yielded insights into its genetic etiology, but there remains a gap in the understanding of genetic factors that contribute to risk, and particularly in the biological mechanisms by which genetic variation modulates risk. The National Cancer Institute’s “Up for a Challenge” (U4C) competition provided an opportunity to further elucidate the genetic basis of the disease. Our group leveraged the seven datasets made available by the U4C organizers and data from the publicly available UK Biobank cohort to examine associations between imputed gene expression and breast cancer risk. In particular, we used reference datasets describing the breast tissue and whole blood transcriptomes to impute expression levels in breast cancer cases and controls. In trans-ethnic meta-analyses of U4C and UK Biobank data, we found significant associations between breast cancer risk and the expression of RCCD1 (joint p-value: 3.6x10-06) and DHODH (p-value: 7.1x10-06) in breast tissue, as well as a suggestive association for ANKLE1 (p-value: 9.3x10-05). Expression of RCCD1 in whole blood was also suggestively associated with disease risk (p-value: 1.2x10-05), as were expression of ACAP1 (p-value: 1.9x10-05) and LRRC25 (p-value: 5.2x10-05). While genome-wide association studies (GWAS) have implicated RCCD1 and ANKLE1 in breast cancer risk, they have not identified the remaining three genes. Among the genetic variants that contributed to the predicted expression of the five genes, we found 23 nominally (p-value < 0.05) associated with breast cancer risk, among which 15 are not in high linkage disequilibrium with risk variants previously identified by GWAS. In summary, we used a transcriptome-based approach to investigate the genetic underpinnings of breast carcinogenesis. This approach provided an avenue for deciphering the functional relevance of genes and genetic variants involved in breast cancer.
Author summary
There is a clear genetic basis of breast cancer, and previous work has identified numerous genetic variants that increase risk of this common disease. However, much of the underlying genetic variation in breast cancer remains unexplained. To address this void, as part of the National Cancer Institute’s “Up for a Challenge” (U4C) competition, we undertook a large-scale study of genetically regulated gene expression and breast cancer. Specifically, we estimated gene expression levels based on germline genetics for subjects in the seven breast cancer studies provided by U4C and for subjects in the UK Biobank. We then evaluated associations between gene expression and breast cancer and detected three novel and two known breast cancer genes. These genes exhibit potential biological mechanisms for impacting breast carcinogenesis. Our work highlights the value of leveraging different sources of data to more thoroughly study the genetic basis of complex diseases.
Introduction
Breast cancer is the most common solid organ malignancy and the most frequent cause of cancer death among women worldwide [1]. Family history is among the strongest known risk factors for breast cancer. Individuals with a first-degree relative affected by the disease have a roughly two-fold increased risk of developing breast cancer themselves, and a more extensive family history or having relatives diagnosed at an earlier age confers yet greater risk [2–4]. A recent twin study estimated the heritability of breast cancer to be 31% [5], but the combination of rare variants (e.g., in BRCA1, BRCA2) identified from linkage studies (summarized in [6]) and common single nucleotide polymorphisms (SNPs) at roughly 100 loci identified from genome-wide association studies (GWAS; summarized in [7]) explain only one-third of the excess familial risk of disease [8]. Thus, a substantial gap remains in the understanding of the genetic factors that contribute to breast cancer risk.
The National Cancer Institute’s Up for a Challenge (U4C) competition offered a unique opportunity to further elucidate the genetic basis of breast cancer. Seven ethnically diverse GWAS datasets were made available in dbGaP and participants were challenged to use innovative approaches to identify novel loci, genes, and/or genomic features involved in breast cancer susceptibility. Our group leveraged the U4C genotype data along with gene expression datasets to search for evidence of additional genes involved in breast cancer susceptibility.
Recently, methods have been developed to leverage genotypic data toward imputing gene expression that can then be evaluated in association studies [9]. These methods are based on strong evidence that expression quantitative trait loci (eQTLs), which contribute to regulating gene expression levels, account for a substantial portion of the risk of various disease phenotypes [10–12]. A reference dataset with genotype and gene expression data is used to derive a set of SNPs that optimally predicts the expression of each gene. These SNPs can then be used to impute genetically regulated gene expression in datasets without measured expression data, and these imputed values can then be tested for associations with a phenotype of interest. Evaluating gene expression with respect to breast cancer risk has the potential to offer insights distinct from those available from traditional GWAS. First, associations with gene expression have clear functional interpretations. In contrast, the functional relevance of SNPs discovered by GWAS usually remains unclear. Second, association testing for genes substantially reduces the multiple testing burden relative to single variant approaches. Third, association testing for gene expression allows for rational combination of multiple SNPs, which may help to enhance weak signals.
We conducted a transcriptome-wide association study of gene expression and breast cancer risk by applying an innovative method called PrediXcan [9] that uses eQTL reference transcriptome datasets to impute genetically regulated expression. We used reference expression data from breast tissue and whole blood to identify the SNPs that predict gene expression. We then used the U4C datasets combined with data from the UK Biobank to search for genes for which predicted expression is associated with susceptibility to breast cancer. The approach provided an avenue for deciphering the functional relevance of both genes and SNPs involved in breast cancer development.
Results
Transcriptome-wide imputation in U4C and UK Biobank data
After splitting the GWAS of Breast Cancer in the African Diaspora (African Diaspora), Breast and Prostate Cancer Cohort Consortium GWAS (BPC3), and Multiethnic Cohort GWAS in African Americans, Latinos, and Japanese (MEC) datasets into sub-populations, and excluding the Nurses’ Health Study (NHS2) sub-population from the BPC3 (because it was already included in the Cancer Genetic Markers of Susceptibility Breast Cancer GWAS [CGEMS] dataset), we imputed gene expression into 14 separate discovery studies with a total of 12,079 breast cancer cases and 11,442 controls. In addition, we used 3,370 cases and 19,717 controls from the publicly available UK Biobank cohort study as a replication population [13]. Additional details of the study populations, genotyping, and quality control (QC) process are provided in Table 1 and the Materials and Methods section.
Table 1. Characteristics of the Up for a Challenge datasets (discovery) and the UK Biobank (replication).
| Dataset (Source Dataset) | Race / Ethnicity | # Casesa | # Controlsa | Genotyping Platform |
|---|---|---|---|---|
| Discovery | ||||
| AABC (AABC) | African | 2,755 | 2,461 | Illumina Human1M-Duo BeadChip |
| African (African Diaspora) | African | 699 | 606 | Illumina HumanOmni2.5-Quad |
| African American / Barbadian (African Diaspora) | African | 934 | 1,400 | Illumina HumanOmni2.5-Quad |
| CGEMS (CGEMS) | European | 1,125 | 1,126 | Illumina HumanHap550 |
| CPSII (BPC3) | European | 289 | 292 | HumanHap550; HumanHap 660 |
| EPIC (BPC3) | European | 501 | 491 | HumanHap550; HumanHap 660 |
| Latina Admixture (Latina Admixture) | Latina | 800 | 365 | Affymetrix GWAS SNP Array 6.0 |
| MEC–European (BPC3) | European | 85 | 98 | HumanHap550; HumanHap 660 |
| MEC–Japanese (MEC) | East Asian | 885 | 822 | Human660W; Human-1M |
| MEC–Latina (MEC) | Latina | 520 | 544 | Human660W; Human-1M |
| NHS2 (BPC3) | European | 71 | 372 | HumanHap550; HumanHap 660 |
| PBCS (BPC3) | European | 532 | 495 | HumanHap550; HumanHap 660 |
| PLCO (BPC3) | European | 252 | 337 | HumanHap550; HumanHap 660 |
| Shanghai (Shanghai) | East Asian | 2,631 | 2,033 | Affymetrix GWAS SNP Array 6.0 |
| Replication | ||||
| UK Biobank | European | 3,370 | 19,717 | UK BiLEVE Axiom; UK Biobank Axiom |
Abbreviations: AABC: African American Breast Cancer GWAS; African Diaspora: GWAS of Breast Cancer in the African Diaspora; BPC3: Breast and Prostate Cancer Cohort Consortium GWAS; CGEMS: Cancer Genetic Markers of Susceptibility Breast Cancer GWAS; CPSII: Cancer Prevention Study II; EPIC: European Prospective Investigation into Cancer and Nutrition; GWAS: genome-wide association study; Latina Admixture: San Francisco Bay Area Latina Breast Cancer Study; MEC: Multiethnic Cohort GWAS in African Americans, Latinos, and Japanese; NHS2: Nurses' Health Study 2; PBCS: Polish Breast Cancer Study; PLCO: Prostate, Lung, Colorectal, and Ovarian Cancer Screening Trial; Shanghai: Shanghai Breast Cancer Genetics Study; SNP: single nucleotide polymorphism
a After all quality control steps
The developers of PrediXcan previously determined the cis-eQTL SNPs relevant to the estimation of gene expression in 44 distinct tissue types. The weights that should be applied to each SNP to impute transcript levels in other datasets are maintained in the publicly available database PredictDB. For our study, we elected to use the weights developed based on gene expression in breast tissue and, separately, in whole blood. We used the former for its direct relevance to breast cancer (developed based on n = 173 samples) and the latter because the weights were developed based on the largest number of samples among all tissues (n = 922).
Weights for the prediction of breast tissue expression were available for 4,473 genes based on 102,762 unique SNPs. The mean expected correlation between imputed transcript levels and true gene expression across all transcripts was 0.097. Regarding the prediction of whole blood expression, weights were available for 9,791 genes based on 249,696 unique SNPs. The mean expected correlation between imputed transcript levels and true gene expression across all transcripts was 0.145.
Transcriptome-wide associations with breast cancer risk
A meta-analysis of the U4C discovery datasets yielded 280 transcripts with imputed breast tissue levels nominally (p-value < 0.05) associated with breast cancer risk (S1A Table). We evaluated all of these genes for associations in the UK Biobank data. Our genomic inflation factor was 1.07 (λ1000 = 1.01). All genes with a p-value < 0.10 in this replication cohort and effect estimates in the same direction as the discovery effect were included in a combined meta-analysis of discovery and replication. Table 2 describes the three genes for which the combined meta-analysis showed evidence of an association with breast cancer. Decreased expression levels of RCCD1 (p-value: 3.6x10-06) and DHODH (p-value: 7.1x10-06) showed significant associations with breast cancer risk based on a Bonferroni-corrected significance threshold (0.05 / 4,473 = 1.1x10-05), and higher expression levels of ANKLE1 demonstrated a suggestive association (p-value: 9.3x10-05). The DHODH association was largely driven by the discovery dataset (p-value: 2.4x10-05) with little contribution from replication (p-value: 0.056). Estimates from each of the discovery datasets and the replication dataset are presented in S1 Fig for each of the three genes. While RCCD1 and ANKLE1 have been implicated by GWAS of breast cancer risk, DHODH has not been previously identified.
Table 2. Effect estimates and standard errors for gene expression suggestively (p-value < 1.0x10-04) associated with breast cancer risk in a meta-analysis of the Up for a Challenge and UK Biobank datasets.
| # SNPs in | Imputation | U4C | UK Biobank | Meta-analysis | |||||
|---|---|---|---|---|---|---|---|---|---|
| Gene | Locationa | Prediction | Qualityb | Beta (SE) | p-value | Beta (SE) | p-value | Beta (SE) | p-value |
| Breast Tissue Gene Expression | |||||||||
| RCCD1 | 15q26.1 | 24 | 0.16 | -0.11 (0.038) | 5.8x10-03 | -0.24 (0.057) | 2.6x10-05 | -0.15 (0.032) | 3.6x10-06 |
| DHODH | 16q22.2 | 7 | 0.026 | -0.52 (0.12) | 2.4x10-05 | -0.29 (0.15) | 0.056 | -0.43 (0.095) | 7.1x10-06 |
| ANKLE1 | 19p13.11 | 6 | 0.081 | 0.19 (0.093) | 0.044 | 0.43 (0.12) | 1.9x10-04 | 0.28 (0.072) | 9.3x10-05 |
| Whole Blood Gene Expression | |||||||||
| RCCD1 | 15q26.1 | 20 | 0.35 | -0.074 (0.026) | 4.7x10-03 | -0.14 (0.039) | 2.7x10-04 | -0.095 (0.022) | 1.2x10-05 |
| ACAP1 | 17p13.1 | 19 | 0.39 | 0.098 (0.037) | 7.9x10-03 | 0.11 (0.033) | 7.9x10-04 | 0.11 (0.025) | 1.9x10-05 |
| LRRC25 | 19p13.11 | 33 | 0.35 | 0.086 (0.029) | 2.7x10-03 | 0.094 (0.034) | 6.5x10-03 | 0.089 (0.022) | 5.2x10-05 |
Abbreviations: SE: standard error; SNP: single nucleotide polymorphism; U4C: Up for a Challenge
a According to human reference genome GRCh37/hg19
b r2 estimate derived from 10 fold cross-validation of true gene expression and predicted gene expression
The imputed expression of genes based on whole blood yielded no statistically significant associations with breast cancer risk after multiple testing correction (Bonferroni significance threshold = 0.05 / 9,791 = 5.1x10-06) (S1B Table). Our genomic inflation factor was 1.06 (λ1000 = 1.01). However, Table 2 shows results for three genes that showed suggestive evidence of an association (p-value < 1.0x10-04). Notably, decreased expression levels of RCCD1 in whole blood (as in breast tissue) were suggestively associated with breast cancer risk (p-value: 1.2x10-05). Furthermore, we found that higher expression levels of ACAP1 (p-value: 1.9x10-05) and LRRC25 (p-value: 5.2x10-05) were suggestively associated with an increased risk of breast cancer. Estimates from each of the discovery datasets and the replication dataset are presented in S2 Fig for each of the three genes. Neither ACAP1 nor LRRC25 have previously been implicated by GWAS of breast cancer risk.
The volcano plots in S3 Fig depict the U4C and UK Biobank meta-analysis summary statistics for 4,469 breast tissue transcripts and 9,768 whole blood transcripts. Outliers with beta estimates outside three standard deviations from the mean were excluded from the plots–four for breast tissue and 23 for whole blood. The x-axis gives the beta effect sizes reflecting the fold change in gene expression between cases and controls, and the y-axis plots the corresponding -log10(p-value). S3 Fig is thus illustrative of the differential expression between cases and controls for genes across the transcriptome. For breast tissue expression (S3A Fig), we saw few genes beyond those noted above showing any evidence of association. In contrast, the distribution of p-values for whole blood expression (S3B Fig) was slightly broader, albeit with a more stringent threshold for statistical significance. However, among those genes significantly or suggestively associated with breast cancer risk, the magnitudes of the effect sizes were larger for breast tissue expression (|Beta| ≥ 0.15) than for whole blood expression (|Beta| ≤ 0.11; Table 2). For the 2,840 genes that overlapped, the correlation of the betas for the breast tissue and whole blood analyses was significant (r2 = 0.32; p-value: 2.2x10⁻¹⁶).
We tested for heterogeneity of the associations across studies in the meta-analysis of the U4C datasets alone, and in the meta-analysis combined with the UK data. These analyses did not indicate any statistically significant heterogeneity (p-values > 0.10). Furthermore, we did not detect heterogeneity within ancestry groups (p-values > 0.15), except for ANKLE1 in the European only meta-analysis (p-value: 0.022). Upon restricting the analysis to women with ER negative breast cancer, however, we no longer found significant heterogeneity (p-value: 0.32).
Single variants that predict expression and breast cancer risk
Table 2 indicates the number of SNPs identified by PredictDB for optimal prediction of the genetically regulated expression of each of the genes showing suggestive associations with breast cancer risk. PrediXcan uses an elastic net method to determine the best set of SNPs for predicting gene expression. Because elastic net allows for highly correlated variables in prediction models, some of the SNPs are in high linkage disequilibrium (LD). We evaluated associations between each of the SNPs and breast cancer risk (S2 Table); those achieving nominal (p-value < 0.05) significance in a meta-analysis of the U4C and UK Biobank data are displayed in Table 3. The tables also indicate the proportion of total weight attributed to each SNP in the gene prediction models. The sum of the relative weights for all SNPs contributing to the prediction of any given gene always equals to one, and the SNP ranking remains static. Raw weights used for gene expression prediction can be found within the GTEx and DGN PredictDB databases.
Table 3. SNPs nominally (p-value < 0.05) associated with breast cancer risk that contribute to expression of genes suggestively associated with breast cancer risk.
| Proportion | U4C | UK Biobank | Meta-analysis | |||||||
|---|---|---|---|---|---|---|---|---|---|---|
| SNP | Allelesa | of Weightb | EAFc | OR (95% CI) | p-value | EAFc | OR (95% CI) | p-value | OR (95% CI) | p-value |
| RCCD1 at 15q26.1 (Breast Tissue) | ||||||||||
| rs3826033d | G / A | 0.13 | 0.32 | 0.92 (0.88, 0.98) | 4.1x10-03 | 0.13 | 0.86 (0.79,0.93) | 2.3x10-04 | 0.90 (0.86,0.94) | 9.5x10-06 |
| rs2290202d | G / T | 0.24 | 0.3 | 0.93 (0.89, 0.98) | 5.3x10-03 | 0.13 | 0.86 (0.79,0.93) | 1.9x10-04 | 0.91 (0.88,0.95) | 1.7x10-05 |
| rs4347602 | A / C | 0.025 | 0.72 | 0.94 (0.90,0.98) | 6.5x10-03 | 0.77 | 0.96 (0.90,1.02) | 0.16 | 0.94 (0.91,0.98) | 2.4x10-03 |
| rs11207d | C / T | 0.030 | 0.35 | 0.97 (0.93, 1.02) | 0.21 | 0.24 | 0.93 (0.87,0.98) | 0.015 | 0.96 (0.93,0.99) | 0.016 |
| DHODH at 16q22.2 (Breast Tissue) | ||||||||||
| rs3213422 | C / A | 0.56 | 0.42 | 0.92 (0.88,0.96) | 2.8x10-05 | 0.48 | 0.95 (0.90,1.00) | 0.039 | 0.93 (0.90,0.96) | 4.5x10-06 |
| rs2240243 | G / A | 0.055 | 0.47 | 0.93 (0.89,0.97) | 2.7x10-04 | 0.34 | 0.98 (0.93,1.04) | 0.53 | 0.95 (0.92,0.98) | 1.0x10-03 |
| rs12708928 | C / A | 0.019 | 0.47 | 0.93 (0.89,0.96) | 2.5x10-04 | 0.34 | 0.99 (0.93,1.04) | 0.59 | 0.95 (0.92,0.98) | 1.2x10-03 |
| ANKLE1 at 19p13.11 (Breast Tissue) | ||||||||||
| rs34084277d | A / G | 0.23 | 0.19 | 1.09 (1.02,1.15) | 7.1x10-03 | 0.19 | 1.11 (1.04,1.18) | 2.0x10-03 | 1.10 (1.05,1.14) | 4.7x10-05 |
| rs8170d | G / A | 0.26 | 0.19 | 1.08 (1.02,1.15) | 7.2x10-03 | 0.19 | 1.11 (1.04,1.18) | 2.6x10-03 | 1.09 (1.05,1.14) | 6.3x10-05 |
| RCCD1 at 15q26.1 (Whole Blood) | ||||||||||
| rs3826033d | G / A | 0.33 | 0.32 | 0.92 (0.88,0.98) | 4.1x10-03 | 0.13 | 0.86 (0.79,0.93) | 2.3x10-04 | 0.90 (0.86,0.94) | 9.5x10-06 |
| rs2290202d | G / T | 0.29 | 0.3 | 0.93 (0.89,0.98) | 5.3x10-03 | 0.13 | 0.86 (0.79,0.93) | 1.9x10-04 | 0.91 (0.88,0.95) | 1.7x10-05 |
| rs7180016d | G / A | 0.012 | 0.49 | 0.97 (0.93,1.01) | 0.13 | 0.16 | 0.90 (0.84,0.97) | 5.7x10-03 | 0.95 (0.92,0.99) | 7.3x10-03 |
| rs11073961 | A / G | 0.049 | 0.35 | 0.97 (0.93,1.01) | 0.21 | 0.27 | 0.92 (0.87,0.98) | 7.5x10-03 | 0.95 (0.93,0.99) | 9.9x10-03 |
| rs11207d | C / T | 0.0092 | 0.35 | 0.97 (0.93,1.02) | 0.21 | 0.24 | 0.93 (0.87,0.98) | 0.015 | 0.96 (0.93,0.99) | 0.016 |
| rs2285937d | A / G | 0.0064 | 0.46 | 0.98 (0.94,1.02) | 0.31 | 0.16 | 0.90 (0.84,0.97) | 4.9x10-03 | 0.96 (0.93,0.99) | 0.023 |
| rs3809583 | A / G | 0.0035 | 0.36 | 0.97 (0.93,1.01) | 0.12 | 0.32 | 0.96 (0.91,1.01) | 0.15 | 0.96 (0.93,1.00) | 0.035 |
| ACAP1 at 17p13.1 (Whole Blood) | ||||||||||
| rs35776863 | A / G | 0.49 | 0.85 | 1.08 (1.00,1.16) | 0.045 | 0.77 | 1.11 (1.04,1.18) | 0.15 | 1.10 (1.04,1.15) | 1.4x10-04 |
| rs9892383 | C / T | 0.030 | 0.76 | 1.04 (0.98,1.09) | 0.17 | 0.73 | 1.10 (1.03,1.18) | 0.76 | 1.06 (1.02,1.11) | 3.6x10-03 |
| rs5412 | G / A | 0.060 | 0.12 | 1.04 (0.97,1.12) | 0.26 | 0.17 | 1.09 (1.02,1.17) | 0.12 | 1.07 (1.02,1.12) | 8.0x10-03 |
| rs4791423 | A / C | 0.0068 | 0.45 | 1.04 (1.00,1.09) | 0.033 | 0.34 | 1.03 (0.98,1.09) | 0.55 | 1.04 (1.01,1.08) | 0.018 |
| rs35721044 | T / C | 0.031 | 0.84 | 1.11 (1.02,1.22) | 0.012 | 0.76 | 1.03 (0.97,1.10) | 0.16 | 1.06 (1.01,1.12) | 0.019 |
| LRRC25 at 19p13.11 (Whole Blood) | ||||||||||
| rs11668719 | C / T | 0.25 | 0.5 | 1.06 (1.01,1.11) | 0.011 | 0.54 | 1.10 (1.05,1.16) | 1.87x10-04 | 1.08 (1.04,1.12) | 1.2x10-05 |
| rs7257932d | A / G | 0.091 | 0.55 | 1.05 (1.01,1.10) | 0.011 | 0.67 | 1.08 (1.02,1.14) | 7.01x10-03 | 1.06 (1.03,1.10) | 2.5x10-04 |
| rs13344313 | A / G | 0.16 | 0.68 | 1.06 (1.02,1.11) | 6.6x10-03 | 0.71 | 1.04 (0.98,1.10) | 0.20 | 1.05 (1.02,1.09) | 3.2x10-03 |
| rs3795026 | C / T | <0.001 | 0.54 | 1.04 (1.00,1.08) | 0.051 | 0.68 | 1.05 (0.99,1.11) | 0.12 | 1.04 (1.01,1.08) | 0.013 |
| rs7251067 | A / G | 0.031 | 0.85 | 1.00 (0.95,1.06) | 0.94 | 0.86 | 1.14 (1.06,1.23) | 6.70x10-04 | 1.05 (1.00,1.10) | 0.041 |
Abbreviations: CI: confidence interval; EAF: effect allele frequency; OR: odds ratio; SNP: single nucleotide polymorphism; U4C: Up for a Challenge
a Reference allele / effect allele
b Proportion of total weight attributed to SNP in gene prediction model
c Effect allele frequency in controls
d Previously implicated in breast cancer or in high linkage disequilibrium (r2 > 0.5 in 1000 Genomes Phase 3 populations) with known risk variants
Fig 1 displays the location of eQTL SNPs for the genes for which breast tissue expression levels were associated with breast cancer risk. The y-axis indicates the strength of association between the SNPs and breast cancer risk and each point is sized based on the relative contribution of the variant to gene expression. Among the 24 SNPs predicting expression of RCCD1, rs3826033 showed the strongest association with breast cancer risk (joint p-value: 9.5x10-06). It contributed 13% of the weight for predicting RCCD1 expression, third only to rs2290202 (24%) and rs17821347 (16%). rs2290202 was also strongly associated with breast cancer risk (p-value: 1.7x10-05). It should be noted that rs3826033 and rs2290202 are in high LD (r2 = 0.97 in 1000 Genomes Phase 3 European populations), and both SNPs are within close proximity of RCCD1 relative to the other eQTL SNPs. In contrast, rs17821347 is furthest away from RCCD1 among SNPs predicting RCCD1 expression and showed no evidence of an association with breast cancer risk (p-value: 0.89). Among the remaining RCCD1 eQTLs, only rs4347602 showed a nominal association (p-value: 2.4x10-03); it has not previously been identified by GWAS.
Fig 1.
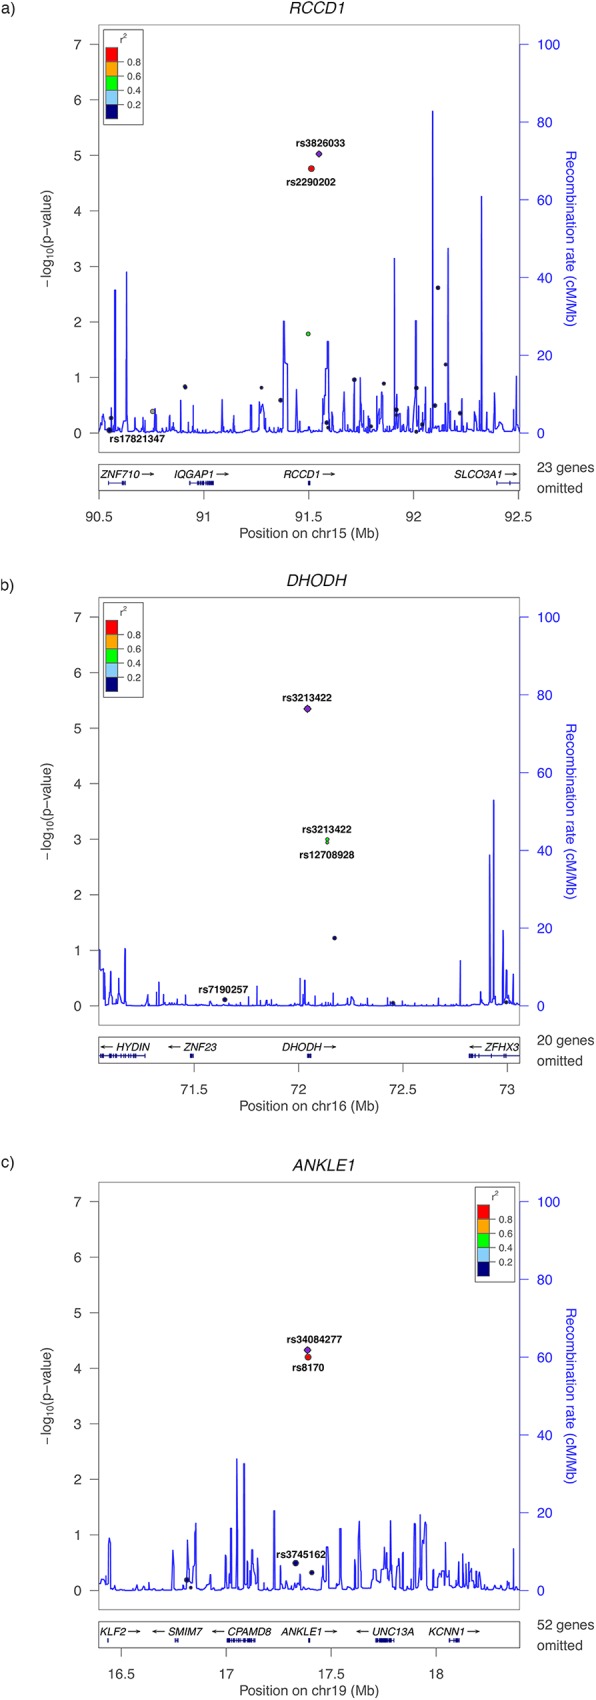
LocusZoom plots of SNPs contributing to the breast tissue expression of (A) RCCD1 at 15q26.1, (B) DHODH at 16q22.2, and (C) ANKLE1 at 19p13.11. The x-axis displays the location of the modeled eQTL SNPs relative to the genes of interest discovered in analyses breast tissue expression. The y-axis indicates the strength of association between the SNPs and breast cancer risk. Each point is sized based on the relative contribution of the variant to gene expression.
All three nominal associations that we identified for SNPs predicting DHODH expression in breast tissue have not been implicated by GWAS. rs3213422 showed the strongest signal (p-value: 4.5x10-06) and also contributed the majority of the weight (56%) among the seven SNPs predicting of DHODH expression. Both rs2240243 and rs12708928 (r2 = 1.0) are in moderate LD with rs3213422 (r2 = 0.50 for both variants) and also showed evidence of associations with breast cancer risk (p-values: 1.0x10-03 and 1.3x10-03 respectively). After rs3213422, the second most weight was contributed by rs7190257 (16%), which showed no evidence of association (p-value: 0.77).
We identified two SNPs out of six total eQTL SNPs predicting ANKLE1 expression in breast tissue that were associated with breast cancer; both have been previously associated with breast cancer risk [14–19]. The SNPs, rs34084277 (p-value: 4.7x10-05) and rs8170 (p-value: 6.3x10-05), are in perfect LD (r2 = 1.0) and both contributed substantial weight to the prediction of ANKLE1 expression (23% and 26% respectively). Notably, rs3745162 also contributed substantial weight (24%), but showed no evidence of an association with breast cancer risk (p-value: 0.32).
Fig 2 depicts the genes for which whole blood expression levels were associated with breast cancer risk. Among the 20 RCCD1 eQTL SNPs, rs3826033 (p-value: 4.1x10-03) and rs2290202 (p-value: 5.3x10-03) contributed the most weight to prediction (33% and 29% respectively) and were the most strongly associated with breast cancer risk. The other SNPs showing evidence of an association were rs7180016 (p-value: 7.3x10-03), rs11073961 (p-value: 9.9x10-03), rs11207 (p-value: 0.016), rs2285937 (p-value: 0.023), and rs3809583 (p-value: 0.035). rs3826033, rs2290202, and rs11207 were included in the both the breast tissue and the whole blood prediction models for RCCD1 expression. Only rs11073961 and rs3809583 have not been previously implicated in breast cancer GWAS.
Fig 2.
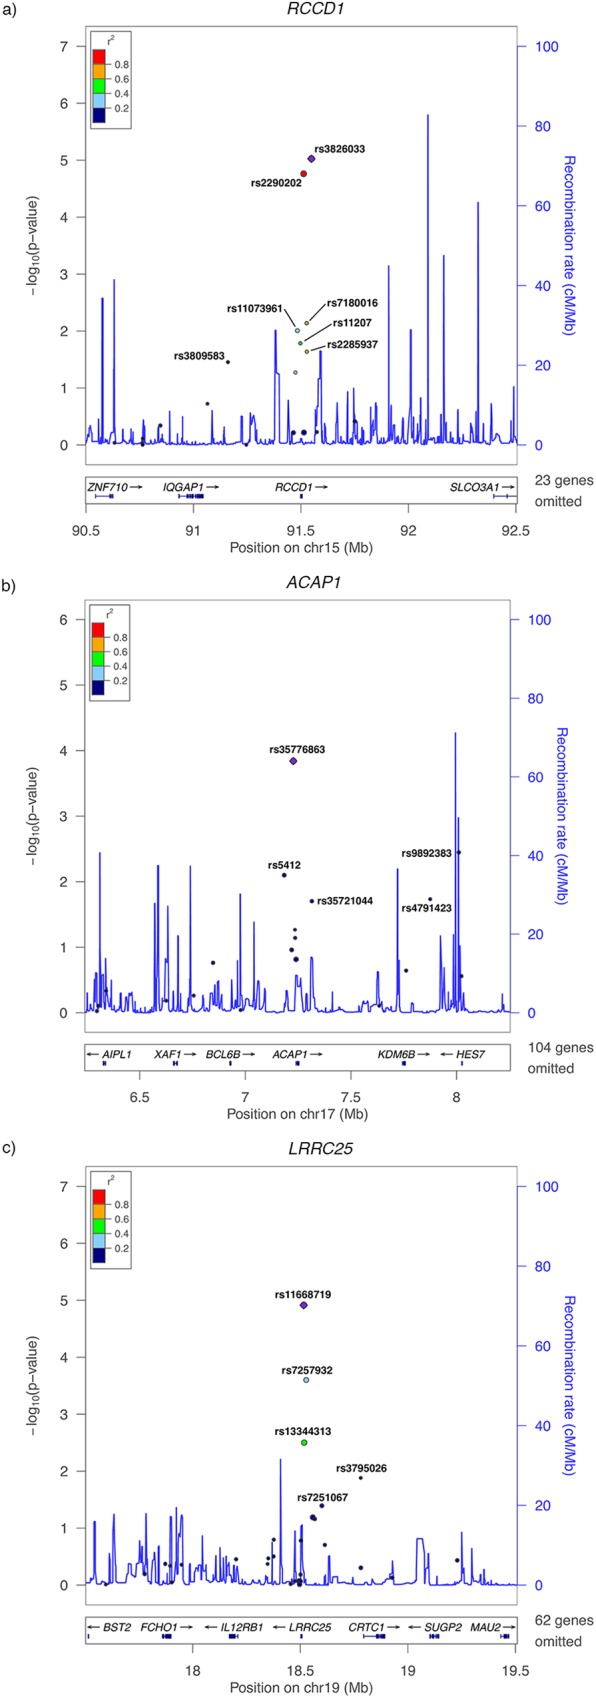
LocusZoom plots of SNPs contributing to the whole blood expression of (A) RCCD1 at 15q26.1, (B) ACAP1 at 17p13.1, and (C) LRRC25 at 19p13.11. The x-axis displays the location of the modeled eQTL SNPs relative to the genes of interest discovered in analyses of whole blood expression. The y-axis indicates the strength of association between the SNPs and breast cancer risk. Each point is sized based on the relative contribution of the variant to gene expression.
Among the 19 ACAP1 whole blood eQTL SNPs, five were nominally associated with breast cancer risk. Most noteworthy was rs35776863, which not only had the strongest association with breast cancer risk (p-value: 1.4x10-04), but also contributed nearly half of the weight for predicting ACAP1 expression (49%). The other SNPs showing evidence of an association were rs9892383 (p-value: 3.6x10-03), rs5412 (p-value: 8.0x10-03), rs4791423 (p-value: 0.018), and rs35721044 (p-value: 0.019). None of these SNPs have been previously implicated in breast cancer GWAS.
Out of 33 LRRC25 whole blood eQTL SNPs, five showed evidence of an association with breast cancer risk. Again, the SNP that contributed the most weight (25%), rs11668719, also showed the strongest association signal with disease risk (p-value: 1.2x10-05). The next two strongest signals were for SNPs in moderate LD with rs11668719, namely rs7257932 (r2 = 0.39; p-value: 2.5x10-04), which is the only SNP predicting LRRC25 expression previously implicated in breast cancer GWAS, and rs13344313 (r2 = 0.43; p-value: 3.2x10-03). Also suggestively associated with breast cancer risk, albeit contributing less than 0.1% of the weight for predicting LRRC25 expression, was rs3795026 (p-value: 0.013). The last SNP nominally associated with breast cancer risk was rs7251067 (p-value: 0.041).
Discussion
In this transcriptome-wide association study, we identified five genes for which genetically regulated expression levels may be associated with breast cancer risk. We also found 23 unique SNPs contributing to the expression levels of these five genes that were associated with disease. Out of the 23 SNPs, seven in breast cancer genes identified by GWAS and one in a breast cancer gene previously unidentified by GWAS have been previously implicated in breast cancer or are in high LD (r2 > 0.50 in 1000 Genomes Phase 3 populations) with known risk variants. The remaining SNPs have not been previously associated with breast cancer risk.
We found that lower predicted expression of RCCD1 (i.e., RCC1 domain containing 1) in both breast tissue and whole blood was associated with increased breast cancer risk. This finding supports limited existing evidence for the role of RCCD1 in breast cancer. A 2014 GWAS of East Asian women reported a genome-wide significant association for rs2290203, which is 5,712 bp downstream of RCCD1 on 15q26.1 [20]. The authors then replicated the association in a European population. They also showed a correlation between rs2290203 and expression of RCCD1 [20], which supported a previous eQTL analysis of human monocytes that indicated that rs2290203 is a cis-eQTL for RCCD1 [21]. A more recent study identified an association between rs8037137, another 15q26.1 SNP in moderate LD with rs2290203 (r2 = 0.59 in 1000 Genomes Phase 3 European populations), and both breast and ovarian cancer [7]. The effect alleles of both rs2290203 and rs8037137 decrease RCCD1 expression [7,20], aligning with our finding that lower RCCD1 expression is associated with increased breast cancer risk. Neither rs2290203 nor rs8037137 was among the SNPs included in PredictDB for the prediction of RCCD1 expression. However, these SNPs are in LD with RCCD1 eQTL SNPs that were included in the prediction models, namely rs2290202 (r2 = 0.59 for rs2290203, r2 = 0.99 for rs8037137) and rs3826033 (r2 = 0.57, r2 = 0.96). The PrediXcan breast tissue model explains approximately 30% of the variance in RCCD1 expression, and rs2290202 and rs3826033 account for approximately 37% of that variation. The histone demethylase complex formed by RCCD1 protein with KDM8 is important for chromosomal stability and fidelity during mitosis division [22]. It is thus plausible that lower expression of RCCD1 could lead to errors in cell division that could potentially increase the risk of breast cancer. Future studies should evaluate the specific mechanisms whereby reduced RCCD1 expression could be associated with breast cancer risk.
ANKLE1 (i.e., ankyrin repeat and LEM domain containing 1) has been previously implicated in breast cancer. Both cis-eQTLs for ANKLE1, rs8170 and rs34084277, among several other SNPs in the 19p13.11 region, have been identified as breast cancer risk variants in several GWAS[8,14–19,23–25]. Little experimental evidence exists regarding associations between over- or under-expression of ANKLE1 and cancer risk. In our study, we found that higher expression levels of ANKLE1 were associated with an increased risk of breast cancer. Variants in the two SNPs positively associated with ANKLE1 expression in our study were also positively associated with breast cancer risk in previous work by Antoniou et al. [14]. With regard to the genotypic association with breast cancer risk, the effect estimates corresponding to the same risk allele were similar. Specifically, for rs8170, the A allele was positively associated with breast cancer in the previous study (OR = 1.28 among BRCA1 carriers) and our study (OR = 1.08). Although the direction of effect was not previously reported for rs34084277, this variant is in almost perfect LD with rs8170 and shares the same direction of effect in our study (OR = 1.09). ANKLE1 is an endonuclease involved in DNA damage repair pathways [26]. Its overexpression could therefore perturb the delicate balance required for DNA damage repair. That SNPs in the 19p13.11 locus have also been implicated in ovarian cancer [27,28] implies that ANKLE1 may also be involved in hormonally-mediated carcinogenic pathways.
To the best of our knowledge, DHODH, ACAP1, and LRRC25 have not been implicated in GWAS of breast cancer risk. Even though the imputation quality of DHODH (i.e., dihydroorotate dehydrogenase [quinone]), was lowest among the genes of interest in our study, we still identified a statistically significant association between decreased expression levels of DHODH in breast tissue and breast cancer risk. The existing literature regarding the directionality of association for DHODH and breast cancer is potentially inconsistent; deletion of the 16q22.2 locus has been associated with both better prognosis [29] and increased risk of metastasis [30]. Still, DHODH inhibition has been leveraged in the treatment of breast cancer. In particular, a DHODH inhibitor called brequinar has been shown to have modest activity in patients with advanced breast cancer [31]. It is thus difficult to reconcile our findings regarding disease risk with those of existing studies of disease progression.
ACAP1 (i.e., ArfGAP with coiled-coil, ankyrin repeat and PH domains 1) has not been implicated in breast cancer risk, but it has been shown to potentially play a role in disease progression. Its protein product activates the Arf6 protein [32], the expression of which has been shown to be higher in highly invasive breast cancer than in weakly invasive or noninvasive breast cancer and normal mammary epithelial cells [33]. ACAP1 also interacts with the third cytoplasmic loop of SLC2A4/GLUT4. SLC2A4 encodes a protein that functions as an insulin-regulated facilitative glucose transporter; inhibition of this gene affects cell proliferation and cell viability, suggesting a potential biological hypothesis for how ACAP1 may be involved with breast cancer [34].
LRRC25 (i.e., leucine rich repeat containing 25) is more than one megabase away from ANKLE1 at 19p13.11. It is located in a leukocyte-receptor cluster and may be involved in the activation of hematopoietic cells, which play a critical role in innate and acquired immunity [35]. If LRRC25 overexpression results in an elevated inflammatory response, then it could also increase the risk of breast cancer. In a study of the cis-eQTL activity of known cancer loci, the 19p13.11 breast cancer risk SNP rs4808801 was most significantly associated with the expression of LRRC25 (p-value: 3.2 x 10-03) [36]. rs4808801 is in high LD (r2 = 0.88 in 1000 Genomes Phase 3 European populations) with the eQTL rs7257932 that we used to impute LRRC25.
It is our understanding that ours is the first study to use PrediXcan to impute eQTLs transcriptome-wide toward evaluating associations with cancer. It is important, however, that it be interpreted in the context of some limitations. The weights housed in PredictDB were largely developed based on Caucasian samples. However, no SNPs that were monomorphic in any of the 14 U4C ancestral populations were included in our analysis. Still, whether or not the weights are valid for application in non-Caucasian populations is unclear and requires further study. Furthermore, true gene expression was unmeasured. Rather, our study evaluated estimated genetically regulated gene expression, sometimes with low imputation quality. The mean expected correlation of imputed genetically regulated gene expression and true gene expression is 0.097 for breast tissue and 0.145 for whole blood. For most genes, we would not expect the correlation to approach one given that gene expression is regulated by factors other than germline genetics, but because PrediXcan was only recently developed, an appropriate threshold for usable imputation quality is not yet definitive. In the release of PredictDB used here (dated 8/18/16), the authors only included genes that had a false discovery rate ≤ 5% based on the elastic net models used to generate the SNP weights. With respect to our results, imputation quality seemed related to the number of SNPs included in the gene expression prediction model. It is interesting, however, that we were still able to detect signal for the genes in our study for which expression was predicted by the smallest number of SNPs (ANKLE1 and DHODH). The imputation quality and included genes will likely change as updated versions of PrediXcan and PredictDB become available. How sensitive findings are to PrediXcan updates is an important consideration given that prediction is dependent on the reference panel.
In summary, by employing a transcriptome-wide approach, we identified novel associations for gene expression with breast cancer risk that have not surfaced from traditional GWAS designs. The approach also allowed for the development of new hypotheses regarding biological mechanisms at play in breast carcinogenesis. Future research focusing on the downstream effects of imputed gene expression, such as gene-gene interactions and gene co-expression networks, may further advance the characterization of breast cancer etiology.
Materials and methods
Study populations and genotyping
Discovery analyses used all seven dbGaP datasets provided for the purposes of U4C: African American Breast Cancer GWAS (AABC); African Diaspora; CGEMS [37,38]; BPC3 [19,39]; San Francisco Bay Area Latina Breast Cancer Study (Latina Admixture); MEC; and Shanghai Breast Cancer Genetics Study (Shanghai). All of the U4C datasets provided case-control status, age, and principal components of race/ethnicity. Genotyping platforms varied by study as outlined in Table 1. Imputed genotypic data were also made available for U4C, but we elected to impute each dataset to the same reference panel as described later on.
We used the publicly available UK Biobank as a replication population. The UK Biobank is a cohort of 500,000 persons aged 40 to 69 recruited from across the United Kingdom between 2006 and 2010. Its protocol has been previously described [13]. In brief, every participant was evaluated at baseline in-person visits during which assessment center staff introduced a touch-screen questionnaire, conducted a brief interview, gathered physical measurements, and collected both blood and urine samples.
In an interim data release, UK Biobank has made typed genotypic data available for 152,736 individuals whose blood samples passed QC. Affymetrix genotyped 102,754 of these individuals' samples with the UK Biobank Axiom array [40] and 49,982 with the UK BiLEVE array [41]. The former array is an updated version of the latter; it includes additional novel markers that replace a small fraction of the markers used for genome-wide coverage. In all, the two arrays share over 95% of their marker content, and 806,466 SNPs that passed QC in at least one batch [41].
In addition to the typed data, UK Biobank has released imputed data for 152,249 samples that were not identified as outliers. Imputation was conducted based on a consolidation of the UK10K haplotype and the 1000 Genomes Phase 3 reference panels [42]. It resulted in a dataset of 73,355,667 SNPs, short indels, and large structural variants.
From among the individuals in the UK Biobank with imputed data available, we identified 3,370 European ancestry women diagnosed with breast cancer according to ICD-9 (174) and ICD-10 (C50) codes. Because non-breast cancers are unlikely to metastasize to breast tissue [43], we assumed that all first diagnoses of cancers in the breast were primary malignancies and included women with prior non-breast cancer diagnoses. Of the 3,370 breast cancers included in the analysis, 171 (5.1%) had a previous diagnosis of a separate cancer-related condition. A majority of these were nonmelanoma skin cancers (n = 43) or in situ conditions (n = 50); the number of cases with other malignancies was very low (n = 78, 2.3% of total cases), and including them was thus unlikely to materially alter our findings. We defined European ancestry individuals as those classified as British, Irish, or any other European background according to the baseline questionnaire.
We randomly selected 19,717 controls frequency-matched to cases by five-year age groups from among European ancestry females in the UK Biobank cohort without an ICD9 or ICD10 code for any primary or secondary diagnosis of cancer and with imputed genotypic data.
We excluded from controls any women with a previous cancer to limit the potential for bias arising from a shared genetic basis underlying different cancers. Age at the time of initial assessment was calculated by subtracting year of birth from year of assessment; month and day of birth were unavailable.
Ethics statement
The Institutional Review Boards of each project that made the data used here publicly available approved the research. Since these are non-identifiable data, we are exempt from Institutional Review Board approval at our home institution.
Removing duplicates and closely related individuals
For each of the seven U4C datasets and the UK Biobank case-control sub-study, we used the KING toolset to calculate pairwise kinship coefficients and remove subjects with up to second degree familial relationships. We found that all participants of the NHS1 were included in both the CGEMS and BPC3 U4C datasets. We thus excluded the NHS1 from the latter dataset. For related individuals, we retained one individual from the relationship pair for potential inclusion in our analyses.
Quality control and imputation
As a first QC step for the U4C datasets, we merged all dbGaP consent groups within each of the seven studies and then checked self-reported sex against genotypic data (i.e., the X chromosome). We excluded all individuals with sex discrepancies as well as any individuals with overall call rates < 0.95. Next, we evaluated the rate of heterozygosity for all subjects. Of the seven U4C datasets, some included data from multiple sub-populations or cohorts (i.e., BPC3, MEC, and African Diaspora). As a result, we split BPC3, having already excluded the NHS1, into six datasets (Cancer Prevention Study II [CPSII], European Prospective Investigation into Cancer and Nutrition [EPIC], MEC—European, Nurses' Health Study 2 (NHS2), Polish Breast Cancer Study [PBCS], and Prostate, Lung, Colorectal, and Ovarian Cancer Screening Trial [PLCO]), MEC into two datasets (MEC—Japanese and MEC—Latina), and African Diaspora into two datasets (African and African American / Barbadian). Within the four datasets that we did not split, and in each of the ten newly created split datasets (14 datasets total), we excluded individuals with a heterozygosity rate greater than three standard deviations from the mean rate. Regarding SNP QC, we excluded those with an array genotyping rate < 0.98 in each study, as well as those with a minor allele frequency < 0.02.
Our next step was to ensure that all 14 datasets mapped to the same human reference genome (hg19). We used liftOver to lift datasets mapped to hg18 over to hg19 as necessary. We then ran SHAPEIT for haplotype phasing of each dataset. Finally, we imputed all datasets to the Haplotype Reference Consortium using Minimac3 [44].
Before being made available, UK Biobank data had already undergone extensive individual- and SNP-level QC procedures as previously described [13]. We thus used the data as provided except as outlined in the section below. We also used the imputed data provided by UK Biobank as described in the Study Populations and Genotyping section above.
Principal component analyses
We implemented principal component analysis to assess genetic ancestry in each of the 14 U4C datasets and in the UK Biobank case-control sub-study of unrelated individuals. To do so, we first LD pruned typed SNPs with r2 > 0.2 in PLINK. Then we excluded SNPs with > 0.2% missingness in the U4C datasets and > 1% missingness in the UK Biobank dataset. With the remaining data, we determined the principal components (PC) using EIGENSTRAT within smartpca [45].
Based on the PCs for the U4C datasets, we excluded any individuals outside six standard deviations along any one of the top ten principal components (S3 Table). For the UK Biobank dataset, we first focused on the top two PCs to identify any clusters of individuals that may have comprised separate sub-populations. Upon identifying one such cluster, we excluded outliers with a PC eigenvector value greater than seven standard deviations from the mean; doing so excluded individuals in the identified cluster (S3 Table).
Statistical analyses
Details of the PrediXcan method have been previously described [9]. In brief, PrediXcan uses reference datasets in which both genomic variation and gene expression levels have been measured to train additive models of gene expression. The models are constrained using an elastic net method that allows for the inclusion of highly correlated variables. Estimates from the best fit models are stored in the publicly available database PredictDB. The application of PrediXcan to GWAS datasets entails imputing gene expression across the transcriptome using the weights stored in PredictDB and correlating transcript levels with the phenotype of interest.
For these analyses, we accessed the sets of imputation weights referencing the breast tissue transcriptome from the GTEx Project and the set of weights referencing the whole blood transcriptome from the Depression Genes Network(DGN) [46,47]. The versions of PrediXcan and PredictDB used here were dated 6/29/16 and 8/18/16, respectively. We used each set of weights to impute the transcriptome in each of our 14 discovery datasets and in our replication dataset based on the subset of SNPs with imputation quality ≥ 0.3. In each dataset, we performed logistic regression to estimate the associations between imputed transcript levels and breast cancer risk, adjusted for the top ten PCs and age. Finally, we combined the results from the 14 discovery datasets and then included the replication dataset using inverse-variance-weighted fixed-effects meta-analyses. We assessed heterogeneity in the meta-analyses of the discovery U4C datasets, and in the joint meta-analyses with the UK data using Cochran’s Q-test as implemented by METAL [48].
When a joint meta-analysis indicated a suggestive association between expression of a particular gene and breast cancer risk, we evaluated associations between its cis-eQTLs and breast cancer risk. Again, we performed logistic regression adjusted for the top ten PCs and age in each dataset and then combined estimates via meta-analysis.
Supporting information
Effect estimates and standard errors for associations nominally (p-value < 0.05) significant in a meta-analysis of the discovery Up for a Challenge datasets between breast cancer risk and the imputed expression of genes based on (A) breast tissue and (B) whole blood.
(PDF)
Association of breast cancer risk with SNPs that contribute to the expression of (A) RCCD1 in breast tissue, (B) DHODH in breast tissue, (C) ANKLE1 in breast tissue, (D) RCCD1 in whole blood, (E) ACAP1 in whole blood, and (F) LRRC25 in whole blood.
(PDF)
Number of subjects removed from each cohort because of outlier principal components.
(PDF)
Forest plots of PrediXcan results for breast tissue expression of (A) RCCD1, (B) DHODH, and (C) ANKLE1.
(PDF)
Forest plots of PrediXcan results for whole blood expression of (A) RCCD1, (B) ACAP1, and (C) LRRC25.
(PDF)
Volcano plots of PrediXcan results for associations between breast cancer risk and the imputed expression of (A) 4,469 genes based on breast tissue and (B) 9,768 genes based on whole blood (genes with beta estimates outside three standard deviations from the mean were removed from the plots– 4 for breast tissue and 23 for whole blood).
(PDF)
Acknowledgments
We thank the organizers and judges of the U4C for the foresight and effort to create and lead the challenge. We especially thank Drs. Leah Mechanic, Elizabeth Gillanders, Sara Lindström, and Kenneth Dailey. We also thank the below seven U4C breast cancer studies for making their data available. In addition, this research was conducted using the UK Biobank Resource (#14105).
San Francisco Bay Area Latina Breast Cancer Study (dbGaP Study Accession phs000912.v1.p1). Study investigators include Elad Ziv and Esther M. John. Genotyping for this study was supported by a grant from NIH (R01 CA120120 to E. Ziv). Sample collection was supported in part by Department of Defense Breast Cancer Research Program (BC030551 to E. Ziv). Additional support was provided by NIH (K24CA169004). The SFBCS was supported by grants to E. John from NIH (R01 CA063446 and R01 CA077305), Department of Defense Breast Cancer Research Program (DAMD17-96-1-6071), and the California Breast Cancer Research Program (7PB-0068). The Northern California site of the Breast Cancer Family Registry (BCFR) was supported by NIH (U01 CA069417 and UM1 CA164920).
African American Breast Cancer GWAS (dbGaP Study Accession phs000851.v1.p1). Study investigators include: Christine Ambrosone, Leslie Bernstein, Chris Haiman, Jennifer Hu, Esther John, Andy Olshan, Wei Zheng, and Regina Ziegler. Funding support was by a Department of Defense Breast Cancer Research Program Era of Hope Scholar Award to C.A.H. (W81XWH-08-1-0383), the Norris Foundation and U19-CA148065. Each of the participating studies was supported by the following grants: MEC (National Institutes of Health grants R01-CA63464, R37-CA54281 and UM1-CA164973); CARE (National Institute for Child Health and Development grant NO1-HD-3-3175, K05 CA136967); WCHS (US Army Medical Research and Material Command (USAMRMC) grant DAMD-17-01-0-0334, the National Institutes of Health grant R01-CA100598 and in part by a grant from the Breast Cancer Research Foundation); CBCS (National Institutes of Health Specialized Program of Research Excellence in Breast Cancer, grant number P50-CA58223 and Center for Environmental Health and Susceptibility National Institute of Environmental Health Sciences, National Institutes of Health, grant number P30-ES10126); PLCO (Intramural Research Program, National Cancer Institute, National Institutes of Health); NBHS (National Institutes of Health grant R01-CA100374); WFBC (National Institutes of Health grant R01-CA73629). The Breast Cancer Family Registry (BCFR) was supported by grant UM1 CA164920 from the National Cancer Institute.
The Breast and Prostate Cancer Cohort Consortium (BPC3) GWAS of Aggressive Prostate Cancer and ER- Breast Cancer (dbGaP Study Accession: phs000812.v1.p1).
The Breast and Prostate Cancer Cohort Consortium (BPC3) genome-wide association studies of advanced prostate cancer and estrogen-receptor negative breast cancer was supported by the National Cancer Institute under cooperative agreements U01-CA98233, U01-CA98710, U01-CA98216, and U01-CA98758 and the Intramural Research Program of the National Cancer Institute, Division of Cancer Epidemiology and Genetics.
Cancer Genetic Markers of Susceptibility (CGEMS) Breast Cancer Genome-wide Association Study (GWAS)—Primary Scan: Nurses' Health Study—Additional Cases: Nurses' Health Study 2 (dbGaP Study Accession: phs000147.v3.p1)
GWAS in African Americans, Latinos and Japanese (dbGaP Study Accession: phs000517.v3.p1). Multiethnic Cohort and the genotyping in this study were funded by grants from the National Institute of Health (CA63464, CA54281, CA098758, CA132839 and HG005922) and the Department of Defense Breast Cancer Research Program (W81XWH-08-1-0383).
Genome-Wide Association Study of Breast Cancer in the African Diaspora—the ROOT study (dbGaP Study Accession: phs000383.v1.p1). The GWAS of Breast Cancer in the African Diaspora is conducted by the University of Chicago and supported by the National Cancer Institute (R01 CA142996-02). This manuscript was not prepared in collaboration with investigators of the GWAS of Breast Cancer in the African Diaspora and does not necessarily reflect the opinions or views of the University of Chicago, or NCI.
Shanghai Breast Cancer Genetics Study (SBCGS) (dbGaP Study Accession: phs000799.v1.p1). We acknowledge the Shanghai Breast Cancer Study (R01CA64277) and Shanghai Women's Health Study (R37CA70867) that generated these data.
The funders had no role in study design, data collection and analysis, decision to publish, or preparation of the manuscript.
Data Availability
The data used came from dbGaP or UK Biobank. These have protocols in place that restrict us from directly sharing the data that we have received. But data are available from the dbGaP and UK Biobank Data Access Committees for researchers who submit a formal application. dbGap links and accession numbers: CGEMS phs000147.v3.p1 https://www.ncbi.nlm.nih.gov/projects/gap/cgi-bin/study.cgi?study_id=phs000147.v3.p1 African Diaspora phs000383.v1.p1 https://www.ncbi.nlm.nih.gov/projects/gap/cgi-bin/study.cgi?study_id=phs000383.v1.p1 GWAS in African Americans, Latinos and Japanese (MEC LABC, MEC JABC) phs000517.v3.p1 https://www.ncbi.nlm.nih.gov/projects/gap/cgi-bin/study.cgi?study_id=phs000517.v3.p1 Shanghai Breast Cancer Genetics Study phs000799.v1.p1 https://www.ncbi.nlm.nih.gov/projects/gap/cgi-bin/study.cgi?study_id=phs000799.v1.p1 Characterizing Genetic Susceptibility to Breast and Prostate Cancer (BPC3) phs000812.v1.p1 https://www.ncbi.nlm.nih.gov/projects/gap/cgi-bin/study.cgi?study_id=phs000812.v1.p1 African American Breast Cancer GWAS (AABC) phs000851.v1.p1 https://www.ncbi.nlm.nih.gov/projects/gap/cgi-bin/study.cgi?study_id=phs000851.v1.p1 San Francisco Bay Area Latina Breast Cancer Study (Latina Admixture) phs000912.v1.p1 https://www.ncbi.nlm.nih.gov/projects/gap/cgi-bin/study.cgi?study_id=phs000912.v1.p1 UK Biobank links: Home Page: http://www.ukbiobank.ac.uk/ Access Procedures: http://www.ukbiobank.ac.uk/wp-content/uploads/2011/11/Access_Procedures_Nov_2011.pdf Registration link for gaining access to the data: https://amsportal.ukbiobank.ac.uk/
Funding Statement
This work was supported by National Institute of Health grants CA112355, CA201358, CA088164, and HL121295, and the University of California, San Francisco Goldberg-Benioff Program in Cancer Translational Biology. The funders had no role in study design, data collection and analysis, decision to publish, or preparation of the manuscript.
References
- 1.Ferlay J, Soerjomataram I, Ervik M, Dikshit R, Eser S, Mathers C, et al. GLOBOCAN 2012 v1.0, Cancer Incidence and Mortality Worldwide: IARC CancerBase No. 11 [Internet]. Lyon, France: International Agency for Research on Cancer; 2013. Available from: http://globocan.iarc.fr, accessed on 09/19/2016.
- 2.Familial breast cancer: collaborative reanalysis of individual data from 52 epidemiological studies including 58,209 women with breast cancer and 101,986 women without the disease. Lancet. 2001; 358(9291):1389–99. 10.1016/S0140-6736(01)06524-2 [DOI] [PubMed] [Google Scholar]
- 3.Kharazmi E, Chen T, Narod S, Sundquist K, Hemminki K. Effect of multiplicity, laterality, and age at onset of breast cancer on familial risk of breast cancer: a nationwide prospective cohort study. Breast Cancer Res Treat. 2014; 144(1):185–92. 10.1007/s10549-014-2848-3 [DOI] [PubMed] [Google Scholar]
- 4.Pharoah PD, Day NE, Duffy S, Easton DF, Ponder BA. Family history and the risk of breast cancer: a systematic review and meta-analysis. Int J Cancer. 1997; 71(5):800–9. [DOI] [PubMed] [Google Scholar]
- 5.Moller S, Mucci LA, Harris JR, Scheike T, Holst K, Halekoh U, et al. The heritability of breast cancer among women in the Nordic Twin Study of Cancer. Cancer Epidemiol Biomarkers Prev. 2016; 25(1):145–50. 10.1158/1055-9965.EPI-15-0913 [DOI] [PubMed] [Google Scholar]
- 6.Zhang B, Beeghly-Fadiel A, Long J, Zheng W. Genetic variants associated with breast-cancer risk: comprehensive research synopsis, meta-analysis, and epidemiological evidence. Lancet Oncol. 2011; 12(5):477–88. 10.1016/S1470-2045(11)70076-6 [DOI] [PMC free article] [PubMed] [Google Scholar]
- 7.Kar SP, Beesley J, Amin Al Olama A, Michailidou K, Tyrer J, Kote-Jarai Z, et al. Genome-wide meta-analyses of breast, ovarian, and prostate cancer association studies identify multiple new susceptibility loci shared by at least two cancer types. Cancer Discov. 2016; 6(9):1052–67. 10.1158/2159-8290.CD-15-1227 [DOI] [PMC free article] [PubMed] [Google Scholar]
- 8.Michailidou K, Beesley J, Lindstrom S, Canisius S, Dennis J, Lush MJ, et al. Genome-wide association analysis of more than 120,000 individuals identifies 15 new susceptibility loci for breast cancer. Nat Genet. 2015; 47(4):373–80. 10.1038/ng.3242 [DOI] [PMC free article] [PubMed] [Google Scholar]
- 9.Gamazon ER, Wheeler HE, Shah KP, Mozaffari SV, Aquino-Michaels K, Carroll RJ, et al. A gene-based association method for mapping traits using reference transcriptome data. Nat Genet. 2015; 47(9):1091–8. 10.1038/ng.3367 [DOI] [PMC free article] [PubMed] [Google Scholar]
- 10.Davis LK, Yu D, Keenan CL, Gamazon ER, Konkashbaev AI, Derks EM, et al. Partitioning the heritability of Tourette syndrome and obsessive compulsive disorder reveals differences in genetic architecture. PLoS Genet. 2013; 9(10):e1003864 10.1371/journal.pgen.1003864 [DOI] [PMC free article] [PubMed] [Google Scholar]
- 11.Gamazon ER, Huang RS, Cox NJ, Dolan ME. Chemotherapeutic drug susceptibility associated SNPs are enriched in expression quantitative trait loci. Proc Natl Acad Sci U S A. 2010; 107(20):9287–92. 10.1073/pnas.1001827107 [DOI] [PMC free article] [PubMed] [Google Scholar]
- 12.Nicolae DL, Gamazon E, Zhang W, Duan S, Dolan ME, Cox NJ. Trait-associated SNPs are more likely to be eQTLs: annotation to enhance discovery from GWAS. PLoS Genet. 2010; 6(4):e1000888 10.1371/journal.pgen.1000888 [DOI] [PMC free article] [PubMed] [Google Scholar]
- 13.UK Biobank: Protocol for a large-scale prospective epidemiological resource [Internet]. UK Biobank Coordinating Centre; 2007. Available from: http://www.ukbiobank.ac.uk/wp-content/uploads/2011/11/UK-Biobank-Protocol.pdf?phpMyAdmin=trmKQlYdjjnQIgJ%2CfAzikMhEnx6, accessed on 02/22/2016. [Google Scholar]
- 14.Antoniou AC, Wang X, Fredericksen ZS, McGuffog L, Tarrell R, Sinilnikova OM, et al. A locus on 19p13 modifies risk of breast cancer in BRCA1 mutation carriers and is associated with hormone receptor-negative breast cancer in the general population. Nat Genet. 2010; 42(10):885–92. 10.1038/ng.669 [DOI] [PMC free article] [PubMed] [Google Scholar]
- 15.Couch FJ, Kuchenbaecker KB, Michailidou K, Mendoza-Fandino GA, Nord S, Lilyquist J, et al. Identification of four novel susceptibility loci for oestrogen receptor negative breast cancer. Nat Commun. 2016; 7:11375 10.1038/ncomms11375 [DOI] [PMC free article] [PubMed] [Google Scholar]
- 16.Couch FJ, Wang X, McGuffog L, Lee A, Olswold C, Kuchenbaecker KB, et al. Genome-wide association study in BRCA1 mutation carriers identifies novel loci associated with breast and ovarian cancer risk. PLoS Genet. 2013; 9(3):e1003212 10.1371/journal.pgen.1003212 [DOI] [PMC free article] [PubMed] [Google Scholar]
- 17.Garcia-Closas M, Couch FJ, Lindstrom S, Michailidou K, Schmidt MK, Brook MN, et al. Genome-wide association studies identify four ER negative-specific breast cancer risk loci. Nat Genet. 2013; 45(4):392–8, 8e1-2. 10.1038/ng.2561 [DOI] [PMC free article] [PubMed] [Google Scholar]
- 18.Kuchenbaecker KB, Neuhausen SL, Robson M, Barrowdale D, McGuffog L, Mulligan AM, et al. Associations of common breast cancer susceptibility alleles with risk of breast cancer subtypes in BRCA1 and BRCA2 mutation carriers. Breast Cancer Res. 2014; 16(6):3416 10.1186/s13058-014-0492-9 [DOI] [PMC free article] [PubMed] [Google Scholar]
- 19.Siddiq A, Couch FJ, Chen GK, Lindstrom S, Eccles D, Millikan RC, et al. A meta-analysis of genome-wide association studies of breast cancer identifies two novel susceptibility loci at 6q14 and 20q11. Hum Mol Genet. 2012; 21(24):5373–84. 10.1093/hmg/dds381 [DOI] [PMC free article] [PubMed] [Google Scholar]
- 20.Cai Q, Zhang B, Sung H, Low SK, Kweon SS, Lu W, et al. Genome-wide association analysis in East Asians identifies breast cancer susceptibility loci at 1q32.1, 5q14.3 and 15q26.1. Nat Genet. 2014; 46(8):886–90. 10.1038/ng.3041 [DOI] [PMC free article] [PubMed] [Google Scholar]
- 21.Zeller T, Wild P, Szymczak S, Rotival M, Schillert A, Castagne R, et al. Genetics and beyond—the transcriptome of human monocytes and disease susceptibility. PLoS One. 2010; 5(5):e10693 10.1371/journal.pone.0010693 [DOI] [PMC free article] [PubMed] [Google Scholar]
- 22.Marcon E, Ni Z, Pu S, Turinsky AL, Trimble SS, Olsen JB, et al. Human-chromatin-related protein interactions identify a demethylase complex required for chromosome segregation. Cell Rep. 2014; 8(1):297–310. 10.1016/j.celrep.2014.05.050 [DOI] [PubMed] [Google Scholar]
- 23.Michailidou K, Hall P, Gonzalez-Neira A, Ghoussaini M, Dennis J, Milne RL, et al. Large-scale genotyping identifies 41 new loci associated with breast cancer risk. Nat Genet. 2013; 45(4):353–61, 61e1-2. 10.1038/ng.2563 [DOI] [PMC free article] [PubMed] [Google Scholar]
- 24.Petridis C, Brook MN, Shah V, Kohut K, Gorman P, Caneppele M, et al. Genetic predisposition to ductal carcinoma in situ of the breast. Breast Cancer Res. 2016; 18(1):22 10.1186/s13058-016-0675-7 [DOI] [PMC free article] [PubMed] [Google Scholar]
- 25.Purrington KS, Slager S, Eccles D, Yannoukakos D, Fasching PA, Miron P, et al. Genome-wide association study identifies 25 known breast cancer susceptibility loci as risk factors for triple-negative breast cancer. Carcinogenesis. 2014; 35(5):1012–9. 10.1093/carcin/bgt404 [DOI] [PMC free article] [PubMed] [Google Scholar]
- 26.Brachner A, Foisner R. Lamina-associated polypeptide (LAP)2α and other LEM proteins in cancer biology In: Schirmer EC, de las Heras JI, editors. Cancer Biology and the Nuclear Envelope: Recent Advances May Elucidate Past Paradoxes. 773 2014/02/25 ed. New York, NY: Springer New York; 2014. p. 143–63. [Google Scholar]
- 27.Bolton KL, Tyrer J, Song H, Ramus SJ, Notaridou M, Jones C, et al. Common variants at 19p13 are associated with susceptibility to ovarian cancer. Nat Genet. 2010; 42(10):880–4. 10.1038/ng.666 [DOI] [PMC free article] [PubMed] [Google Scholar]
- 28.Pharoah PD, Tsai YY, Ramus SJ, Phelan CM, Goode EL, Lawrenson K, et al. GWAS meta-analysis and replication identifies three new susceptibility loci for ovarian cancer. Nat Genet. 2013; 45(4):362–70, 70e1-2. 10.1038/ng.2564 [DOI] [PMC free article] [PubMed] [Google Scholar]
- 29.Nordgard SH, Johansen FE, Alnaes GI, Bucher E, Syvanen AC, Naume B, et al. Genome-wide analysis identifies 16q deletion associated with survival, molecular subtypes, mRNA expression, and germline haplotypes in breast cancer patients. Genes Chromosomes Cancer. 2008; 47(8):680–96. 10.1002/gcc.20569 [DOI] [PubMed] [Google Scholar]
- 30.Driouch K, Dorion-Bonnet F, Briffod M, Champeme MH, Longy M, Lidereau R. Loss of heterozygosity on chromosome arm 16q in breast cancer metastases. Genes Chromosomes Cancer. 1997; 19(3):185–91. [DOI] [PubMed] [Google Scholar]
- 31.Cody R, Stewart D, DeForni M, Moore M, Dallaire B, Azarnia N, et al. Multicenter phase II study of brequinar sodium in patients with advanced breast cancer. Am J Clin Oncol. 1993; 16(6):526–8. [DOI] [PubMed] [Google Scholar]
- 32.Ha VL, Luo R, Nie Z, Randazzo PA. Contribution of AZAP-Type Arf GAPs to cancer cell migration and invasion. Adv Cancer Res. 2008; 101:1–28. 10.1016/S0065-230X(08)00401-6 [DOI] [PMC free article] [PubMed] [Google Scholar]
- 33.Hashimoto S, Onodera Y, Hashimoto A, Tanaka M, Hamaguchi M, Yamada A, et al. Requirement for Arf6 in breast cancer invasive activities. Proc Natl Acad Sci U S A. 2004; 101(17):6647–52. 10.1073/pnas.0401753101 [DOI] [PMC free article] [PubMed] [Google Scholar]
- 34.Garrido P, Osorio FG, Moran J, Cabello E, Alonso A, Freije JM, et al. Loss of GLUT4 induces metabolic reprogramming and impairs viability of breast cancer cells. J Cell Physiol. 2015; 230(1):191–8. 10.1002/jcp.24698 [DOI] [PubMed] [Google Scholar]
- 35.Rissoan MC, Duhen T, Bridon JM, Bendriss-Vermare N, Peronne C, de Saint Vis B, et al. Subtractive hybridization reveals the expression of immunoglobulin-like transcript 7, Eph-B1, granzyme B, and 3 novel transcripts in human plasmacytoid dendritic cells. Blood. 2002; 100(9):3295–303. 10.1182/blood-2002-02-0638 [DOI] [PubMed] [Google Scholar]
- 36.Li Q, Stram A, Chen C, Kar S, Gayther S, Pharoah P, et al. Expression QTL-based analyses reveal candidate causal genes and loci across five tumor types. Hum Mol Genet. 2014; 23(19):5294–302. 10.1093/hmg/ddu228 [DOI] [PMC free article] [PubMed] [Google Scholar]
- 37.Haiman CA, Chen GK, Vachon CM, Canzian F, Dunning A, Millikan RC, et al. A common variant at the TERT-CLPTM1L locus is associated with estrogen receptor-negative breast cancer. Nat Genet. 2011; 43(12):1210–4. 10.1038/ng.985 [DOI] [PMC free article] [PubMed] [Google Scholar]
- 38.Hunter DJ, Kraft P, Jacobs KB, Cox DG, Yeager M, Hankinson SE, et al. A genome-wide association study identifies alleles in FGFR2 associated with risk of sporadic postmenopausal breast cancer. Nat Genet. 2007; 39(7):870–4. 10.1038/ng2075 [DOI] [PMC free article] [PubMed] [Google Scholar]
- 39.Schumacher FR, Berndt SI, Siddiq A, Jacobs KB, Wang Z, Lindstrom S, et al. Genome-wide association study identifies new prostate cancer susceptibility loci. Hum Mol Genet. 2011; 20(19):3867–75. 10.1093/hmg/ddr295 [DOI] [PMC free article] [PubMed] [Google Scholar]
- 40.UK Biobank Axiom Array: Content Summary [Internet]. 2014. Available from: http://www.ukbiobank.ac.uk/wp-content/uploads/2014/04/UK-Biobank-Axiom-Array-Content-Summary-2014.pdf, accessed on 02/22/2016.
- 41.Genotyping and quality control of UK Biobank, a large-scale, extensively phenotyped prospective resource [Internet]. 2015. Available from: http://www.ukbiobank.ac.uk/wp-content/uploads/2014/04/UKBiobank_genotyping_QC_documentation-web.pdf, accessed on 02/22/2016.
- 42.Genotype imputation and genetic association studies of UK Biobank [Internet]. 2015. Available from: http://www.ukbiobank.ac.uk/wp-content/uploads/2014/04/imputation_documentation_May2015.pdf, accessed on 02/22/2016.
- 43.Benveniste AP, Marom EM, Benveniste MF, Mawlawi OR, Miranda RN, Yang W. Metastases to the breast from extramammary malignancies—PET/CT findings. Eur J Radiol. 2014; 83(7):1106–12. 10.1016/j.ejrad.2014.04.015 [DOI] [PubMed] [Google Scholar]
- 44.Michigan Imputation Server [Internet]. Available from: https://imputationserver.sph.umich.edu/index.html, accessed on 02/23/2016.
- 45.Price AL, Patterson NJ, Plenge RM, Weinblatt ME, Shadick NA, Reich D. Principal components analysis corrects for stratification in genome-wide association studies. Nat Genet. 2006; 38(8):904–9. 10.1038/ng1847 [DOI] [PubMed] [Google Scholar]
- 46.The Genotype-Tissue Expression (GTEx) project. Nat Genet. 2013; 45(6):580–5. 10.1038/ng.2653 [DOI] [PMC free article] [PubMed] [Google Scholar]
- 47.Battle A, Mostafavi S, Zhu X, Potash JB, Weissman MM, McCormick C, et al. Characterizing the genetic basis of transcriptome diversity through RNA-sequencing of 922 individuals. Genome Res. 2014; 24(1):14–24. 10.1101/gr.155192.113 [DOI] [PMC free article] [PubMed] [Google Scholar]
- 48.Willer CJ, Li Y, Abecasis GR. METAL: fast and efficient meta-analysis of genomewide association scans. Bioinformatics. 2010; 26(17):2190–1. 10.1093/bioinformatics/btq340 [DOI] [PMC free article] [PubMed] [Google Scholar]
Associated Data
This section collects any data citations, data availability statements, or supplementary materials included in this article.
Supplementary Materials
Effect estimates and standard errors for associations nominally (p-value < 0.05) significant in a meta-analysis of the discovery Up for a Challenge datasets between breast cancer risk and the imputed expression of genes based on (A) breast tissue and (B) whole blood.
(PDF)
Association of breast cancer risk with SNPs that contribute to the expression of (A) RCCD1 in breast tissue, (B) DHODH in breast tissue, (C) ANKLE1 in breast tissue, (D) RCCD1 in whole blood, (E) ACAP1 in whole blood, and (F) LRRC25 in whole blood.
(PDF)
Number of subjects removed from each cohort because of outlier principal components.
(PDF)
Forest plots of PrediXcan results for breast tissue expression of (A) RCCD1, (B) DHODH, and (C) ANKLE1.
(PDF)
Forest plots of PrediXcan results for whole blood expression of (A) RCCD1, (B) ACAP1, and (C) LRRC25.
(PDF)
Volcano plots of PrediXcan results for associations between breast cancer risk and the imputed expression of (A) 4,469 genes based on breast tissue and (B) 9,768 genes based on whole blood (genes with beta estimates outside three standard deviations from the mean were removed from the plots– 4 for breast tissue and 23 for whole blood).
(PDF)
Data Availability Statement
The data used came from dbGaP or UK Biobank. These have protocols in place that restrict us from directly sharing the data that we have received. But data are available from the dbGaP and UK Biobank Data Access Committees for researchers who submit a formal application. dbGap links and accession numbers: CGEMS phs000147.v3.p1 https://www.ncbi.nlm.nih.gov/projects/gap/cgi-bin/study.cgi?study_id=phs000147.v3.p1 African Diaspora phs000383.v1.p1 https://www.ncbi.nlm.nih.gov/projects/gap/cgi-bin/study.cgi?study_id=phs000383.v1.p1 GWAS in African Americans, Latinos and Japanese (MEC LABC, MEC JABC) phs000517.v3.p1 https://www.ncbi.nlm.nih.gov/projects/gap/cgi-bin/study.cgi?study_id=phs000517.v3.p1 Shanghai Breast Cancer Genetics Study phs000799.v1.p1 https://www.ncbi.nlm.nih.gov/projects/gap/cgi-bin/study.cgi?study_id=phs000799.v1.p1 Characterizing Genetic Susceptibility to Breast and Prostate Cancer (BPC3) phs000812.v1.p1 https://www.ncbi.nlm.nih.gov/projects/gap/cgi-bin/study.cgi?study_id=phs000812.v1.p1 African American Breast Cancer GWAS (AABC) phs000851.v1.p1 https://www.ncbi.nlm.nih.gov/projects/gap/cgi-bin/study.cgi?study_id=phs000851.v1.p1 San Francisco Bay Area Latina Breast Cancer Study (Latina Admixture) phs000912.v1.p1 https://www.ncbi.nlm.nih.gov/projects/gap/cgi-bin/study.cgi?study_id=phs000912.v1.p1 UK Biobank links: Home Page: http://www.ukbiobank.ac.uk/ Access Procedures: http://www.ukbiobank.ac.uk/wp-content/uploads/2011/11/Access_Procedures_Nov_2011.pdf Registration link for gaining access to the data: https://amsportal.ukbiobank.ac.uk/