

Abstract
Glutathione disulfide (GSSG) is an endogenous peptide and the oxidized form of glutathione. The impacts of GSSG on cell function/dysfunction remain largely unexplored due to a lack of method to specifically increase intracellular GSSG. We recently developed GSSG liposomes that can specifically increase intracellular GSSG. The increase affected 3 of the 4 essential steps (cell detachment, migration, invasion, and adhesion) of cancer metastasis in vitro and, accordingly, produced a significant inhibition of cancer metastasis in vivo. In this investigation, the effect of GSSG liposomes on cancer growth was investigated with B16-F10 and NCI-H226 cells in vitro and with B16-F10 cells in C57BL/6 mice in vivo. Experiments were conducted to elucidate the effect on cell death through promotion of apoptosis and the effect on the cell cycle. The in vivo results with C57BL/6 mice implanted subcutaneously with B16-F10 cells showed that GSSG liposomes retarded tumor proliferation more effectively than that of dacarbazine, a chemotherapeutic drug for the treatment of melanoma. The GSSG liposomes by intravenous injection (GLS IV) and GSSG liposomes by intratumoral injection (GLS IT) showed a tumor proliferation retardation of 85% ± 5.7% and 90% ± 3.9%, respectively, compared with the phosphate-buffered saline (PBS) control group. The median survival rates for mice treated with PBS, blank liposomes, aqueous GSSG, dacarbazine, GLS IV, and GLS IT were 7, 7, 7.5, 7.75, 11.5, and 16.5 days, respectively. The effective antimetastatic and antigrowth activities warrant further investigation of the GSSG liposomes as a potentially effective therapeutic treatment for cancer.
Keywords: Glutathione disulfide liposomes, apoptosis, B16-F10 and NCI-H226
Introduction
Glutathione disulfide (GSSG) is an endogenous peptide. It is the oxidized form of glutathione (GSH). Glutathione is a major antioxidant and is present in millimolar concentration in the body.1 Structurally, GSH is a 3-amino-acid peptide consisting of Glu–Cys–Gly (Figure 1). The thiol or sulfhydryl group (–SH) of the cysteine residue in GSH is key for the functioning of GSH. One of the functions of GSH is to protect biological systems from oxidizing species such as reactive oxygen species (ROS). Glutathione achieves this using the thiol group to reduce oxidizing species. In the meantime, the thiol itself is oxidized to a disulfide (–S–S–) bond, resulting in the formation of GSSG (Figure 1). Under the physiological condition, GSSG will be quickly reduced back to GSH by glutathione reductase to maintain a high ratio (>100:1) of GSH:GSSG in biological systems.1 Although GSSG is an endogenous molecule and commercially available, it is not cell membrane permeable. The study of the impacts of GSSG on cell functions and dysfunctions has been hampered by the lack of an effective method to increase specifically intracellular GSSG.
Figure 1.

Oxidation of glutathione (GSH) by oxidizing species to form glutathione disulfide (GSSG) and reduction of GSSG by glutathione reductase.
We developed GSSG liposomes that can effectively deliver GSSG into cells.2 The GSSG liposomes at 1 mg/mL concentration increased intracellular GSSG by 27-fold in NCI-H226 cells (human non–small cell lung carcinoma).2 The increased GSSG also led to a significant increase in cellular protein S-glutathionylation confirming GSSG delivered by liposomes is biologically functional.2 We also found that GSSG liposomes completely prevented cells from detaching and migrating with several cancer cell lines and exhibited no effect on cell adhesion.3 The invasion ability of the cells was also significantly inhibited.3 Cell detachment, migration, adhesion, and invasion are 4 essential steps involved in cancer metastasis, with cell detachment being the first and required step.4,5 Consistently, an investigation with an in vivo murine melanoma metastasis model demonstrated that GSSG liposomes at 0.48 g/kg (a comparable concentration that produced the in vitro prevention of cell detachment and migration) produced almost a complete inhibition of melanoma metastasis.3
In this study, the effect of the GSSG liposomes on cancer growth at the same dosage was investigated with female C57BL/6 mice implanted subcutaneously with B16-F10 cells. Our data demonstrated that GSSG liposomes significantly retarded tumor proliferation. The retardation was much more effective than dacarbazine, a chemotherapeutic drug for the treatment of melanoma and used as a positive control in this study. In vitro data at 1 mg/mL showed that GSSG liposomes resumed the apoptotic ability of both B16-F10 and NCI-H226 cell lines. A cell cycle study revealed that GSSG liposomes exhibited no effect on the cell cycle. Glutathione disulfide aqueous solution and blank liposomes (BLS) exhibited no such in vivo and in vitro effects confirming that the cancer proliferation retardation effects were a result of GSSG being delivered into cells by the liposomes. A preliminary toxicity study with 4 CD1 female mice at a dosage of 2.7-fold of the effective in vivo dosage revealed no sign of toxicities. The effective cancer proliferation retardation together with the antimetastatic effect reported in a separate study3 warrants further investigation of GSSG liposomes as an effective therapeutic agent for cancer treatment.
Materials and Methods
Animals
Female C57BL/6 mice were obtained from the National Cancer Institute (NCI). Animals were housed in a cage with 4 mice/cage and provided free access to food and water. The animals were used at least 1 week after arrival. All animal experimental protocols were approved by the South Dakota State University Institutional Animal Care and Use Committee.
Chemicals
Glutathione disulfide liposomes were prepared as described previously.2 The GSSG liposomes at 1 mg/mL represent the liposome formulation containing 1 mg GSSG and 1 mg lipid. The 10 mg/mL GSSG liposomes were prepared as a stock solution for all the experiments. TACS 2 TdT-Fluor In Situ Apoptosis Detection Kit (terminal deoxynucleotidyl transferase dUTP nick end labeling [TUNEL] assay) was purchased from Trevigen (Gaithersburg, MD, USA). Trypan blue dye was obtained from AMRESCO (Solon, OH, USA). Ribonuclease A (RNase A) was purchased from Sigma-Aldrich Chemical Co. (St. Louis, MO, USA). Propidium iodide and 4′,6-diamidino-2-phenylindole (DAPI) were supplied by MP Biomedicals (Solon, OH, USA). Carboxy-2′,7′-dichlorodihydrofluorescin diacetate (carboxy-H2DCFDA) was purchased from Invitrogen (Carlsbad, CA, USA).
Cell lines, cell culture, and antibodies
B16-F10 cells (murine melanoma) were obtained as a gift from Dr Hemachand Tummala. NCI-H226 cells were obtained from the NCI. Both cell lines were maintained as monolayers and passaged as necessary in an RPMI 1640 growth medium (RPMI 1640 medium supplemented with 10% fetal bovine serum [FBS] and 1% penicillin/streptomycin). RPMI 1640 medium, penicillin/streptomycin, phosphate-buffered saline (PBS), and Dulbecco phosphate-buffered saline (DPBS) were obtained from Mediatech (Herndon, VA, USA). Fetal bovine serum was purchased from Atlanta Biologicals (Lawrenceville, GA, USA). Anti–signal transducer and activator of transcription 3 (STAT3) mouse monoclonal antibody was purchased from Cell Signaling Technology (Danvers, MA, USA). Anti–caspase 3 rabbit polyclonal antibody was obtained from Abcam (Cambridge, MA, USA). Anti-p53 mouse monoclonal antibody was purchased from Zymed Laboratories (South San Francisco, CA, USA). Anti-p21 mouse monoclonal antibody was purchased from Santa Cruz Biotechnology (Dallas, TX, USA).
In vitro cell growth inhibition study—growth inhibition study
Cells (5 × 10⁵ cells/well) were seeded to a tissue culture dish (60 mm × 15 mm) in the RPMI 1640 growth medium and incubated in a humidified atmosphere of 5% CO2 at 37°C for 24 hours for attachment. The medium was removed and the residual monolayers were washed twice with ice-cold PBS, replaced with the growth medium containing GSSG liposomes (1 mg/mL), and incubated in a CO2 incubator at 37°C for 0, 24, 48, and 72 hours. At the end of the treatment, cells were harvested using a sterile cell scraper and counted using a Cellometer Auto T4 Plus cell counter (Nexcelom Bioscience, Lawrence, MA, USA). Parallel experiments were conducted with the growth medium containing PBS (control 1), growth medium containing BLS (control 2), or growth medium containing aqueous GSSG (GAQ) (1 mg/mL) (control 3).
In vitro cell growth inhibition study—determination of cytostatic effects
Each of the three 24-well plates (plates 1, 2, and 3) was seeded with cells (1.2 × 10⁴ cells/well) in the RPMI 1640 growth medium. The plates were incubated in a humidified atmosphere of 5% CO2 at 37°C for 24 hours for attachment. In each of the 3 plates, the medium was removed and the cells were washed twice with PBS and added with the growth medium containing GSSG liposomes (1 mg/mL), growth medium containing PBS (control 1), BLS (control 2), or GAQ (1 mg/mL) (control 3) as described above. Plates 1 and 3 were incubated in a CO2 incubator at 37°C for 24 hours (plate 1) and 48 hours (plate 3), respectively, before the cells were stained with trypan blue dye, as described by the manufacturer, and images were taken to determine cell viability. For plate 2, the medium was replaced with fresh growth medium after 24 hours of incubation and the plate was placed back in the incubator for an additional 24 hours before cells were stained with trypan blue dye, and images were taken. Images were obtained on an inverted fluorescence microscope (Observer A1, AX-10 Zeiss) connected to a digital microscopes & digital camera (Zeiss AxioCam MRc5, Jena, Germany).
TUNEL assay
The ability of GSSG liposomes to induce apoptosis was studied by the TUNEL assay using a TACS 2 TdT-Fluor In Situ Apoptosis Detection Kit. The experiments were conducted the same way as described above for the determination of the cytostatic effect in the in vitro cell growth inhibition study except that the TUNEL assay was conducted instead of the trypan blue assay. The manufacturer’s instruction was followed for the TUNEL assay. In addition to the TUNEL assay, DAPI was added simultaneously to stain nuclei as described by the manufacturer. The TUNEL-positive cells were evaluated in at least 5 random fields at ×5 magnification, and the average was taken and expressed as the number of apoptotic cells of each. TACS-Nuclease Buffer, provided with the TUNEL assay kit as the positive control, was included in the experiment.
Effects on the cell cycle
Cells (1 × 10⁶) plated in a 100-mm culture dish in the RPMI 1640 growth medium were incubated in a humidified atmosphere of 5% CO2 at 37°C for 24 hours for attachment before being treated with GSSG liposomes (1 mg/mL) for 24 and 48 hours. At the end of treatment, cells were harvested using a sterile cell scraper and washed twice with ice-cold PBS. Cells were fixed with 70% ethanol (3 mL) in DPBS and stored at 4°C.6 Before flow cytometry analysis, the fixed cells were centrifuged (700g, 5 minutes) and washed with staining buffer (DPBS with 2% FBS and 0.01% NaN3 filtered through a 0.2-µm pore filter). After the wash, the cell number was adjusted to 1 million cells/mL in the staining buffer followed by centrifugation (700g, 5 minutes). The cell pellets were treated with 100 µL of RNase A (1 mg/mL) for 30 minutes at 37°C, added with 20 µL of propidium iodide (1 mg/mL) and 900 µL of the staining buffer to bring the total volume to 1 mL. The sample was then incubated in the dark at room temperature for 30 minutes before being analyzed with a BD FACScan flow cytometer (BD Biosciences, San Jose, CA, USA) using CellQuest Software (BD Biosciences). Control experiments (control 1, control 2, or control 3) were conducted as described above.
Western blot analysis
Cell lysates and Western blot analyses were performed as described by Dachineni et al.7 Briefly, cells (2 × 10⁶ cells in 10 mL in a Petri dish) were subjected to various treatments for 24 hours, followed by washing with PBS and collected using a sterile cell scraper in lysis buffer (10 mM Tris-HCl, pH 7.4, 150 mM NaCl, 15% glycerol, 1% Triton X-100 with protease inhibitors). Samples containing 50 µg of proteins were separated on 6% or 10% polyacrylamide gel electrophoresis and immunoblotted with respective antibodies. The intensities of bands were quantified using ImageJ software.
Determination of ROS
The ROS was quantified using carboxy-H2DCFDA by following the manufacturer’s instruction. Briefly, B16-F10 or NCI-H226 cells were seeded in a 96-well plate at a density of 10 000 cells/well, followed by attachment at 37°C in a humidified atmosphere of 5% CO2 for 24 hours before being treated with GSSG liposomes (1 mg/mL) or BLS for 2 or 24 hours followed by washing with PBS 3 times. Cells were stained with 10-µM carboxy-H2DCFDA for 30 minutes. The ROS levels were determined as fluorescence intensity which was measured at 492 nm (excitation) and 527 nm (emission) on a SpectraMax M2 fluorescence microplate reader (Molecular Devices, Sunnyvale, CA, USA).
Determination of intracellular GSH
Intracellular GSH was quantified by following a literature procedure with minor modification.8 NCI-H226 cells and B16-F10 cells were seeded in a 10-mL cell culture flask at a concentration of 2 × 10⁶ cells/flask. The cells were allowed to attach for 24 hours followed by various treatments for 24 hours (control 1 [PBS], control 2 [BLS], control 3 [GAQ, 1 mg/mL], GSSG liposomes [1 and 0.5 mg/mL]). Cells were washed with PBS 3 times and collected using a sterile cell scraper in 2 mL sulfosalicylic acid (3%, w/w) followed by sonication (15 minutes) to break the cell membrane. The samples were dried by lyophilization before being resuspended in 0.5 mL water. The samples were centrifuged at 15 000g for 1 minute. The supernatant was used for GSH quantification as reported.8
In vivo effect of GSSG liposomes on cancer growth
A murine melanoma model with female C57BL/6 mice employed by Wack and colleagues was used for the investigation. Wack and colleagues9 used the murine melanoma model to determine the effects of dacarbazine and its combination with dinitrochlorobenzene on subcutaneous melanoma growth and pulmonary metastases. Briefly, the hair of the right flank of a mouse was removed using Nair hair removing cream 1 day before inoculation of B16-F10 cells (2 × 10⁶ in 50 µL PBS) through subcutaneous injection. A treatment started after the tumors had reached an average volume of 25 mm3. The treatment included PBS (control 1), BLS (control 2), GAQ (0.48 g/kg) (control 3), GSSG liposomes (0.48 g/kg), and dacarbazine (50 mg/kg) (positive control). The dosing schedule involved daily injection for 5 days with a 2-day break for 10 days for intravenous (IV) injection of PBS, GAQ, BLS, and GSSG liposomes, or intratumoral (IT) injection of GSSG. Treatment with dacarbazine involved an intraperitoneal injection on every fourth day on day 1 and day 4. The weight of mice and the tumor volume were recorded daily. The tumor volume was calculated based on the following formula: 0.5 × L (length) × W (width)2. Mice were killed by cervical dislocation when the tumor volume reached an average volume of 2000 mm3.
Statistical Analysis
Comparison of data from different treatments was statistically analyzed with Student t test and analysis of variance. The log-rank test was used to compare survival rates of 2 different treatments.
Results and Discussion
In vitro cancer growth inhibition and apoptosis
B16-F10 cells have been extensively used as murine melanoma models in vitro and in vivo.10-14 Therefore, this cell line was used in this investigation. In addition, NCI-H226 cells were used to check whether the effect of GSSG liposomes is limited to B16-F10 cells. When B16-F10 and NCI-H226 cells were treated with GSSG liposomes for 24 hours, cells remained attached and the cell number did not appear to increase. A trypan blue assay revealed that the cells were greater than 95% viable although morphological changes were observed for the group treated with GSSG liposomes (Figure 2). The visual observation of a halt in cell proliferation and a greater than 95% cell viability determined by the trypan blue assay led us to suspect that GSSG liposomes might exhibit a cytostatic effect. To determine that, cells, after being treated with GSSG liposomes for 0, 24, 48, and 72 hours, were collected with a sterile cell scraper and counted using a cell counter. The reason that cells had to be collected by a scraper instead of trypsinization is because cells treated with GSSG liposomes would not detach by trypsinization.3 As shown in Figure 3, the number of cells treated with GSSG liposomes remained almost constant over the 72-hour period for both B16-F10 and NCI-H226 cells when compared with the control in which cells were treated with the growth medium containing PBS (control 1). In the meantime, cells treated with BLS (control 2) and GAQ (control 3) exhibited the same growth rates as those in control 1, confirming that it was GSSG being delivered into cells that produced a halt in cell proliferation (Figure 3). As determined by the trypan blue assay, cells treated with GSSG liposomes exhibited the same viability (>95%) as those in the controls at 24 hours. In contrast, the trypan blue assay revealed that greater than 95% of the cells treated with GSSG liposomes were dead at 48 and 72 hours, whereas cells in all the controls remained greater than 95% alive. These results suggested that although GSSG liposomes caused a complete halt in cell proliferation and the cells were still alive by the trypan blue assay in the first 24 hours, these cells eventually died afterward. The data raised a question whether these cells, while they were still alive, could resume growth if the GSSG liposome treatment medium was replaced with a fresh growth medium. An experiment was conducted in which cells were first treated with GSSG liposomes for 24 hours, followed by replacement of the GSSG liposome treatment medium with a fresh growth medium, and then allowed to grow for an additional 24 hours. To our surprise, no cell growth was observed, and rather, greater than 95% cells were found dead by the trypan blue assay. In the meantime, cells in controls 1 to 3 grew normally with greater than 95% cell viability. This experiment indicates that after 24-hour treatment with GSSG liposomes, cells were probably on an irreversible path to death despite the fact that they were greater than 95% alive by the trypan blue assay.
Figure 2.

Effect of GSSG liposomes on the morphology of cells: (A) B16-F10 cells and (B) NCI-H226 cells. Cells were treated for 24 hours with GSSG liposomes (1 mg/mL), medium containing PBS (control 1), blank liposomes (1 mg/mL, control 2), and aqueous GSSG (1 mg/mL, control 3) before being stained with trypan blue dye for membrane-compromised cells. Morphological changes of cells were noticed for both B16-F10 and NCI-H226 cells treated with GSSG liposomes. GSSG indicates glutathione disulfide; PBS, phosphate-buffered saline.
Figure 3.

Effects of different treatments on cell growth: (A) B16-F10 cells and (B) NCI-H226 cells. Cells were subjected to various treatments (GSSG liposomes [1 mg/mL], medium containing phosphate-buffered saline [control 1], blank liposomes [1 mg/mL, control 2], and aqueous GSSG [1 mg/mL, control 3]) before being harvested at 0, 24, 48, and 72 hours using a sterile cell scraper and counted using a Cellometer Auto T4 Plus cell counter (Nexcelom Bioscience). Comparison of data from different treatments was evaluated using analysis of variance. GSSG indicates glutathione disulfide (***, P < 0.001).
To further investigate the viability status of cells treated with GSSG liposomes for 24 and 48 hours, the TUNEL assay was used. The TUNEL assay would reveal the apoptosis status of cells. The data are presented in Figure 4. The green spots are cells undergoing apoptosis, whereas the blue spots are nuclei stained with DAPI indicating the total number of cells. TACS-Nuclease Buffer was used as a positive control. The percentage of cell apoptosis was calculated based on the number of cells undergoing apoptosis (green spots) vs the total cell number reflected by the blue spots. ImageJ software, software obtained from the Web site of the National Institutes of Health (http://rsbweb.nih.gov/ij/), was used to quantify both green spots and blue spots.15,16 Our data demonstrate that no apoptosis was observed for cells in controls 1 to 3. As expected, greater than 95% of the cells were found to undergo apoptosis when treated with TACS-Nuclease Buffer. Similar to the positive control, greater than 95% of the cells were found to undergo apoptosis for both B16-F10 and NCI-H226 cells when treated with GSSG liposomes for 24 and 48 hours (Figure 4). This is interesting because cell viability, determined by the trypan blue assay, was greater than 95% at 24 hours for cells treated with GSSG liposomes.
Figure 4.

Effects of various treatments on apoptosis of cancer cells: (A) B16-F10 cells and (B) NCI-H226 cells. Cells were subjected to a treatment (control: medium containing PBS, BLS, GAQ [1 mg/mL]; positive control: TACS-Nuclease Buffer and GLS [1 mg/mL]) in a 24-well plate in a CO2 incubator at 37°C, as described in Figure 3, except that the TUNEL assay was conducted instead of the trypan blue assay. Images were obtained on an inverted fluorescence microscope (Observer A1, AX-10 Zeiss) connected to a digital microscopes & digital camera (Zeiss AxioCam MRc5, Jena, Germany). BLS indicates blank liposomes; DAPI, 4′,6-diamidino-2-phenylindole; GAQ, aqueous GSSG; GLS, GSSG liposomes; PBS, phosphate-buffered saline; TUNEL, terminal deoxynucleotidyl transferase dUTP nick end labeling.
The discrepancy in the percentages of the cell viability determined by the trypan blue assay and the percentages of cells undergoing apoptosis at 24 hours is likely related to the assay mechanisms. The trypan blue assay determines the cell viability based on the cell membrane integrity. The TUNEL assay determines cell apoptosis based on the formation of DNA fragments. It is likely that the cell membrane remained intact for cells treated with GSSG liposomes for 24 hours even though the cells were undergoing apoptosis already. This was further confirmed by the results from the experiment in which cells, after being treated with GSSG liposomes for 24 hours, were allowed to grow in a fresh growth medium for an additional 24 hours. These cells did not resume any growth and were still undergoing greater than 95% apoptosis (Figure 4). Therefore, it is concluded that the observation of no increase in cell number for cells treated with GSSG liposomes was due to the reason that the cells were undergoing apoptosis, not because of the cells halting their growth (cytostatic).
Effects on the cell cycle distribution
The effect of GSSG liposomes on cell cycle distribution was investigated. When treated with GSSG liposomes (1 mg/mL) for 24 and 48 hours, both B16-F10 and NCI-H226 cells showed no change in cell cycle distribution. No effect on the cell cycle was observed with either BLS or GAQ solution (1 mg/mL) . Figure 5A and B provides histograms derived from cells treated with different treatments for 24 hours and the percentages of cells in different stages of the cell cycle.
Figure 5.

Effect of glutathione disulfide (GSSG) liposomes on cell cycle distribution. (A) Cell cycle histograms, data presented were from 1 representative of 3 independent experiments, and (B) distribution percentages of cells in different stages of the cell cycle. Results are presented as mean ± SD of 3 independent experiments and analyzed by analysis of variance. Cells were treated for 24 hours with GSSG liposomes (1 mg/mL), medium containing phosphate-buffered saline (control 1), blank liposomes (1 mg/mL, control 2), and aqueous GSSG (1 mg/mL, control 3). After staining with propidium iodide, cell cycle distribution was analyzed using a flow cytometer.
Effects on caspase 3, p53, p21, and STAT3
The effects of GSSG liposomes on caspase 3, p53, p21, and STAT3 were investigated in NCI-H226 cells by the Western blot analysis. Caspase 3 is a caspase protein formed from procaspase 3 through proteolysis and observed in most apoptosis initiated by the extrinsic or intrinsic apoptotic pathway. Interestingly, caspase 3 was not detected, whereas procaspase 3 was detected (Figure 6). A significant band of caspase 3 was observed for the positive control (staurosporine) (Figure 6), confirming that the antibody was able to detect caspase 3 if it was present. Similar results were observed with B16-F10 cells (data not shown). A search of literature revealed that an increase in intracellular GSSG could cause glutathionylation of procaspase 3.17 Glutathionylation of procaspase 3 led to the inhibition of their ability to be proteolytically activated to form caspase 3.17 The GSSG liposomes deliver GSSG into cells and are known to cause glutathionylation of proteins.2 Therefore, it is likely that the lack of detection of caspase 3 was a result of glutathionylation of procaspase 3.
Figure 6.
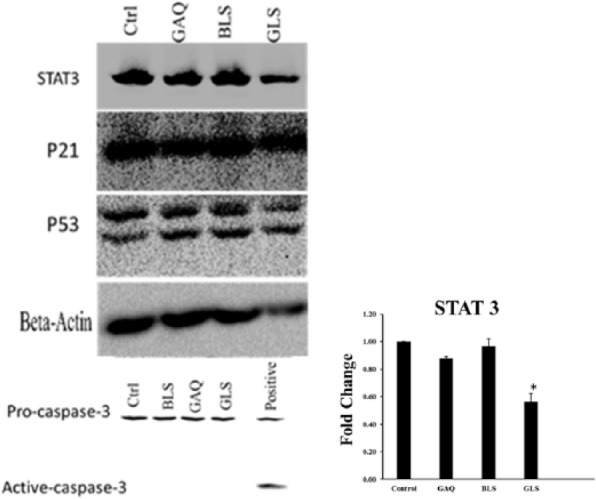
Effects of various treatments on STAT3, p21, p53, procaspase 3, and caspase 3 in NCI-H226 cells. Positive control for caspase 3 was obtained by treating cells with staurosporine (1 µM). Cells were subjected to various treatments for 24 hours, followed by washing with phosphate-buffered saline (PBS) and harvested with a sterile scraper in lysis buffer. Samples containing 50 µg of proteins were separated on 6% or 10% polyacrylamide gel electrophoresis and immunoblotted with respective antibodies. The intensities of bands were quantified using ImageJ software. Ctrl indicates PBS control; BLS, blank liposomes; GAQ, aqueous GSSG [1 mg/mL]; GLS, GSSG liposomes [1 mg/mL]) (*, P < 0.05).
Although caspase 3 was not detected, STAT3 was found to be downregulated in NCI-H226 cells (Figure 6). Similar results were observed in B16-F10 cells (data not shown). STAT3 is a member of STAT family of transcription factors, which plays a key role in cell apoptosis, proliferation, metastasis, angiogenesis, and immune escape.18-20 Downregulation of the protein is consistent with the observation of cell apoptosis and proliferation inhibition. Because apoptosis was observed in the absence of caspase 3, it remains to be explored whether GSSG liposomes caused a caspase 3–independent apoptosis.21,22 We also checked the levels of tumor suppressor protein p53 and its downstream protein p21.23 Levels of both proteins were unchanged in NCI-H226 cells (Figure 6). Levels of p21 were also found to be unchanged in B16-F10 cells (data not shown), whereas p53 was not detected in B16-F10 cells due to the no cross-reactivity of the antibody used (Figure 6). β-Actin in the figure was initially used as a loading control but found to be downregulated in cells treated with GSSG liposomes.3 Downregulation of β-actin was consistent with the observation that GSSG liposomes affected cell migration and invasion through affecting cell motility as discussed in a separate study.3
Determination of ROS
The ROS have been reported for cells treated with blank cationic liposomes.24 To check whether GSSG liposomes, which are cationic liposomes, might lead to more ROS production than BLS (cationic liposomes), ROS in cells treated with GSSG liposomes and BLS were determined. Consistent with the literature report, ROS level was found to be higher (P < .05) for cells treated with BLS when compared with the control where cells were treated with PBS (Figure 7). However, no difference was found for cells treated with BLS vs GSSG liposomes, suggesting that GSSG liposomes did not increase ROS production compared with BLS.
Figure 7.

ROS generation from cells treated with blank liposomes or GSSG liposomes. ROS was quantified using carboxy-H2DCFDA. Cells were treated with GSSG liposomes (1 mg/mL) or blank liposomes before staining with carboxy-H2DCFDA at 2 or 24 hours. The fluorescence intensity was measured at 492 nm (excitation) and 527 nm (emission) on a SpectraMax M2 fluorescence microplate reader. The data are presented as percentage of control. Carboxy-H2DCFDA indicates carboxy-2′,7′-dichlorodihydrofluorescin diacetate; GSSG, glutathione disulfide; ROS, reactive oxygen species (**, P < 0.01).
Determination of intracellular GSH
To check the impact of GSSG liposomes on intracellular GSH, the quantity of GSH in cells from various treatments was determined by high-performance liquid chromatography. It is noticed that the GSH concentration in NCI-H226 cells was much higher than that in B16-F10 cells (Table 1). This low level of GSH in B16-F10 cells might be the reason for this cell line to be more sensitive, when compared with NCI-H226 cells, to GSSG liposomes as determined by IC50 values (2072 ± 120 µg/mL and 594 ± 201 µg/mL for NCI-H226 and B16-F10, respectively). Interestingly, BLS significantly increased intracellular GSH in NCI-H226 cells, whereas GSSG liposomes significantly decreased intracellular GSH (Table 1). The decrease in GSH by GSSG liposomes probably contributed or partially contributed to the effect of GSSG liposomes on the inhibition of cell proliferation as it has been reported that GSH plays a significant role in cell proliferation.25,26
Table 1.
Intracellular GSH from cells treated with various treatments.
| Intracellular GSH (µg/µg protein) |
||
|---|---|---|
| NCI-H226 cells | B16-F10 cells | |
| Control 1 (PBS) | 1.48 ± 0.12 | 0.32 ± 0.011 |
| Aqueous GSSG (1 mg/mL) | 1.32 ± 0.06 (P = .1) | Not detected |
| Blank liposomes | 2.58 ± 0.04 (P < .001) | 0.145 ± 0.017 (P < .001) |
| GSSG liposomes (1 mg/mL) | 0.75 ± 0.060 (P < .001) | Not detected |
Abbreviations: GSH, glutathione; GSSG, glutathione disulfide; PBS, phosphate-buffered saline.
Cells were seeded in a 10-mL cell culture flask at a concentration of 2 × 10⁶ cells/flask. The cells were allowed to attach for 24 hours followed by various treatments for 24 hours. GSH was quantified by high-performance liquid chromatography as described in the method.
In vivo tumor growth inhibition effect
The in vivo effect of GSSG liposomes on tumor growth was investigated with a murine melanoma model using female C57BL/6 mice as reported by Wack and colleagues.9 The inoculated subcutaneous tumors reached a volume of 25 mm3 in about 7 days when the treatment started. As shown in Figure 8A, tumors grew rapidly in mice treated with PBS (control 1), BLS (control 2), or GAQ (control 3) and reached a volume of 2000 mm3 in about 5 days after the treatment started. No significant difference was observed for tumor growth rates with the 3 controls. Dacarbazine at 50 mg/kg (D50) was used as a positive control. Dacarbazine is one of the drugs used for the treatment of melanoma27 and was investigated for its effect on the growth of subcutaneously implanted melanoma by Wack and colleagues.9 Tumor growth was slowed significantly in mice in the positive control group (D50) compared with each of the 3 control groups after 5-day treatment (Student t test, P < .05). However, tumors grew even more slowly in mice treated with either GSSG liposomes by IV injection (GLS IV) or GSSG liposomes by IT injection (GLS IT) (Student t test, P < .01). After a 7-day treatment, tumor size was significantly smaller in mice of the GLS IT group compared with those in the GLS IV group (Student t test, P < .001). The GLS IV and GLS IT groups showed a tumor proliferation retardation rate of 85% ± 5.7% and 90% ± 3.9%, respectively, compared with the PBS control group on day 6, which was the termination date of the control group. Only 43% ± 17.4% proliferation retardation was observed for the dacarbazine positive control (D50) on day 6. A university pathologist conducted a pathological examination of liver, heart, kidney, brain, lung, intestine, and stomach at the end of the in vivo experiment. No sign of toxicity was observed for the organs examined (data not shown).
Figure 8.
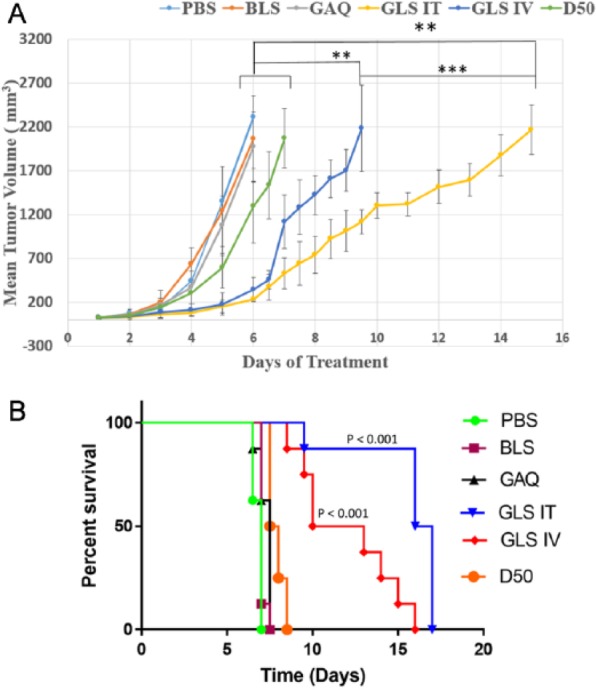
Effects on subcutaneous tumor growth by different treatments. C57BL/6 mice (4 mice/cage) were inoculated with B16-F10 cells (2 millions in 50 µL PBS) subcutaneously. Treatments started when subcutaneous tumors reached an average volume of 25 µL. Various treatments included control 1 (phosphate-buffered saline [PBS]), control 2 (BLS): blank liposomes, control 3 (GAQ): GSSG aqueous solution (0.48 g/kg), positive control (D50): dacarbazine (50 mg/kg), GSSG liposomes by IV injection (0.48 g/kg) (GLS IV), and GSSG liposomes by intratumoral injection (0.48 g/kg) (GLS IT). (A) Plots of tumor size vs experimental time (days) derived from different treatments. (B) Kaplan-Meier survival curves derived from different treatments. The survival rates of the GLS IV group and GLS IT group were significantly increased compared with the PBS group (P = .0001, .0001), BLS group (P < .0001, <.0001), GAQ group (P = .0002, .0002), and D50 group (P = .0002, <.0001). The GLS IT group also showed a significant increase in the survival rate than the GLS IV group (P = .0028); P value was calculated using the log-rank test.
Figure 8B shows the survival rates from different treatments. The median survival rates for control 1, control 2, control 3, D50, GLS IV, and GLS IT were 7, 7, 7.5, 7.75, 11.5, and 16.5 days, respectively. Statistical analysis showed that the survival rates of the GSSG liposome–treated group were significantly extended compared with all other treatment groups.
The body weight of mice was recorded, and no body weight difference was observed when comparing the GSSG liposome–treated groups with those in the controls (data not shown).
Our data demonstrate that GSSG liposomes caused cell apoptosis without affecting the cell cycle. The Western blot analysis suggested the involvement of the STAT3 signaling pathway for cell apoptosis and proliferation inhibition. Nevertheless, much work remains to be conducted to reveal the molecular targets of cancer proliferation retardation by GSSG liposomes. It is known that GSSG liposomes at 1 mg/mL can increase cellular GSSG by about ~27-fold and lead to a significant increase in protein S-glutathionylation in NCI-H226 cells.2 Protein S-glutathionylation is a reversible posttranslational protein modification process (Figure 9).28-32 It is likely that protein S-glutathionylation caused by GSSG liposomes may contribute to cancer proliferation retardation and apoptosis effects. It is also most likely that the proliferation retardation was achieved by glutathionylation of multiple targets.
Figure 9.
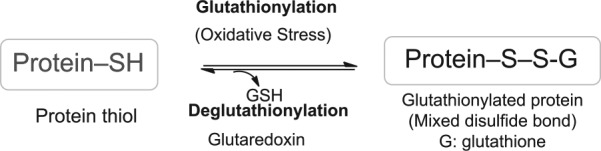
Protein S-glutathionylation and deglutathionylation. GSH indicates glutathione.
In summary, GSSG liposomes effectively induce cell apoptosis while exhibiting no effect on the cell cycle. The GSSG liposome treatment of female C57BL/6 mice implanted with B16-F10 cells significantly retarded tumor proliferation and increased survival rates. It is recognized that the effective dosages for both in vitro and in vivo proliferation retardation effects appear to be high. However, no sign of toxicities was observed in a preliminary toxicity study with 4 CD1 female mice at a dosage of 2.7-fold of the effective in vivo dosage for 5 days followed by a 2-day break for a total of 12 days before a pathological examination of liver, heart, kidney, brain, lung, intestine, and stomach was conducted (data not shown). We also determined the IC50 value of GSSG liposomes for CV-1, which is a normal male monkey kidney cell line. The IC50 was determined to be 1776 ± 4.6 µg/mL. In addition, in a separate study, GSSG liposomes were found to effectively prevent cancer cell detachment and migration, significantly inhibit invasion of 3 human cancer cell lines (NCI-H226, PC-3: prostate cancer, and HCT 116: colon cancer) and 1 murine melanoma cancer cell line (B16-F10), and exhibit significant antimetastatic effect in an experimental murine melanoma metastasis model.3 The effective cancer proliferation retardation and strong metastasis blocking effect warrant GSSG liposomes for further investigation as a therapeutic agent for cancer treatment.
Acknowledgments
The authors would like to thank Mary Carlson for proofreading the manuscript.
Footnotes
Peer review:Six peer reviewers contributed to the peer review report. Reviewers’ reports totaled 1568 words, excluding any confidential comments to the academic editor.
Funding:The author(s) disclosed receipt of the following financial support for the research, authorship, and/or publication of this article: This work was conducted with grants from the National Institutes of Health (1R15GM093678-01; 1R15GM107197-01A1) awarded to X.G.
Declaration of conflicting interests:The author(s) declared no potential conflicts of interest with respect to the research, authorship, and/or publication of this article.
Author Contributions: XG played the major role in the experiment design, data analysis, and manuscript preparation. SSS was involved in the experiment design, manuscript preparation and was the major participant in both in vitro and in vivo data collection and analysis. RKA, TS, JX, and HT were involved in the in vivo data collection. YY and HY were involved in part of the in vitro data collection. SW was involved in in vitro data collection and both in vitro and in vivo data analysis. RD and GJB were involved in the data collection of the Western blot analysis.
References
- 1. Meister A, Anderson ME. Glutathione. Annu Rev Biochem. 1983;52:711–760. [DOI] [PubMed] [Google Scholar]
- 2. Sadhu SS, Xie J, Zhang HW, Perumal O, Guan X. Glutathione disulfide liposomes—a research tool for the study of thiol oxidative stress. Biochem Biophys Rep. 2016;7:225–229. [DOI] [PMC free article] [PubMed] [Google Scholar]
- 3. Sadhu SS, Wang S, Averineni RK, et al. Anti-metastatic effect of glutathione disulfide liposomes. Cancer Grow and Metastas. 2017;10:1-11. [DOI] [PMC free article] [PubMed] [Google Scholar]
- 4. Haraguchi M. The role of the transcriptional regulator snail in cell detachment, reattachment and migration. Cell Adh Migr. 2009;3:259–263. [DOI] [PMC free article] [PubMed] [Google Scholar]
- 5. Eccles SA, Welch DR. Metastasis: recent discoveries and novel treatment strategies. Lancet. 2007;369:1742–1757. [DOI] [PMC free article] [PubMed] [Google Scholar]
- 6. Chen W, Seefeldt T, Young A, et al. Microtubule S-glutathionylation as a potential approach for antimitotic agents. BMC Cancer. 2012;12:245. [DOI] [PMC free article] [PubMed] [Google Scholar]
- 7. Dachineni R, Ai G, Kumar DR, Sadhu SS, Tummala H, Bhat GJ. Cyclin A2 and CDK2 as novel targets of aspirin and salicylic acid: a potential role in cancer prevention. Mol Cancer Res. 2016;14:241–252. [DOI] [PMC free article] [PubMed] [Google Scholar]
- 8. Chen W, Zhao Y, Seefeldt T, Guan X. Determination of thiols and disulfides via HPLC quantification of 5-thio-2-nitrobenzoic acid. J Pharm Biomed Anal. 2008;48:1375–1380. [DOI] [PMC free article] [PubMed] [Google Scholar]
- 9. Wack C, Becker JC, Brocker EB, Lutz WK, Fischer WH. Chemoimmunotherapy for melanoma with dacarbazine and 2,4-dinitrochlorobenzene: results from a murine tumour model. Melanoma Res. 2001;11:247–253. [DOI] [PubMed] [Google Scholar]
- 10. Huo L, Yao H, Wang X, Wong GW, Kung HF, Lin MC. Inhibition of melanoma growth by subcutaneous administration of hTERTC27 viral cocktail in C57BL/6 mice. PLoS ONE. 2010;5:e12705. [DOI] [PMC free article] [PubMed] [Google Scholar]
- 11. Pachynski RK, Scholz A, Monnier J, Butcher EC, Zabel BA. Evaluation of tumor-infiltrating leukocyte subsets in a subcutaneous tumor model [published online ahead of print April 13, 2015]. J Vis Exp. doi: 10.3791/52657. [DOI] [PMC free article] [PubMed] [Google Scholar]
- 12. Kato Y, Yoshino I, Egusa C, Maeda T, Pili R, Tsuboi R. Combination of HDAC inhibitor MS-275 and IL-2 increased anti-tumor effect in a melanoma model via activated cytotoxic T cells. J Dermatol Sci. 2014;75:140–147. [DOI] [PubMed] [Google Scholar]
- 13. Cui F, Ji J, Lv H, et al. Immune responsiveness in a mouse model of combined adoptive immunotherapy with NK and dendritic cells. J Cancer Res Ther. 2013;9:S162–S168. [DOI] [PubMed] [Google Scholar]
- 14. de Oliveira Ada S, Lima LG, Mariano-Oliveira A, et al. Inhibition of tissue factor by ixolaris reduces primary tumor growth and experimental metastasis in a murine model of melanoma. Thromb Res. 2012;130:e163–e170. [DOI] [PMC free article] [PubMed] [Google Scholar]
- 15. Collins TJ. ImageJ for microscopy. Biotechniques. 2007;43:25–30. [DOI] [PubMed] [Google Scholar]
- 16. Gavet O, Pines J. Progressive activation of CyclinB1-Cdk1 coordinates entry to mitosis. Dev Cell. 2010;18:533–543. [DOI] [PMC free article] [PubMed] [Google Scholar]
- 17. Huang Z, Pinto JT, Deng H, Richie JP., Jr Inhibition of caspase-3 activity and activation by protein glutathionylation. Biochem Pharmacol. 2008;75:2234–2244. [DOI] [PMC free article] [PubMed] [Google Scholar]
- 18. Santoni M, Conti A, Piva F, et al. Role of STAT3 pathway in genitourinary tumors. Future Sci OA. 2015;1:FSO15. [DOI] [PMC free article] [PubMed] [Google Scholar]
- 19. Momtaz S, Niaz K, Maqbool F, Abdollahi M, Rastrelli L, Nabavi SM. STAT3 targeting by polyphenols: novel therapeutic strategy for melanoma [published online ahead of print November 29, 2016]. Biofactors. doi: 10.1002/biof.1345. [DOI] [PubMed] [Google Scholar]
- 20. Guo W, Wu S, Wang L, et al. Antitumor activity of a novel oncrasin analogue is mediated by JNK activation and STAT3 inhibition. PLoS ONE. 2011;6:e28487. [DOI] [PMC free article] [PubMed] [Google Scholar]
- 21. Liang Y, Yan C, Schor NF. Apoptosis in the absence of caspase 3. Oncogene. 2001;20:6570–6578. [DOI] [PubMed] [Google Scholar]
- 22. Broker LE, Kruyt FA, Giaccone G. Cell death independent of caspases: a review. Clin Cancer Res. 2005;11:3155–3162. [DOI] [PubMed] [Google Scholar]
- 23. Macleod KF, Sherry N, Hannon G, et al. p53-dependent and independent expression of p21 during cell growth, differentiation, and DNA damage. Genes Dev. 1995;9:935–944. [DOI] [PubMed] [Google Scholar]
- 24. Yun CH, Bae CS, Ahn T. Cargo-free nanoparticles containing cationic lipids induce reactive oxygen species and cell death in HepG2 cells. Biol Pharm Bull. 2016;39:1338–1346. [DOI] [PubMed] [Google Scholar]
- 25. Diaz-Vivancos P, de Simone A, Kiddle G, Foyer CH. Glutathione—linking cell proliferation to oxidative stress. Free Radic Biol Med. 2015;89:1154–1164. [DOI] [PubMed] [Google Scholar]
- 26. Pallardo FV, Markovic J, Garcia JL, Vina J. Role of nuclear glutathione as a key regulator of cell proliferation. Mol Aspects Med. 2009;30:77–85. [DOI] [PubMed] [Google Scholar]
- 27. Chapman PB, Einhorn LH, Meyers ML, et al. Phase III multicenter randomized trial of the Dartmouth regimen versus dacarbazine in patients with metastatic melanoma. J Clin Oncol. 1999;17:2745–2751. [DOI] [PubMed] [Google Scholar]
- 28. Dalle-Donne I, Milzani A, Gagliano N, Colombo R, Giustarini D, Rossi R. Molecular mechanisms and potential clinical significance of S-glutathionylation. Antioxid. Redox Signal. 2008;10:445–473. [DOI] [PubMed] [Google Scholar]
- 29. Dalle-Donne I, Rossi R, Colombo G, Giustarini D, Milzani A. Protein S-glutathionylation: a regulatory device from bacteria to humans. Trends Biochem Sci. 2009;34:85–96. [DOI] [PubMed] [Google Scholar]
- 30. Dalle-Donne I, Rossi R, Giustarini D, Colombo R, Milzani A. S-glutathionylation in protein redox regulation. Free Radic Biol Med. 2007;43:883–898. [DOI] [PubMed] [Google Scholar]
- 31. Gallogly MM, Mieyal JJ. Mechanisms of reversible protein glutathionylation in redox signaling and oxidative stress. Curr Opin Pharmacol. 2007;7:381–391. [DOI] [PubMed] [Google Scholar]
- 32. Shelton MD, Chock PB, Mieyal JJ. Glutaredoxin: role in reversible protein S-glutathionylation and regulation of redox signal transduction and protein translocation. Antioxid Redox Signal. 2005;7:348–366. [DOI] [PubMed] [Google Scholar]