

Abstract
The hypothalamic suprachiasmatic nucleus (SCN), locus of the master circadian clock, bears many neuronal types. At the cellular-molecular level, the clock is comprised of feedback loops involving “clock” genes including Period1 and Period2, and their protein products, PERIOD1 and PERIOD2 (PER1/2). In the canonical model of circadian oscillation, the PER1/2 proteins oscillate together. While their rhythmic expression in the SCN as a whole has been described, the possibility of regional differences is unknown. To explore these clock proteins in distinct SCN regions, we assessed their expression through the rostro-caudal extent of the SCN in sagittal sections. We developed an automated method for tracking three fluorophores in digital images of sections triply labelled for PER1, PER2, and gastrin releasing peptide (used to locate the core). In the SCN as a whole, neurons expressing high levels of PER2 were concentrated in the rostral, rostrodorsal and caudal portions of the nucleus, and those expressing high levels of PER1 lay in a broad central area. Within these overall patterns, adjacent cells differed in expression levels of the two proteins. The results demonstrate spatially distinct localization of high PER1 vs. PER2 expression, raising the possibility that their distribution is functionally significant in encoding and communicating temporal information. The findings provoke the question of whether there are fundamental differences in PER1/2 levels among SCN neurons and/or whether topographical differences in protein expression are a product of SCN network organization rather than intrinsic differences among neurons.
Keywords: Suprachiasmatic nucleus, mouse, circadian rhythm, clock gene, PERIOD protein
Graphical Abstract
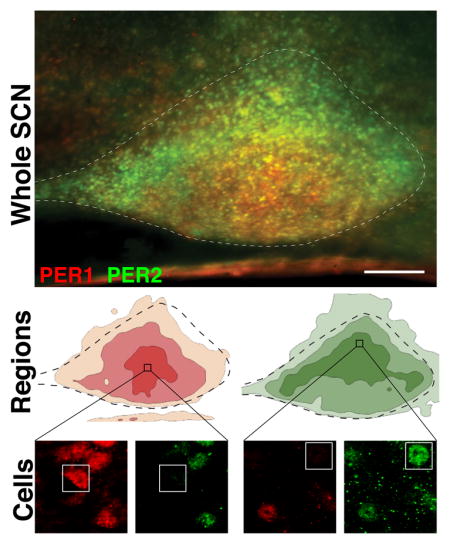
The photomicrograph shows a section of a triply labeled sagittal section through the entire rostro-caudal extent of the SCN, labelled for PER1 and PER2 protein at their times of peak expression. Automated analysis of the topography of protein expression is shown in contour diagrams highlighting broad regions with differential expression of PER1 and PER2. Individual cells expressing one but not the other PER protein were commonly seen within these broad regions.
Introduction
A broad spectrum of behavioral and physiological processes, from subcellular to organismic, have a daily rhythm of approximately 24 hours (Dunlap et al., 2009). These body-wide daily rhythms are coordinated by a brain clock located in the suprachiasmatic nuclei (SCN) of the hypothalamus (Antle & Silver, 2005; Welsh et al., 2010). SCN neurons, like cells in other tissues, define circadian time via a self-sustaining auto-regulatory feedback loop involving several clock genes and their protein products. Among these, the Period1 and Period2 (Per1/2) genes are activated by CLOCK-BMAL1 heterodimers acting at E-box enhancer sequences, and are subsequently suppressed by their own protein products, PERIOD1 and PERIOD2 (PER1/2) (Shearman et al., 2000; Koike et al., 2012; Buhr & Takahashi, 2013). Per1/2 genes and their protein products are important negative elements in the feedback loops that generate the endogenous SCN rhythm (Shearman et al., 1997; Sun et al., 1997; Tei et al., 1997). However, the organization of these molecular components into the individual cells that collectively constitute a “biological clock” controlling behavior and physiology remains to be fully elucidated. One possibility regarding SCN organization is that the molecular components of individual oscillators are identical. An alternative possibility is that the molecular elements of the clock, including PER1 and PER2 proteins, vary from cell to cell, due either to intrinsic differences within cells or to their intercellular connections associated with their location within the SCN network.
In depictions of the canonical cellular – molecular clock, PER1/2 are generally linked together (Takahashi, 2015). There is, however, evidence for both functional redundancy and for distinct roles of the period genes and their protein products in circadian timing and output (Kondratov et al., 2007). At a cellular level, both PER1 and PER2 proteins are transported into the nucleus as PER/CRY heterodimers, but there is evidence that their roles thereafter diverge. PER2 is thought to regulate clock gene expression at the transcriptional level, while it appears that mPER1 is not necessary for this role (Zheng et al., 2001). PER2 acts as a positive regulator of Bmal1 transcription (Shearman et al., 2000), whereas the absence of mPER1 does not alter Bmal1 expression (Zheng et al., 2001). Within the SCN, there is a differential response of Per1/2 genes and proteins in response to a light pulse (Albrecht et al., 1997; Yan & Silver, 2002; 2004). The function of PER proteins in activity rhythms is complex. Mice lacking either Per1 or Per2 (129/sv genetic background) have disrupted locomotor activity rhythms only after extended exposure to constant darkness (Bae et al., 2001), while double mutant animals are immediately arrhythmic. Furthermore, in these mPer2 mutant, but not mPER1-deficient mice, clock gene RNA rhythms in the SCN are blunted. In contrast, activity rhythms in Per1(−/−) mice on a different background (C57BL/6J background) are indistinguishable from control Per1(+/+) mice. In slices from these adult Per1(−/−) mice, real-time circadian gene promoter activity rhythms are reduced or absent, and some neurons in Per1(−/−) SCN explants exhibit robust circadian rhythms, while others have irregular and/or low-amplitude rhythms (Pendergast et al., 2009). These authors also report that in animals maintained in constant light, loss of Per2 alleles shortens circadian period loss while of Per1 alleles did not change SCN period (Pendergast et al., 2010; Ruan et al., 2012). In chimeric mice (C57BL/6 × 129/sv) in which Per1 had been inactivated by homologous recombination, the period of locomotor activity was about 1h shorter than in wild-type littermates (Cermakian et al., 2001). In a live tissue imaging study, loss of Per1 alleles lengthens SCN period, whereas loss of Per2 alleles shortens SCN period (Ruan et al., 2012). In contrast to controls in which both PER1 and PER2 are rhythmic, in Cry-deficient mice, PER1 immunoreactivity was similar in the nucleus of SCN neurons at both CT12 and CT0, at values of ~40% of those seen at the peak (CT 12) in wild-type animals. In contrast there were few PER2-immunoreactive cells in the SCN of Cry-deficient animals at either of these circadian times (Shearman et al. (2000), see Fig. 5). Though this literature points to the possibility of distinct roles for PER1/2, whether such differentiation of function occurs in the SCN has not been examined.
Figure 5. Contour maps.

Photomicrographs show PER1/2 (1st column) and GFP (2nd column) labelled cells in the SCN (delineated by a dashed line) at CT12. The visibility of GFP-labelled cells was enhanced using the invert colors tool (Photoshop). The contour maps (3rd and 4th columns) show signal intensity for each of the fluorophores (PER1, red; PER2, green). The shaded values given in the legend represent the absolute brightness threshold for each contour. To help visualize the spatial relationship between regions of high expression of each of the proteins, a solid black outline of the brightest PER1 contour (3rd column) is transposed onto the PER2 contour map for the same slice (4th column) and vice versa. For orientation, the white asterisk is placed at the location GFP cells. Mag bar = 100μm.
The purpose of the current study, therefore, was to extend our understanding of the functions of PER1/2 proteins by determining the localization of their expression within the SCN. In WT mice, PER1/2 protein abundance exhibits robust rhythms that peak in the early subjective night (Field et al., 2000; Mehta et al., 2015). We sought to determine whether at their peak both PER1/2 expression occurs in all SCN neurons and regions, and if not, whether expression of each of these proteins is locally clustered or dispersed within the SCN. Such information would add to the growing understanding of the spatial organization of the SCN and thereby contribute to the hypothesis that different molecular elements within gene families might serve distinct functions.
While the mouse SCN has been amply described in coronal sections, these prior studies generally focused on its caudal aspect, as this region contains both the core and shell (Abrahamson & Moore, 2001; Karatsoreos et al., 2004). Examination of its full rostro-caudal extent however, point to substantial rostral aspects of the SCN (Abrahamson & Moore, 2001) that have been little studied. Thus, in order to evaluate its topography, we prepared sagittal sections of the SCN, allowing efficient examination of the nucleus from its full rostro-caudal extent.
Materials and Methods
Animals and housing
Experimental animals were male C57BL/6 transgenic mice (N=35) in which enhanced green fluorescent protein (GFP) was inserted into a calbindin D28K/bacterial artificial chromosome by homologous recombination (gift from Dr. N. Heintz, Rockefeller University, New York). In these mice, GFP+ cells express gastrin-releasing peptide (GRP) and serve as a marker of the SCN core region: GRP cells lie in the dorsal aspect of the core, while VIP lie more ventrally (Abrahamson & Moore, 2001) with some cells co-expressing these peptides (Kawamoto et al., 2003). In a view of a sagittal section revealing the full rostro-caudal extent of the SCN, the localization of GRP cells to the other peptides of the core are more clearly sheen, with calretinin cells lying ventral-most, VIP cells overlying these, and GRP more dorsally (see fig. 2, Yan et al. (2007)). Mice were housed in translucent propylene cages and provided with food and water ad libitum. All experimental procedures were approved and conducted according to the Columbia University Institutional Animal Care and Use Committee.
Figure 2. Coronal and sagittal views of SCN core and shell.

Photomicrographs show the SCN at CT12, stained for AVP (left), PER2 (center) and merged PER2 + AVP (right) in sagittal (upper) and coronal (lower panels). The vertical line in the merged sagittal image shows the rostro-caudal location of the coronal section depicted in the lower panels. The vertical line in the merged coronal image shows the medio-lateral location of the sagittal section depicted in the upper panel. The dashed line delineates the borders of the SCN based on AVP staining. Note that PER2 expressing neurons extend beyond these borders. The arrows point to a region of reduced AVP staining. Mag bar = 100 μm
The animals were housed in a 12:12 hour light:dark schedule for at least two weeks, then placed in constant darkness (DD) for two days and sacrificed on the third day at circadian time (CT) 0 or 12. These time points were selected because SCN levels of PER1 and PER2 are lowest at ~CT0, and peak at ~CT12 (Field et al., 2000; Reppert & Weaver, 2001).
Antibodies
To determine PER1 and PER2 localization (N=23), the following antibodies were used: guinea pig anti-PER1 (GP91; 1:5000), rabbit anti-PER2 (R39; 1:5000) and chicken anti-GFP (1:10,000; Aves Labs, Tigard, OR). For delimitation of SCN boundaries (N=12), rabbit anti-PER2 (1:5000) and guinea pig anti-arginine vasopressin (AVP, 1:5000, Bachem, Torrance, CA), or rabbit anti-PER1 (R43, 1:5000) and guinea pig anti-AVP (1:5000) were used. GP91, R39 and R43 were a gift of Dr. D.R. Weaver, Dept. Neurobiol., U Mass Med Sch, Worcester, MA. Antibody specificity was documented in LeSauter et al. (2012). Additionally, to confirm that the results were not specific to the antibodies listed above, three experimental runs were performed using rabbit anti-PER1 1177 and guinea pig anti-PER2 GP88 (gift of Dr. Weaver) or guinea pig anti-PER1 GP91 and rabbit anti-PER2 AB2202 (1:500; EMD Millipore, MA), revealing the same staining patterns.
Perfusion and immunochemistry
Mice were anesthetized with ketamine (100 mg/kg) and xylazine (10mg/kg) (Schein, Florham Park, NJ), then perfused intracardially with 50 ml saline, followed by 100 ml of 4% paraformaldehyde in 0.1 M phosphate buffer (PB, pH 7.3). Brains were removed, postfixed for 24 h and cryoprotected in 20% sucrose in PB. Brains were sectioned in the sagittal or coronal plane at 50 μm in a cryostat (Microm HM 500M; Walldorf, Germany) at −20°C.
Serial sections were collected in individual wells in rostro-caudal or latero-medial sequence. They were washed 3 × 10 min. in PB + 0.1% Triton X-100, incubated 1h in 2% donkey serum in PB + 0.3 % Triton X-100. They were then incubated in the primary antibodies diluted in PB + 0.3% Triton X-100 for 48h.
Following primary incubation, sections were washed 3 × 10 min in PB + 0.1% Triton X-100, then incubated in secondary antibodies: Cy2 donkey anti-rabbit, Cy3 donkey anti-guinea pig and Cy5 donkey anti-chicken or Cy2 anti-guinea pig and Cy3 anti-rabbit and Cy5 donkey anti-chicken (Jackson Immunoresearch, West Grove, PA) diluted 1:200 with PB + 0.3% Triton X-100. After a final set of 10 min washes (3x) in PB, sections were mounted on gelatinized slides and dried overnight. Thereafter they were dehydrated in graded alcohols, treated with Citrisolv (Fisher Scientific, Pittsburgh, PA) for 10 min and coverslipped with Krystalon (EMD Chemicals, Gibbstown, NJ).
To ensure uniformity of immunostaining conditions, for each test run, animals at each CT were sacrificed and their brains processed in a single batch. Specifically, animals at CT12 and CT0 were run simultaneously (N=10 pairs) and 3 additional animals were run at CT12 for a total of 23 animals. To control for possible differences in brightness, each chromophore was used with each antibody as follows: PER1-Cy2 and PER2-Cy3 (N=7 pairs CT0, 12) and vice versa (N=3 pairs CT0,12). There were no differences detected the overall pattern of staining between these runs, and the results were combined in the data analysis. In addition, to delineate the SCN, double label protocols for PER2/AVP PER1/AVP were performed in sagittal (N=10) and coronal (N=2) sections. Control procedures using PER1 and PER2 primary antibodies alone, secondary antibodies alone, or mismatched primary and secondary antibodies produced no detectable immunostaining in the SCN.
Microscopy
Light microscopy
Photomicrographs of the SCN were captured with a Nikon Eclipse E800 microscope (Nikon, Tokyo, Japan) equipped with a cooled CCD camera (Retiga Exi; Q-Imaging, Surrey, Canada), using the excitation wavelengths 480±20nm for Cy2, 560±40nm for Cy3 and 640± 30nm for Cy5 with each channel acquired independently and then combined digitally with the Q-capture Pro software (Q-Imaging) and stored as TIFF files with a 1392 × 1040 pixel array. Images were imported into Mathematica 10 (Wolfram Research, Champaign, IL) for analysis. To create the plates of photomicrographs shown, images were imported into Adobe Photoshop (Adobe Systems, Inc., San Jose, CA). The Image-Adjustment-Levels tool in Photoshop was used applied to the entire image to reduce highlights and shadows in photomicrographs shown in Figs. 2 and 6A.
Figure 6. Expression levels in SCN sub-regions.

A. The photomicrograph shows PER1/2 expression in a representative sagittal section through the SCN at CT12. The white boxes indicate the areas measured in the confocal scans below (square: 50 μm per side).
B. The brightness of each region (labelled 1–4) was assessed as a ratio of PER2/PER1 for each channel in the confocal scan. The ratio of PER2/PER1 is high in the rostral and caudal areas and there is a lower ratio of expression of PER2/PER1 in the central and core areas. Tukey test: 1 vs. 2: p<0.001, 1 vs. 3: p<0.001, 1 vs. 4: p=0.029, 4 vs. 2: p=0.002, 4 vs. 3: p=0.003. The number of cells in each region was also assessed as the ratio of the number of PER2/PER1 cells, with similar results. Tukey test: 1 vs. 2: p=0.002, 1 vs. 3: p=0.002. The box plots show median, 1st and 3rd quartiles, maximum and minimum and individual data points. The arrowheads point to the identical highest and lowest data points using the brightness and cell count methods.
C. Confocal scans are shown through the SCN of each of the areas (labelled 1–4) depicted in 6A. This points to regional differences in PER1/2 expression in sections from 7 different animals (a–g). Animal ”e” did not express GFP; in this case the SCN section was chosen based on its location in the mediolateral axis and characteristic overall shape. z axis = 2.4 μm.
Confocal microscopy
The SCN (N=7 animals) in brain sections were observed under a Zeiss Axiovert 200 MOT fluorescence microscope (Carl Zeiss, Thornwood, NY, USA) with a Zeiss LSM 510 laser scanning confocal attachment and the image stacks were analyzed using LSM Image Browser (LSM 4.2.0.121, Zeiss). The sections were excited with an argon-krypton laser using the excitation wavelengths 488 nm for Cy2, 543 nm for Cy3 and 633nm for Cy5. The Cy5 images are displayed with blue pseudo-color. Confocal stacks from the rostral, central, core and caudal SCN were collected as 0.8 μm multi-tract optical sections with sequential excitation by each laser to avoid cross-talk between wavelengths. The power for each laser was kept constant throughout the study. The gain and offset of the camera were kept constant for all regions within each slice. The quantitative analyses of regional differences were always done within sections, and separately for each of the PER proteins.
Quantitative analysis of the immunofluorescent signal
Overview
Using Mathematica, we developed programs to assess the brightness of the fluorescent signal intensity in the triply-labelled immunostained tissue. These notebooks generated “histograms”, “maps”, and “cutoff profiles”. Histograms show the number of pixels at each of 256 brightness levels in each image normalized on a scale from 0 to 1. Maps show the location of pixels at each brightness level for each protein in a given slice. Cutoff profiles are used to set limits on the brightness range being studied in each image, a useful manipulation in distinguishing the SCN from the background and for determining areas of highest signal intensity. More detailed descriptions are given below. Our analytic program differs from others such as ImageJ (National Institutes of Health, Bethesda, MD) in that it permits merging of images from 3 different channels, allowing visualization of location of three different proteins with respect to each other. This permits determination of the location of cell-like elements containing PER1, PER2, and GRP in each SCN section. To evaluate the cell-like elements of the Mathematica generated maps we compared SCN neuron size in photomicrographs of light microscopic images to the size of cell-like elements in the maps. In photomicrographs with a magnification of 20 pixels/10 μm, the PER-ir neurons (N=20) measure 11.35 ± 0.42 pixels in diameter, or approximately 5.7 μm. On the Mathematica generated map at the same magnification, the same cell-like elements measure 11.30 ± 0.42 pixels or 5.65 μm diameter. Measurements done on PER-ir within AVP-positive cells give similar results (11.20 ± 0.32 pixels, or 5.6 μm diameter; N=20).
Analysis of 3 channels
In triply labelled sections, signal brightness information for a given SCN is captured in three separate image files (PER1, PER2, GFP) and is processed simultaneously as three, independently manipulable channels. The localization of PER1/2 staining was the experimental question, and the GFP signal was used to identify the SCN core. The integer values for pixel brightness in each channel are analyzed on a scale of 0 to 255. In the figures, the brightness values were divided by 255 to convert them to floating-point numbers between 0 and 1. We kept gamma = 1.0 throughout. The data from each section are represented in Mathematica as a 1040 × 1392 × 3 array of floating point numbers between 0 and 1, and are displayed in pseudocolor, viz. PER1 (red), PER2 (green) and GFP (blue). Brightness values are summed in bins of 0.05 brightness units (e.g. 0.10–0.15) and the total number of pixels is reported.
Histogram and maps
For analysis of a single fluorophore, done in one channel, the notebook generates a “map” of the SCN allowing visualization of pixel brightness throughout the full extent of the section. This image of the entire SCN section and the cell-like elements seen in the output of the program are virtually identical to the original photomicrograph. The program also generates a histogram depicting the number of pixels per brightness bin on a scale of 0 to 1. To permit differentiation between background and SCN staining as well as to characterize fluorescence signal intensity (a proxy for amplitude of protein expression), the program permits selecting the upper and lower limits of brightness to be evaluated for each channel.
Quantile and brightness cutoffs
While staining intensity is reflected in the brightness level of each pixel, the staining in the overall image can be assessed using either an “absolute threshold” or a “quantile” cutoff. Each of these is useful for answering specific questions. For the quantile analysis the cutoff levels are set to eliminate an experimenter-specified percentage of pixels with the lowest brightness. For example, a quantile cutoff of 0.2 indicates the elimination of the 20% dimmest pixels in a channel and reveals the brightest 80%, while a cutoff of 0.5 indicates the elimination of the 50% dimmest pixels in a channel, revealing the brightest 50%. This is especially useful in comparing staining intensity of two different fluorophores within a section, where we must take into account brightness differences between the fluorophores. This analysis can provide information on the location of the specified brightest signals for each protein within the SCN in a single slice.
The absolute threshold analysis provides the numbers of pixels out of the total analyzed, at or above an experimenter-determined brightness value. This is useful for comparison of a single fluorophore in different sections. Differences in localization of PER1/2 staining within small areas of the SCN within individual sections, were assessed by measuring the ratio of PER2 to PER1 (or vice versa) based on absolute brightness measured in confocal images of small subregions of the SCN.
Contour maps
We examined PER1/2 expression pattern over the SCN as a whole. This was done by generating contour maps, applying a Gaussian filter with a radius of 50 pixels, and drawing contour lines around regions with various specified brightness values, appropriate to each protein.
Statistical analysis: Statistics were performed using SigmaStat 2.03 (SPSS Inc., Chicago, IL). A one-way repeated measure ANOVA was used to determine the regional differences in the ratio of PER2/PER1. A two-way repeated measure ANOVA was used to determine regional differences in PER1 and PER2 colocalization. The main effects are reported in the results. For significant treatment effects, results of Tukey post-hoc test for pairwise comparisons, are given in the figure legends.
Results
Topography of SCN: medial to lateral in sagittal view
We first sought to define the topography of the SCN in the sagittal plane in order to localize the core and shell regions (Fig. 1). At the medial aspect of the SCN (1st column, 50–100 μm from midline), a narrow rostral extension occurs on each side beneath the third ventricle, forming the rostral tip of the nucleus. The SCN expands further medially and reaches its greatest mediolateral extent ca 200–250 μm from midline (3rd column). At this level, the core (delineated by GRP-containing neurons) and shell regions are clearly visible, and the substantial rostral extent of the SCN is seen, anterior to the core. At its lateral-most aspect (350 μm from midline, 4th column) the SCN is reduced in volume. As previously reported, the caudal-most aspect of the SCN is very small and circular, coming to an “egg-like point” (Abrahamson & Moore, 2001). For this reason, this aspect may be absent in some sagittal sections, depending on the precise angle at which the tissue was sectioned.
Figure 1. Medial to lateral topography of the SCN.

Photomicrographs show expression of PER1 (red), PER2 (green) and GFP (blue) from medial to lateral aspects through the SCN. The most medial and most lateral sections lack GFP (located within the core). The white asterisk marks the center of the GFP expressing area. The white dashed and dotted lines represent the outline of the SCN (drawn from merged image) and bottom of optic tract respectively. The rostral aspect of the SCN is at the left of each image. Mag bar = 100 μm
Delineation of SCN in the sagittal vs. coronal plane
In order to relate the sagittal view of the core and shell SCN to the more familiar coronal view we prepared material in both planes and stained for PER2 and PER1 (not shown) and AVP (Fig. 2). In many studies, the outer border of the SCN is delimited by AVP expressing cells (Abrahamson & Moore, 2001). In cresyl violet stained sections, the SCN extends approximately 600–650 μm in rostro-caudally, 350 μm along the dorsoventral axis and 300 μm mediolaterally from the third ventricle (Fig. 1,2; Abrahamson & Moore, 2001). Our results show that in the sagittal view, AVP-positive (AVP+) cells circumscribe the SCN, except for a distinct gap at the dorsal aspect (Fig. 2 upper panels). Also, PER1/2 expression extends beyond the AVP delimited boundary of the nucleus along most of its rostro-caudal extent, an area that may correspond to the peri-SCN, a question beyond the focus of the present work. For orientation to a more familiar view of the SCN, the location of the AVP-poor, PER2-rich area is also shown in coronal sections (Fig. 2, lower panels).
Automated characterization of PER1 and PER2 topography
We next sought to compare, using automated methodologies, the distribution of neurons expressing high levels of PER1 vs. PER2, focusing on the SCN at its greatest extent, including the area containing the core. The results of our method are shown first in a single channel analysis. Photomicrographs of representative sagittal sections through the mid-SCN (at CT12 and 0), and the corresponding histograms of brightness distributions are shown in Fig. 3. The brightness distribution of the entire image, containing the SCN and extra-SCN regions, and after removal of the extra-SCN parts of the image are shown in Figure 3A and B respectively. For this, the removal of the extra-SCN areas was done using the paintbrush tool, by setting the color to black (Hex color = #000000) using Adobe Photoshop (Adobe Systems, Inc., San Jose, CA). Comparison of the left and right histograms indicates that here, removal of brightness values below 0.20 eliminates fluorescence in extra-SCN material. Furthermore, the SCN is distinctly delineated when these low intensity pixels are removed. Restated, the “map” and distribution of pixel brightness seen within the SCN reflects PER expression above the background values observed in extra-SCN areas of the image.
Figure 3. Method for automated assessment of immunofluorescence intensity.

A. Photomicrographs show a sagittal section through the SCN at CT12 and CT0, stained for PER2. The entire section is shown in the left panels, while the extra-SCN portions of the image were removed in the panel on the right. The asterisk indicates removal of dirt. Mag bar = 100 μm.
B. Histogram of pixel brightness based on immunocytochemical fluorescence of each of the images shown in A. The brightness window extends from 0.0–1.0. This relative brightness scale is the 8-bit brightness range of the detector/255. Histogram bin width is 0.05 brightness units. The number of pixels above an absolute threshold can be calculated by adding together the bins at and above the given threshold.
C. The cumulative probability function of pixel brightness for each image in A. The horizontal line at quantile value of 0.5 shows that there is marked differences in bright pixel values at CT12 vs. CT0 whether the whole image or the SCN alone tissue is assessed.
To further test the method, we compared fluorescence intensity at CT0 vs. CT12, the histogram of brightness distribution plots the number of pixels at the brightest values at each specified cutoff (Fig. 3B). The results show that most of the brightest pixels are seen at CT12 while few are detected at CT0 in this section. This difference between CT12 and CT0 was seen in each experimental run confirming the effectiveness of the method. The cumulative distribution of brightness values of the pixels in slices at CT0 vs. CT12 is shown in Fig. 3C. Here it can be seen that most of the pixels at CT0 fall at below brightness value of 0.5, while few are seen at this low value at CT12.
Localization of high amplitude PER1/2 expression
High amplitude of oscillation in the SCN is key to its optimal function as a circadian clock (Welsh et al., 2010). To localize the highest abundance of PER1 vs. PER2 expressing neurons through the core and shell region, we used the automated program at various cutoffs to analyze sections at CT12. Brightness cutoffs were performed to reveal the top 100, 75, 50, 25 and 5% of pixels reflecting either PER1 or PER2 within each slice (Fig. 4). The method successfully distinguishes the SCN from extra-SCN tissue. Key to the question of localization of the greatest abundance of PER1 and PER2, the results also indicate that PER2 (green) is expressed at higher levels in the rostral areas while PER1 (red) is localized in a broad central area, with some areas of overlap (yellow). This pattern is observed in the photomicrographs and at all quantiles at which a signal is detected.
Figure 4. Localization of pixels at various brightness values.

The location of PER1 (red) and PER2 (green) cell-like profiles are shown through the mid-SCN in a sagittal SCN section. In these images, brightness cutoffs show the localization of all (100%) and the top 75, 50 25 and 5% of pixels.
Contour maps
In order to better visualize the overall brightness levels of pixels in various regions of the SCN compared to extra-SCN brain tissue, we created contour maps. The results enable visualization of the broad overall SCN regions where PER1 and PER2 are most highly expressed differentially. The results confirm that high expression of these two proteins do not necessarily overlap within a section. The contours also confirm that the signal originating in the SCN is readily distinguished from that of non-SCN tissue. The figure also marks the GFP cells. While these cells delineate only a small portion of the overall core region within this section, a small part of this area overlaps with the area of high PER1 expression.
Quantification of regional differences in rostral, central, core, and caudal SCN
To assess spatial differences in PER1/2 expression of various distinct regions of a slice at the level of individual cells, we performed confocal microscopy (Fig. 6). To this end, distinct areas of the SCN lying in the rostral, central, core and caudal SCN regions were evaluated, at the largest extent of the SCN. These scanned areas are delineated in the boxes outlined in white and labelled #1–4. For each region, in each section, we assessed the ratio of PER2 pixels above an absolute brightness threshold of 0.5 to the number of PER1 pixels above the same threshold (Fig. 6B left panel). If there were equal expression of PER1 and PER2 we would expect the ratio to be around 1 for every region. Instead we see that the rostral and caudal regions have values above 1, and the center and core regions values below 1 indicating that within a section, the rostral and caudal regions have relatively more PER2 expression, while the center and core regions have relatively higher PER1 expression (F(3,27) = 26.1, p<0.001). The ratio of PER2/PER1 cells in each region (Fig. 6B right panel) was also evaluated, based on cell counts by 2 independent observers, with similar results (F(3,27) = 9.264, p<0.001).
Finally, we assessed regional differences of PER1/2 expression in medial and lateral regions of the SCN. The ratio of PER2/PER1 brightness for sections medial and lateral to the core indicate the same general pattern with more PER2 rostrally and caudally and with PER1 widely distributed in a central area. See details in Supplementary Materials (Fig. S1).
Colocalization of PER1/2 and of GFP/PER: The colocalization of PER1 with PER2 was assessed by calculating the % of PER1 cells that also expressed PER2 for regions 1–4 (left) and the % of PER2 cells that express PER1 (right). There were significant differences in regional co-expression of PER proteins (F(3,55) = 45.370, p<0.001). Within regions 1 and 4, PER1 had significantly higher co-expression with PER2 than PER2 with PER1. For PER2 neurons, regions 2 and 3 co-expresses PER1 significantly more than region 1 (Fig. 7).
Figure 7. Colocalizaton of PER1 and PER2.

The % of PER1 neurons expressing PER2 (left panel) and % of PER2 neurons expressing PER1 (right panel) is shown for regions 1–4. There were significantly more PER1 neurons expressing PER2 in regions 1 and 4 than PER2 neurons expressing PER1. Tukey test: PER1 vs. PER2 within 1: p<0.001, PER1 vs. PER2 within 4: p=0.004. For PER2, region 1 had significantly fewer colocalized cells compared to regions 2 and 3. Tukey test: 3 vs. 1: p=0.004, 2 vs. 1: p=0.01.
PER expression in the core tends to be less dense than in the shell for each PER protein (Fig. 2), though the core portion of the SCN has cells of small size and high packing density compared to the shell where neurons are larger and have lower packing density (Abrahamson & Moore, 2001). We asked whether these GFP+ cells express the PER1/2 proteins. Of 127 GFP+ cells examined, 7.8% (10 cells) colocalized PER1 and 0.8% (1 cell) colocalized PER2, indicating that GFP-containing cells are not among those having high PER1/2 at CT12, when expression in the SCN as a whole peaks (Fig. 8).
Figure 8.

The photomicrograph shows a confocal scan through a triply labelled SCN at CT12 (region #3 in Fig 6). The arrowheads point to a GFP cell lacking PER1/2 (row 1), GFP cell bearing PER1 (row 2), GFP cell bearing PER2 (row 3), PER2 cell lacking GFP and PER1 (row 4). The asterisks mark neurons that colocalized PER1 and PER2. Mag bar = 5 μm, z axis = 0.8 μm.
Discussion
Contribution of the present results to understanding SCN organization
The present study introduces a new analytic tool and points to differential expression of high abundance of PER1 and PER2 proteins in individual SCN cells so as to delineate their distinct spatial localization within the SCN. Specifically, using automated detection of multiple fluorescent signals in individual pixels enabled observation of the relative localization of cell-like elements expressing high PER1 or PER2 through the rostro-caudal extent of the nucleus. Our results point to spatial segregation of the two proteins, with greatest abundance of PER1 represented in a diffuse area in the central SCN, and high expression of PER2 more concentrated in the rostral, dorsal and caudal aspects. These results are consistent with a previous study that used two mouse transgenic clock reporters, mPeriod1-Venus and mPeriod2-DsRED to monitor protein levels in individual cells over time, pointing to discrete cellular clocks expressing Per1 and Per2 genes (Cheng et al., 2009). The present work adds the spatial domain to the understanding of differential localization of functionally distinct molecular clocks and highlights the importance of SCN topography to the dynamic network organization of the brain’s clock. It also raises the interesting possibility that SCN information encoding and regional variation in encoding oscillation is influenced by cellular clocks that differentially mobilize PER1 and PER2.
PER1/2 expression was relatively low in the core area, though it had previously been described as being the locus of the densest population of SCN cells (Abrahamson & Moore, 2001). This is consistent with a previous observation that at CT12, Per1 mRNA, PER1, and PER2 proteins are absent or not detectable in a small subpopulation of SCN cells located in the core region of the nucleus (LeSauter et al., 2003). More importantly, the findings are also consistent with work in which PER2::VENUS, a high-fidelity real-time reporter of the behavior of PER2, the protein was detected in <10% of GRP cells at CT12 (Smyllie et al., 2016).
Distinct localization of PER1/2
The finding of spatial segregation of cells bearing PER1 vs. PER2 proteins is functionally significant in the context of SCN oscillation. The SCN is an anatomically heterogeneous population of cells, in which clusters of differentially phased regions oscillate in a topographically specific manner. Neurons in the dorsomedial SCN (in coronal sections) reach their daily peak in clock gene expression earlier in the day than those in other compartments of the nucleus (Yan & Okamura, 2002; Hamada et al., 2004; Foley et al., 2011; Pauls et al., 2014). CK1 is a critical regulator of PER mobility and circadian period (Vielhaber et al., 2000; Akashi et al., 2002; Takano et al., 2004). Separable function of the PER1/2 proteins is suggested in evidence from SCN slices in vitro: CK1εTau accelerated molecular pacemaking in SCN tissue taken from mutant animals lacking either PER1 or PER2 protein, but significantly, there was a greater pacemaker effect in PER2-bearing (i.e., Per1-null slices) SCN than in PER-1 bearing slices (Maywood et al., 2014). Phase and period differences between dorsal and ventral SCN (in coronal sections) have also been reported to encode seasonal time, though here a relationship to PER proteins has not been examined (Myung et al., 2015). In summary, it appears that dorsal SCN pacemakers are faster and tend to have high PER2 expression. The principle that individual cells can differentially engage one or another of the PER proteins has been established in non-SCN tissue. In a study of rhythmic amplitude and period of real-time bioluminescence rhythms in explants of retina from Per1-, Per2-, deficient mice that carried either PERIOD2::LUCIFERASE or Period1::luciferase circadian reporters, Per1 deficient retinal and SCN explants had altered rhythms, with greater effects in the retina than in the SCN, while Per2 was not required for sustained rhythms. Reduction in the number of Per1 alleles shortened the circadian period in the retina, but lengthened it in the SCN. This evidence points to a differential degree of dependence on Per1 and Per2 in the retina at the tissue level, and suggests multiple avenues of regulation of clock genes and period (Ruan et al., 2012).
Possible Caveats
A limitation of the present work is that fluorescence intensity is used as a proxy for PER abundance even though the precise relationship between them has not been established. Support for the reliability of our method is confirmed in several ways. Our cell counts produce the same general results as the measures of fluorescence intensity. Monitoring of optical density rests on a long history of immunochemistry studies using fluorescence or chromogenic staining intensity as a proxy for the protein of interest. In a comparison of relative optical density and cell counting for the analysis of FOS protein abundance Rieux and collaborators (Rieux et al., 2002) reported that optical density analysis provides the better objective measure and a reasonably accurate determination of the relative amount of FOS protein. Finally, another indication that imaged intensity is representative of physiological rhythmicity is shown in a study combining live cell imaging and patch-clamp electrophysiology where a positive, linear correlation was reported between imaged Per1 transcript abundance measured by fluorescence and neuronal spike frequency (Quintero et al., 2003).
One might question whether the difference in expression of PER1 vs. PER2 protein reported here might be attributable to differences in the time course of protein abundance. It is true that the peaks of mPer1- and mPer2-dependent transcripts within the SCN are offset by several hours (Albrecht et al., 1997; Sun et al., 1997). However, analysis of PER protein abundance at 2 hour intervals indicates that both PER1 and PER2 peak at CT12 under free-running conditions (used in our study), and both are elevated from about CT10–14 (Field et al. (2000), see Fig. 1). A similar pattern, with slightly longer elevation of both proteins occurs in entrained conditions. This evidence indicates that in the SCN as a whole, the peak in expression coincides for both proteins, a time point where one might expect that asynchronous expression might be minimal. Finally differences in Period gene expression at the cellular level have previously been reported in a study that examined changes in the expression levels of both mPer1- and mPer2-regulated transgenes using real time imaging of live SCN slices over a small region of the nucleus (Cheng et al., 2009). Thus, it seems unlikely that the differences in PER1/2 localization observed in our study are strictly a consequence of asynchronous peak expression.
An omission in the present work is that the results are based on only two sampling times. It is possible that the pattern of PER1 vs. PER2 expression in various regions or cells of the SCN network change over circadian time. Definitive evidence of synchronicity of expression in various SCN regions, and within specific SCN neurons, awaits development of tools for a time series study of the SCN as a whole, and individual cells, in a preparation where both proteins can be monitored continuously and simultaneously. Finally, the focus in this work is on neurons and cell-like elements bearing high immunoreactivity or fluorescence. It is possible that colocalization of PER1 and PER2 occurs preferentially in cells at lower than peak levels, perhaps due to competition of PER proteins for expression or stabilization such that peak levels are only seen in only one of the proteins. The present method does not quantify protein directly, and cannot distinguish between no and low protein abundance, and is thus not suitable to making conclusions based on low protein abundance.
Implications of the present findings: The present findings draw attention to the heterogeneity of the mouse SCN. Although the results do not reveal the mechanisms mediating regional differences in PER1/2 expression, they direct attention to future work about these proteins in the SCN network. The function of differential localization of PER1/2 in subregions of the SCN is not known. We do however have evidence that temporal encoding of seasons entails differences in phase of oscillators lying in the rostral vs. caudal aspects of the SCN (reviewed in Coomans et al. (2015)). Also, given their different responses to light (Albrecht et al., 1997), one might speculate that the PER1/2 proteins could encode memory for daylength and perhaps contribute to differentiating between the equal duration daylengths of fall and spring, important for reproduction. While the demonstration of spatially organized arrangements of cells expressing PER1 and PER2 has been demonstrated in this work, we need further information about dynamic and anatomical aspects of a large fraction of the SCN volume that lies in the rostral aspect to begin to understand the function of such specialization.
Supplementary Material
Acknowledgments
Supported by NSF grant 125605 and NINDS grant NS-37917 to R.S. We thank Dr. Paul Witkovsky for comments on an earlier draft of this manuscript.
Footnotes
The addresses from which the work originated: Rae Silver, Neuroscience Program and Psychology Department, Barnard College, 3009 Broadway, New York, NY 10027, Dept. Psychology, Columbia University, Mail Code 5501, 1190 Amsterdam Avenue, 406 Schermerhorn Hall, New York, NY, 10027.
References
- Abrahamson EE, Moore RY. Suprachiasmatic nucleus in the mouse: retinal innervation, intrinsic organization and efferent projections. Brain Res. 2001;916:172–191. doi: 10.1016/s0006-8993(01)02890-6. [DOI] [PubMed] [Google Scholar]
- Akashi M, Tsuchiya Y, Yoshino T, Nishida E. Control of intracellular dynamics of mammalian period proteins by casein kinase I epsilon (CKIepsilon) and CKIdelta in cultured cells. Mol Cell Biol. 2002;22:1693–1703. doi: 10.1128/MCB.22.6.1693-1703.2002. [DOI] [PMC free article] [PubMed] [Google Scholar]
- Albrecht U, Sun ZS, Eichele G, Lee CC. A differential response of two putative mammalian circadian regulators, mper1 and mper2, to light. Cell. 1997;91:1055–1064. doi: 10.1016/s0092-8674(00)80495-x. [DOI] [PubMed] [Google Scholar]
- Antle MC, Silver R. Orchestrating time: arrangements of the brain circadian clock. Trends Neurosci. 2005;28:145–151. doi: 10.1016/j.tins.2005.01.003. [DOI] [PubMed] [Google Scholar]
- Bae K, Jin X, Maywood ES, Hastings MH, Reppert SM, Weaver DR. Differential functions of mPer1, mPer2, and mPer3 in the SCN circadian clock. Neuron. 2001;30:525–536. doi: 10.1016/s0896-6273(01)00302-6. [DOI] [PubMed] [Google Scholar]
- Buhr ED, Takahashi JS. Molecular components of the Mammalian circadian clock. Handb Exp Pharmacol. 2013:3–27. doi: 10.1007/978-3-642-25950-0_1. [DOI] [PMC free article] [PubMed] [Google Scholar]
- Cermakian N, Monaco L, Pando MP, Dierich A, Sassone-Corsi P. Altered behavioral rhythms and clock gene expression in mice with a targeted mutation in the Period1 gene. EMBO J. 2001;20:3967–3974. doi: 10.1093/emboj/20.15.3967. [DOI] [PMC free article] [PubMed] [Google Scholar]
- Cheng HY, Alvarez-Saavedra M, Dziema H, Choi YS, Li A, Obrietan K. Segregation of expression of mPeriod gene homologs in neurons and glia: possible divergent roles of mPeriod1 and mPeriod2 in the brain. Hum Mol Genet. 2009;18:3110–3124. doi: 10.1093/hmg/ddp252. [DOI] [PMC free article] [PubMed] [Google Scholar]
- Coomans CP, Ramkisoensing A, Meijer JH. The suprachiasmatic nuclei as a seasonal clock. Front Neuroendocrinol. 2015;37:29–42. doi: 10.1016/j.yfrne.2014.11.002. [DOI] [PubMed] [Google Scholar]
- Dunlap J, Loros J, DeCoursey P. Chronobiology: Biological Timekeeping. Sinauer Associates; 2009. [Google Scholar]
- Field MD, Maywood ES, O’Brien JA, Weaver DR, Reppert SM, Hastings MH. Analysis of clock proteins in mouse SCN demonstrates phylogenetic divergence of the circadian clockwork and resetting mechanisms. Neuron. 2000;25:437–447. doi: 10.1016/s0896-6273(00)80906-x. [DOI] [PubMed] [Google Scholar]
- Foley NC, Tong TY, Foley D, Lesauter J, Welsh DK, Silver R. Characterization of orderly spatiotemporal patterns of clock gene activation in mammalian suprachiasmatic nucleus. Eur J Neurosci. 2011;33:1851–1865. doi: 10.1111/j.1460-9568.2011.07682.x. [DOI] [PMC free article] [PubMed] [Google Scholar]
- Hamada T, Antle MC, Silver R. Temporal and spatial expression patterns of canonical clock genes and clock-controlled genes in the suprachiasmatic nucleus. Eur J Neurosci. 2004;19:1741–1748. doi: 10.1111/j.1460-9568.2004.03275.x. [DOI] [PMC free article] [PubMed] [Google Scholar]
- Karatsoreos IN, Yan L, LeSauter J, Silver R. Phenotype matters: identification of light-responsive cells in the mouse suprachiasmatic nucleus. J Neurosci. 2004;24:68–75. doi: 10.1523/JNEUROSCI.1666-03.2004. [DOI] [PMC free article] [PubMed] [Google Scholar]
- Kawamoto K, Nagano M, Kanda F, Chihara K, Shigeyoshi Y, Okamura H. Two types of VIP neuronal components in rat suprachiasmatic nucleus. J Neurosci Res. 2003;74:852–857. doi: 10.1002/jnr.10751. [DOI] [PubMed] [Google Scholar]
- Koike N, Yoo SH, Huang HC, Kumar V, Lee C, Kim TK, Takahashi JS. Transcriptional architecture and chromatin landscape of the core circadian clock in mammals. Science. 2012;338:349–354. doi: 10.1126/science.1226339. [DOI] [PMC free article] [PubMed] [Google Scholar]
- Kondratov RV, Gorbacheva VY, Antoch MP. The role of mammalian circadian proteins in normal physiology and genotoxic stress responses. Curr Top Dev Biol. 2007;78:173–216. doi: 10.1016/S0070-2153(06)78005-X. [DOI] [PubMed] [Google Scholar]
- LeSauter J, Lambert CM, Robotham MR, Model Z, Silver R, Weaver DR. Antibodies for assessing circadian clock proteins in the rodent suprachiasmatic nucleus. PLoS One. 2012;7:e35938. doi: 10.1371/journal.pone.0035938. [DOI] [PMC free article] [PubMed] [Google Scholar]
- LeSauter J, Yan L, Vishnubhotla B, Quintero JE, Kuhlman SJ, McMahon DG, Silver R. A short half-life GFP mouse model for analysis of suprachiasmatic nucleus organization. Brain Res. 2003;964:279–287. doi: 10.1016/s0006-8993(02)04084-2. [DOI] [PMC free article] [PubMed] [Google Scholar]
- Maywood ES, Chesham JE, Smyllie NJ, Hastings MH. The Tau mutation of casein kinase 1epsilon sets the period of the mammalian pacemaker via regulation of Period1 or Period2 clock proteins. J Biol Rhythms. 2014;29:110–118. doi: 10.1177/0748730414520663. [DOI] [PMC free article] [PubMed] [Google Scholar]
- Mehta N, Cheng AH, Chiang CK, Mendoza-Viveros L, Ling HH, Patel A, Xu B, Figeys D, Cheng HY. GRK2 Fine-Tunes Circadian Clock Speed and Entrainment via Transcriptional and Post-translational Control of PERIOD Proteins. Cell Rep. 2015;12:1272–1288. doi: 10.1016/j.celrep.2015.07.037. [DOI] [PubMed] [Google Scholar]
- Myung J, Hong S, DeWoskin D, De Schutter E, Forger DB, Takumi T. GABA-mediated repulsive coupling between circadian clock neurons in the SCN encodes seasonal time. Proc Natl Acad Sci U S A. 2015;112:E3920–3929. doi: 10.1073/pnas.1421200112. [DOI] [PMC free article] [PubMed] [Google Scholar]
- Pauls S, Foley NC, Foley DK, LeSauter J, Hastings MH, Maywood ES, Silver R. Differential contributions of intra-cellular and inter-cellular mechanisms to the spatial and temporal architecture of the suprachiasmatic nucleus circadian circuitry in wild-type, cryptochrome-null and vasoactive intestinal peptide receptor 2-null mutant mice. Eur J Neurosci. 2014;40:2528–2540. doi: 10.1111/ejn.12631. [DOI] [PMC free article] [PubMed] [Google Scholar]
- Pendergast JS, Friday RC, Yamazaki S. Endogenous rhythms in Period1 mutant suprachiasmatic nuclei in vitro do not represent circadian behavior. J Neurosci. 2009;29:14681–14686. doi: 10.1523/JNEUROSCI.3261-09.2009. [DOI] [PMC free article] [PubMed] [Google Scholar]
- Pendergast JS, Friday RC, Yamazaki S. Distinct functions of Period2 and Period3 in the mouse circadian system revealed by in vitro analysis. PLoS One. 2010;5:e8552. doi: 10.1371/journal.pone.0008552. [DOI] [PMC free article] [PubMed] [Google Scholar]
- Quintero JE, Kuhlman SJ, McMahon DG. The biological clock nucleus: a multiphasic oscillator network regulated by light. J Neurosci. 2003;23:8070–8076. doi: 10.1523/JNEUROSCI.23-22-08070.2003. [DOI] [PMC free article] [PubMed] [Google Scholar]
- Reppert SM, Weaver DR. Molecular analysis of mammalian circadian rhythms. Annu Rev Physiol. 2001;63:647–676. doi: 10.1146/annurev.physiol.63.1.647. [DOI] [PubMed] [Google Scholar]
- Rieux C, Carney R, Lupi D, Dkhissi-Benyahya O, Jansen K, Chounlamountri N, Foster RG, Cooper HM. Analysis of immunohistochemical label of Fos protein in the suprachiasmatic nucleus: comparison of different methods of quantification. J Biol Rhythms. 2002;17:121–136. doi: 10.1177/074873002129002410. [DOI] [PubMed] [Google Scholar]
- Ruan GX, Gamble KL, Risner ML, Young LA, McMahon DG. Divergent roles of clock genes in retinal and suprachiasmatic nucleus circadian oscillators. PLoS One. 2012;7:e38985. doi: 10.1371/journal.pone.0038985. [DOI] [PMC free article] [PubMed] [Google Scholar]
- Shearman LP, Sriram S, Weaver DR, Maywood ES, Chaves I, Zheng B, Kume K, Lee CC, van der Horst GT, Hastings MH, Reppert SM. Interacting molecular loops in the mammalian circadian clock. Science. 2000;288:1013–1019. doi: 10.1126/science.288.5468.1013. [DOI] [PubMed] [Google Scholar]
- Shearman LP, Zylka MJ, Weaver DR, Kolakowski LF, Jr, Reppert SM. Two period homologs: circadian expression and photic regulation in the suprachiasmatic nuclei. Neuron. 1997;19:1261–1269. doi: 10.1016/s0896-6273(00)80417-1. [DOI] [PubMed] [Google Scholar]
- Smyllie NJ, Pilorz V, Boyd J, Meng QJ, Saer B, Chesham JE, Maywood ES, Krogager TP, Spiller DG, Boot-Handford R, White MR, Hastings MH, Loudon AS. Visualizing and Quantifying Intracellular Behavior and Abundance of the Core Circadian Clock Protein PERIOD2. Curr Biol. 2016 doi: 10.1016/j.cub.2016.05.018. [DOI] [PMC free article] [PubMed] [Google Scholar]
- Sun ZS, Albrecht U, Zhuchenko O, Bailey J, Eichele G, Lee CC. RIGUI, a putative mammalian ortholog of the Drosophila period gene. Cell. 1997;90:1003–1011. doi: 10.1016/s0092-8674(00)80366-9. [DOI] [PubMed] [Google Scholar]
- Takahashi JS. Molecular components of the circadian clock in mammals. Diabetes Obes Metab. 2015;17(Suppl 1):6–11. doi: 10.1111/dom.12514. [DOI] [PMC free article] [PubMed] [Google Scholar]
- Takano A, Isojima Y, Nagai K. Identification of mPer1 phosphorylation sites responsible for the nuclear entry. J Biol Chem. 2004;279:32578–32585. doi: 10.1074/jbc.M403433200. [DOI] [PubMed] [Google Scholar]
- Tei H, Okamura H, Shigeyoshi Y, Fukuhara C, Ozawa R, Hirose M, Sakaki Y. Circadian oscillation of a mammalian homologue of the Drosophila period gene. Nature. 1997;389:512–516. doi: 10.1038/39086. [DOI] [PubMed] [Google Scholar]
- Vielhaber E, Eide E, Rivers A, Gao ZH, Virshup DM. Nuclear entry of the circadian regulator mPER1 is controlled by mammalian casein kinase I epsilon. Mol Cell Biol. 2000;20:4888–4899. doi: 10.1128/mcb.20.13.4888-4899.2000. [DOI] [PMC free article] [PubMed] [Google Scholar]
- Welsh DK, Takahashi JS, Kay SA. Suprachiasmatic nucleus: cell autonomy and network properties. Annu Rev Physiol. 2010;72:551–577. doi: 10.1146/annurev-physiol-021909-135919. [DOI] [PMC free article] [PubMed] [Google Scholar]
- Yan L, Karatsoreos I, Lesauter J, Welsh DK, Kay S, Foley D, Silver R. Exploring spatiotemporal organization of SCN circuits. Cold Spring Harb Symp Quant Biol. 2007;72:527–541. doi: 10.1101/sqb.2007.72.037. [DOI] [PMC free article] [PubMed] [Google Scholar]
- Yan L, Okamura H. Gradients in the circadian expression of Per1 and Per2 genes in the rat suprachiasmatic nucleus. Eur J Neurosci. 2002;15:1153–1162. doi: 10.1046/j.1460-9568.2002.01955.x. [DOI] [PubMed] [Google Scholar]
- Yan L, Silver R. Differential induction and localization of mPer1 and mPer2 during advancing and delaying phase shifts. Eur J Neurosci. 2002;16:1531–1540. doi: 10.1046/j.1460-9568.2002.02224.x. [DOI] [PMC free article] [PubMed] [Google Scholar]
- Yan L, Silver R. Resetting the brain clock: time course and localization of mPER1 and mPER2 protein expression in suprachiasmatic nuclei during phase shifts. Eur J Neurosci. 2004;19:1105–1109. doi: 10.1111/j.1460-9568.2004.03189.x. [DOI] [PMC free article] [PubMed] [Google Scholar]
- Zheng B, Albrecht U, Kaasik K, Sage M, Lu W, Vaishnav S, Li Q, Sun ZS, Eichele G, Bradley A, Lee CC. Nonredundant roles of the mPer1 and mPer2 genes in the mammalian circadian clock. Cell. 2001;105:683–694. doi: 10.1016/s0092-8674(01)00380-4. [DOI] [PubMed] [Google Scholar]
Associated Data
This section collects any data citations, data availability statements, or supplementary materials included in this article.