Abstract
Purpose
To characterize transverse relaxation in oxygenated whole blood with gadolinium based contrast reagents by experiment and simulation.
Methods
Experimental measurements of transverse 1H2O relaxation from oxygenated whole human blood and plasma were made at 1.5 and 3.0 T. Spin-echo refocused and free-induction decays are reported for blood and plasma samples containing four different contrast reagents (gadobenate, gadoteridol, gadofosveset, and gadobutrol), each present at concentrations ranging from 1 to 18 mM (i.e., mmol(CR)/L(blood)). Monte Carlo simulations were conducted to ascertain the molecular mechanisms underlying relaxation. These consisted of random walks of water molecules in a large ensemble of randomly oriented erythrocytes. Bulk magnetic susceptibility (BMS) differences between the extra- and intracellular compartments were taken into account. All key parameters for these simulations were taken from independent published measurements: they include no adjustable variables.
Results
Transverse relaxation is much more rapid in whole blood than in plasma, and the large majority of this dephasing is reversible by spin echo. Agreement between the experimental data and simulated results is remarkably good.
Conclusion
Extracellular field inhomogeneities alone make very small contributions, whereas the orientation-dependent BMS intracellular resonance frequencies lead to the majority of transverse dephasing. Equilibrium exchange of water molecules between the intra- and extracellular compartments plays a significant role in transverse dephasing.
Keywords: MRI, MR Angiography, Relaxation, Contrast Agents, Bulk Magnetic Susceptibility, Water Exchange, Red Blood Cell
Introduction
Extracellular gadolinium-based contrast reagents (GBCRs) are used in MRI to visualize intravascular spaces and perfused tissue. In applications such as MR angiography, it is important to quantify the relaxation properties of the blood water proton signal (1H2O) in the presence of GBCRs to optimize imaging protocols. For example, in a typical spoiled gradient echo contrast-enhanced MR angiography sequence, equilibrium transverse magnetization can be significantly reduced depending on echo time (TE) and blood R2*. Accurate prediction of blood R2* can help govern the choice of contrast injection rates and employed echo times. Furthermore, in quantitative perfusion imaging, the arterial input function is often measured in an artery nearby the tissue of interest. Knowledge of relaxation rate constants is required to accurately calculate vascular contrast reagent concentrations, [CR]s, from signal intensity and thereby improve quantitative accuracy.
Relaxation of the blood 1H2O MR signal has been studied extensively. It has recently been shown that, though generally unexpected, the equilibrium exchange of water molecules across the erythrocyte cell membrane (trans-cytolemmal exchange) makes a significant contribution to longitudinal relaxation (R1 ≡ 1/T1) when paramagnetic GBCR is present in the plasma space (1). Large plasma [CRe] elevated the longitudinal shutter-speed [the intrinsic R1 difference across the cell membrane] sufficiently to clearly reveal this. For measured transverse relaxation (R2* ≡ 1/T2*), this exchange has received more consideration (2–4), though there is by no means a consensus on its manifestation.
Often, transverse relaxation rate constants measured in pure plasma (in the absence of red blood cells, RBCs) are erroneously extrapolated for use in whole blood. Particularly in gradient echo imaging, transverse relaxation in whole blood could deviate significantly from pure plasma relaxation because the exclusion of the paramagnetic GBCR from the intracellular red blood cell space produces significant magnetic susceptibility gradients.
To better characterize transverse relaxation in plasma and whole blood, we measured relaxation rate constants under physiologic conditions at 1.5 and 3.0 T for four different GBCR molecules [gadobenate (MH, MultiHance, Bracco Diagnostics, Princeton, NJ, USA), gadoteridol (PH, ProHance, Bracco), gadofosveset (AB, Ablavar, Lantheus, North Billerica, MA, USA), gadobutrol (GV, Gadavist, Bayer Healthcare, Whippany, NJ, USA)]. The [CRb] values for each ranged from zero to 18 mM [mmol(CR)/L(blood)]: the latter being potentially reached in contrast-enhanced MR angiography studies (5). With Monte Carlo random walk simulations of the experimental data, we show that intracellular water and trans-cytolemmal water exchange both appear to make significant contributions also to transverse relaxation in these systems.
Theory
The transverse relaxation rate constant measured from a free induction decay (FID), R2*, is the sum of the rate constants for magnetization dephasing that persists after a spin echo (SE) (R2; irreversible) and that re-focusable by the SE (R2′; reversible),
| [1] |
In whole blood, water molecules diffuse and exchange rapidly between intra- and extracellular spaces, with an average residence time inside RBCs (τi) of approximately 10 ms (1,3,6–9). The τi reciprocal is the unidirectional equilibrium water efflux rate constant, kio = 100 s−1. Exclusion of GBCR from RBCs creates a susceptibility difference between the intra- and extracellular spaces. The extracellular susceptibility (χe) is given by,
| [2] |
where χe is expressed in dimensionless (ppm) units, in the SI system, and [CRe] is the mM concentration of GBCR in the extracellular space (10). For all practical [CRe] values (< 20 mM (1,11)), χe is < 0. It becomes just less negative as [CRe] increases.
It is instructive to separate χ contributions into spatially homogeneous (D) and inhomogeneous (I) terms. Thus the magnetic flux density tensor within a general compartment c (Bc) actually sensed by a nuclear spin can be expressed as,
| [3] |
where B0 is the main instrumental flux density (12,13). The susceptibility contribution to the Larmor frequency experienced by the spin in c, δχ,c (in ppm), is given by,
| [4] |
where ωc and ω0 are the resonance frequencies experienced in Bc and B0, respectively (13).
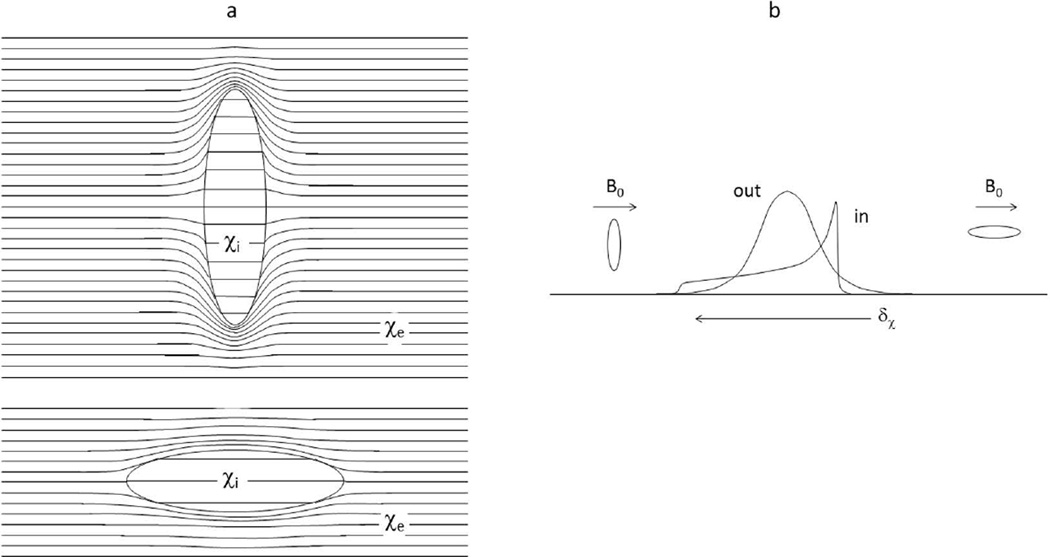
The normal human erythrocyte has the shape of a bi-concave disk, and if the intracellular susceptibility, χi, differs from χe, the intracellular space is magnetically inhomogeneous (i.e., Ii ≠ 0) (2,14–16). However, if one approximates the shape of an isolated RBC as an ellipsoid of rotation, and B0 is uniform, the magnetic field is then homogeneous inside the cell, and Ii vanishes (12,13,17). There is still a non-zero Di term, and this gives rise to a bulk magnetic susceptibility (BMS) shift in the resonant frequency of an intracellular spin that depends on the ellipsoid orientation relative to the B0 direction. Statistically, an oblate ellipsoid is more likely to be oriented with its normal vector perpendicular to than parallel to B0. Thus, in an ensemble of randomly oriented RBCs, a trans-membrane BMS difference would result in a “powder pattern” frequency spectrum for the intracellular water protons (Figure 1; “in” resonance). The Fig. 1 cartoon spectrum represents the case for χe > χi, and no trans-cytolemmal water exchange (kio → 0). Figure 1a is derived from Fig. 8 of (12), while Fig. 1b from Fig. 12 of (12) and Fig. 1 of (18), for deoxygenated blood (χe < χi). It is important to note that the powder pattern is dispersed on either side of the “out” resonance only because of the cavity magnetization effect first realized by Lorentz (12,13) (Supporting Material). This effect has often been neglected in the interpretation of erythrocyte suspension 1H2O MR signals.
Figure 1.
a) The magnetic flux lines in and around an oblate ellipsoid of bulk magnetic susceptibility (BMS) χi in an external medium with susceptibility χe (> χi), and positioned in a horizontal applied magnetic field. The field inside the ellipsoid is uniform, but there is a BMS frequency shift (δχ) relative to that of the external medium. The BMS frequency shift when the ellipsoid normal is aligned with the magnetic field (top) is smaller than when it is perpendicular (bottom), and the perpendicular orientation occurs much more often in randomly oriented cells. Lorentz cavities are not illustrated. b) The resulting intracellular 1H2O resonance frequency spectral distribution for a large ensemble of randomly oriented ellipsoids is the powder pattern (“in”). External to the ellipsoid, the magnetic field is perturbed, creating extracellular field inhomogeneities. The extracellular spectral distribution (“out”) is also shown. For these cartoon spectra, there is no trans-cytolemmal water molecule exchange (kio = 0). Lorentz cavity effects are implicit in the spectra (compare Sup. Figs. S1 and S5).
Because of their inherent magnetic anisotropy when χi ≠ χe, erythrocytes can in principle orient when placed within B0. It is controversial whether they actually do so when in suspension within an MRI magnet – to what extent, and how quickly (14,19). If they do, the lowest energy orientation is with the disk normal perpendicular to B0 (2). With complete alignment, the spectrum in Fig. 1 would exhibit only a single “in” resonance, to the low frequency side of the “out” resonance (for χe > χi) (Sup. Fig. S3).
When χi ≠ χe, the magnetic flux density outside a bi-concave disk is inhomogeneous in a complicated fashion. It has been mapped numerically (2), and it was found that Ie has the geometrical properties of a dipolar field (second rank spherical harmonic), i.e., there is a bi-conical node at the magic angle (54.7°) between the disk long axis and B0, just as outside a sphere. Furthermore, by decreasing extracellular osmolarity, and thereby swelling the RBCs, the Mons group found that “the intrinsic extracellular water” R2 “is not strongly influenced by the erythrocyte shape” (2). Extracellular water proton spins can dephase irreversibly by diffusing through the field inhomogeneities, and there is very little difference as to whether the cell is shaped like a bi-concave disk or a sphere. This inhomogeneous flux density gives rise to susceptibility broadening of the “out” resonance, shown qualitatively in Fig. 1.
Methods
In vitro measurements
All experiments were performed with local institutional review board approval. Whole human blood from a single donor was obtained from the local blood bank, and the albumin concentration was measured in the laboratory. Blood was oxygenated with 95% O2 and 5% CO2 mixture via a bubble diffuser and divided into 40 of 70 six mL high-density polyethylene 13 mm I.D. tubes. The tubes were embedded in 2% agar gel (Cat. no. S70210A, Fisher Scientific, Pittsburgh, USA) in two separate 35-tube phantom trays. This allowed simultaneous measurement of the samples in each tray. The four contrast reagents (gadobenate (MH), gadoteridol (PH), gadofosveset (AB), and gadobutrol (GV)) were added to ten different concentrations (1, 2, 3, 4, 5, 6, 8, 10, 14, and 18 mM, calculated per volume of whole blood) each, and the tubes sealed. The 30 remaining tubes were filled with saline or blood control samples. The phantoms were warmed to 37°C for the experiments and periodically mixed, by inverting the samples between acquisitions, until the whole blood measurements were completed. This occurred approximately every ten minutes, and helped to minimize cell settling (20) and alignment with the magnetic field (Sup. Fig. S4). Following these acquisitions, the samples were isolated for six hours to allow RBC sedimentation from the plasma, and the relaxation measurements were repeated for only the plasma supernatants. Blood laboratory analysis (including oximetry) was performed before and after the whole blood relaxation measurements.
Relaxation measurements were performed using 1.5 and 3.0 T whole body scanners (Achieva, Philips Healthcare, Best, The Netherlands) with an 8-channel head RF coil for signal reception. The cylinder axes of the sample tubes were oriented perpendicular to B0. R2 was measured using a single-slice, 32-echo, Carr-Purcell-Meiboom-Gill (21) turbo spin echo (TSE) T2 mapping sequence with SE spacing of 6.7 ms (at 3.0 T) or 4.8 ms (at 1.5 T), field-of-view (200 × 152) mm2, in-plane resolution (1.0 × 1.0) mm2, slice thickness 3 mm, TR 2 s, and scan time 306 s. R2* was measured using a single-slice spoiled gradient echo T2* mapping sequence, multi-echo fast field echo (FFE), with 32 echoes separated by 1.8 ms (at 3.0 T) and 2.1 ms (at 1.5 T), field-of-view (200 × 152) mm2, resolution (2.0 × 1.0) mm2, slice thickness 3 mm, TR 200 ms, and scan time 122 s. The FFE sequence produces essentially a free-induction decay (FID). The average decay of the signal intensity (SI) from an elliptical region-of-interest placed inside each sample tube was fitted with a mono-exponential expression using non-linear least squares (Matlab, Mathworks, Natick, MA, USA) to yield the R2 or R2* value. Exponential weighting of the echo data was applied during fittings to favor the early echoes. The concentration-dependences of R2 or R2* were fitted with the expressions R2 = r2[CR] + R20 or R2* = r2*[CR] + R20*, respectively, to give experimental relaxivity (r2 or r2*) values for each CR. The CR-free relaxation rate constants, R20 and R20*, were each set to 5 s−1 at both field strengths (22).
Computer Simulations
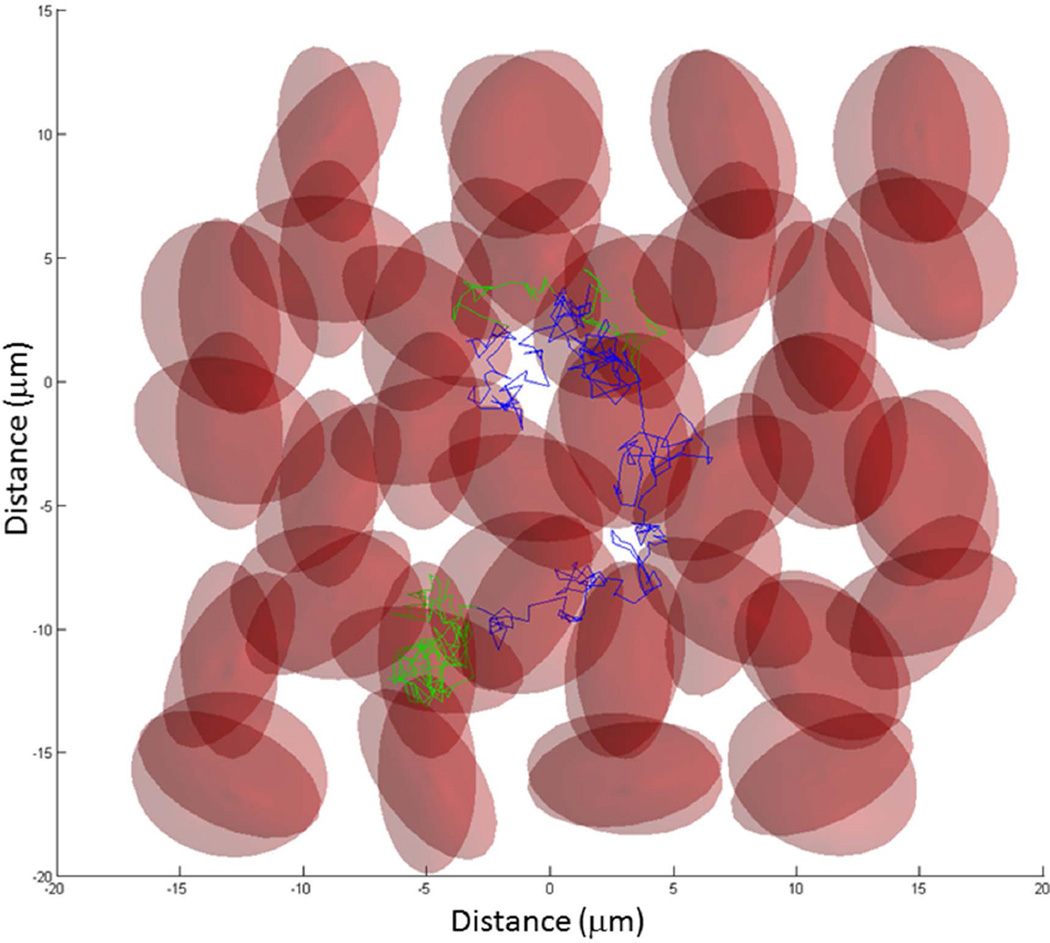
Monte Carlo computer simulations (Matlab) were run to predict the transverse 1H2O relaxation in oxygenated whole blood with various GBCR concentrations (23). Figure 2 displays a 2D projection of a 3D ensemble of randomly oriented oblate ellipsoids (large and small radii 4 and 2 µm) (2,14,15,24). The cell centers were arranged in a hexagonal close packed (HCP) structure, with randomly oriented deviations from HCP lattice points. The maximum deviation magnitude was set to insure the cells would not overlap (i.e., equal to the difference between minimum lattice spacing and the large cell diameter) regardless of orientation. The ellipsoid normals were randomly oriented in spherical coordinates by randomly selecting the azimuthal angle over the range (0, 2π) and the sine of the elevation angle over the range (−1, 1). The random walk steps are shown as straight line segments. These are colored green when the water molecule is inside a cell, and blue when outside.
Figure 2.
Illustration of a simulated water molecule random walk through a 3D ensemble of water-permeable red blood cells (RBCs) (oblate ellipsoids). In this 2D projection, the randomly oriented RBCs are semitransparent to allow visualization of overlapping cells. The trajectory of this random walk begins near the (0, 0) origin. The steps that occur inside a RBC are colored green, while those in the extracellular space are colored blue. To calculate transverse 1H2O relaxation time constants, the actual Monte Carlo random walks used a 2744 RBC ensemble. Details are found in the text.
For the quantitative simulations, each water molecule was allowed to randomly walk inside and outside 2744 spherical cells of radius 3.2 µm and B0 was randomly oriented with respect to the HCP lattice axes. When the water molecules were outside cells, they experienced the inhomogeneous magnetic flux density outside spheres. (The substitution of spherical cells for computational simplicity was foreshadowed above, and is elaborated below.) The water diffusion coefficient (D′) was set to 1.5 µm2/ms (half of the 37°C pure water value (25)). Since the step duration (ts) is 1 µs, this determines the walk root-mean-square straight line segment length (⟨ls⟩rms = (6D′ts)1/2) to be 0.09 µm, if no cell membrane is encountered. The only purpose for this D′ value is to define ⟨ls⟩rms. The random walks seen in Fig. 2 show that diffusion both within and outside the cells is “hindered,” or “restricted”, by the presence of cell membranes. Thus a discrete D′ value for either space has no physical meaning.
The digital permeability of the cell membrane was adjusted to provide an average τi value of 10 ms (kio = 100 s−1) (1). For 1 µs step duration, this was achieved when the fraction of membrane encounters having a permeation (tp, in (24)) was 4.76/103. The equilibrium cell membrane water permeability coefficient, PW, can be calculated as (tp•D′/⟨ls⟩rms) (24), or (d/(6τi)) (26), where d is the diameter of a spherical cell. Interestingly, it has been recently learned that τi, kio, and PW are dependent on the metabolic state of the cell (26). The passive contribution [the rate constant in the absence of Na+,K+-ATPase activity (kio0)] is presumed small and unchanging at physiologic temperature (26).
The ensemble cell density (ρ) was adjusted (i.e., the lattice point spacing was adjusted) such that the intracellular volume fraction (vi; the digital cytocrit) was approximately equal to 38% (This is close to the hematocrit measured for the in vitro whole blood sample, 36%. In the experiment, the latter was diminished slightly by adding CR stock solution aliquots to many of the tubes.) Random walks started at randomized intracellular or extracellular positions near the center of the cell ensemble. It is important to note that the cell size, D′, τi, and vi values are taken from independent measurements (from many different laboratories). These were not adjustable parameters.
The simulated NMR signal dephasing included contributions from both extracellular field inhomogeneities and intracellular BMS frequency differences. In the extracellular space, field inhomogeneity was approximated as the inhomogeneous term (Ie) outside a sphere containing medium with χi, immersed in medium with χe (27)
| [5] |
where χi is taken to be -9.19 ppm (for the fully oxygenated, diamagnetic erythrocytes studied here) (15), χe given by Eq. [2], r the vector between the proton position and the sphere center, α the angle r makes with B0, and R the sphere radius. The Ie expression for even a finite oblate ellipsoid is considerably more complicated than that for a sphere (17). The numerical analyses of a bi-concave disk by the Mons group (2) described above supports approximating the cells as spheres w.r.t. how they are sensed by extracellular water molecules. The De term is χe/3 (27). Contributions from all RBCs in the ensemble were summed to give the frequency at each extracellular position achieved during the walk.
To approximate the intracellular BMS frequency, each cell was treated as disk-shaped and assigned a random orientation with respect to B0 (Fig. 2). The BMS frequency contribution was calculated using the orientation-dependent intra-compartmental homogeneous term for an infinite disk (27),
| [6] |
where φ is the angle between the ellipsoid normal and B0, χi = −9.19 ppm and χe is given by Eq. [2].
Thus, extracellular water molecules were treated as if they were outside spheres (the Nottingham group did the same (28)), and intracellular water molecules were treated as if they were inside infinite disks. Based on the local frequency at the end of each step in the random walk, spin phase (φ′) was accumulated for 1 µs of Larmor precession (φ′ = ∫ ωdt), for each of the 60,000 steps in the 60 ms simulation (Sup. Fig. S2). For the simulation of TSE data, the accumulated phase was reversed every 6.7 (TE at 3.0 T) or 4.8 ms (TE at 1.5 T) starting at TE/2, corresponding to the timing of 180° RF pulses in the in vitro measurements. Simulated signal intensity was obtained by the vector addition of 13,000 water proton spins. In other words, the random walk was run 13,000 times and the ensemble signal was taken as the magnitude of the spin vector sum at each corresponding step in the 13,000 random walks. Simulated total signal was then sampled for TSE at 6.7 ms (3.0 T) or 4.8 ms (1.5 T), and FFE at 1.8 ms intervals, and fitted to mono-exponential decay curves using non-linear least squares for each of the ten concentrations (1, 2, 3, 4, 5, 6, 8, 10, 14, 18 mmol(CR)/L(whole blood)). The simulated relaxation rate constants, R2*, R2, and R2′, were calculated by fitting the sub-sampled decays with mono-exponential functions. The small contribution from relaxation in the absence of GBCR, R20, was neglected.
In addition, to estimate the relative contributions from the extracellular field inhomogeneities and intracellular BMS frequency differences, signal dephasing was calculated for the extracellular contribution only. With the intracellular contribution (Di) turned off, phase was accumulated only when a water molecule was diffusing through extracellular space, not when it was inside a RBC. This calculation was performed during the same set of 13,000 random walks as above, and the resulting simulated extracellular relaxation rate constants are labeled R2e*, R2e, and R2e′.
Finally, simulations were run for the no-exchange-limit (NXL) condition; kio = 0. In this case, cell membrane water permeability was set to zero (permeation encounters). Thus, if a water molecule was originally extracellular or intracellular, it remained so for the entirety of the random walk. Extracellular spins accumulated phase due to Ie, and intracellular spins accumulated phase due to Di. These simulations were run for 6000 water molecules. Ensemble signal evolution was plotted versus time, but relaxation rate constants were not calculated for these simulations.
Results
In vitro measurements
After oxygenation and prior to the GBCR addition and relaxation measurements, whole blood laboratory analyses measured: pH, 7.0; albumin, 3.3 g/dL; hematocrit, 36%; pO2, 169 mmHg; and sO2, 97.3%. After whole blood MR relaxation measurements, oximetry yielded: pO2, 197 mmHg; and sO2, 97.9%.
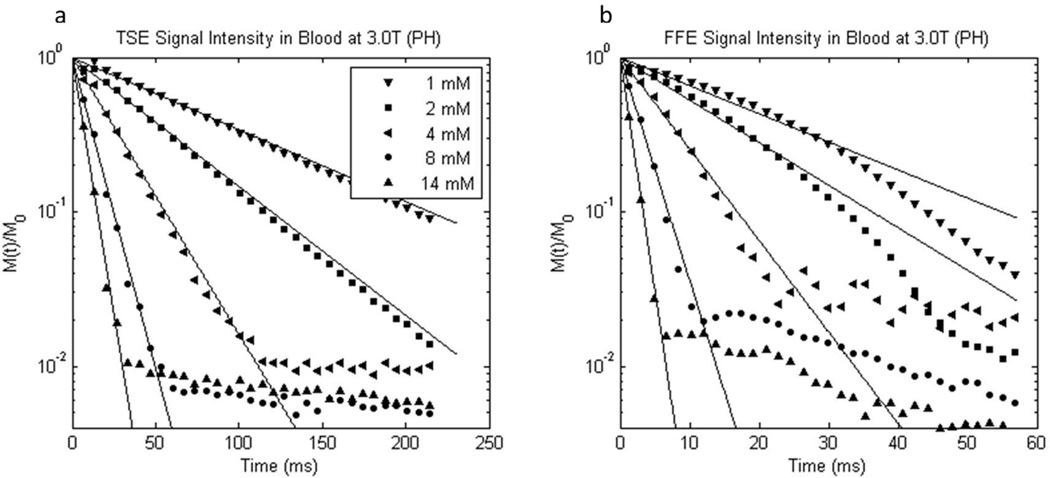
Example data and fittings from 3T TSE and FFE acquisitions from gadoteridol-treated blood are shown in the Figure 3 semi-logarithmic fractional magnetization decay plots, panels a and b, respectively. Note the difference in abscissa scales; the FFE decays are much faster than the TSE decays. The initial data (points) are well-fitted with mono-exponential decay lines. There is some small deviation from mono-exponential behavior for the low [CR] gradient echo data (Fig. 3b). This is not observed in the higher [CR] data where GBCR effects dominate dephasing. When the signal intensity diminishes to the noise level (M(t)/M0 → 10−2), the linear decay ceases.
Figure 3.
Semilogarithmic plots of representative experimental 3.0 T a) turbo spin echo and b) free-induction 1H2O signal decays from oxygenated whole blood samples containing different gadoteridol (PH) concentrations. Note the different abscissa scales. The mM concentration values indicated have units mmol(gadoteridol) per liter(whole blood). Mono-exponential fittings are represented by solid lines.
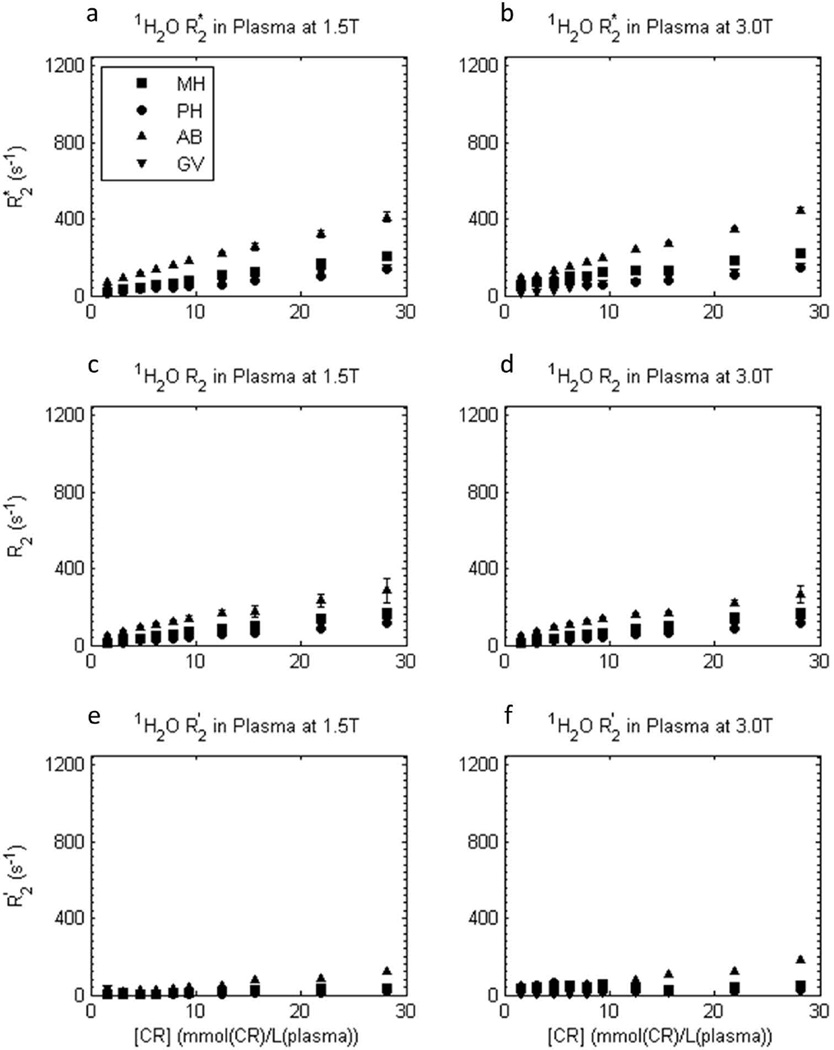
The [CR]-dependences of measured transverse relaxation rate constants R2*, R2, and R2′ (by difference) for 1H2O in plasma (determined from fitted plots such as in Fig. 3) are shown in Figure 4. The R2* and R2 values are different for each chemically different contrast reagent (different figure symbols), and R2′ is very small. The latter indicates, as expected, very little refocusable dephasing occurs in the plasma samples; most is irreversible. The B0 shimming of the plasma samples was effective.
Figure 4.
[CRe]-dependence of experimental transverse 1H2O relaxation R2* (a,b), R2 (c,d), and R2′ ([≡ R2* - R2]; e,f) rate constants in plasma samples at 1.5 T (a,c,e) and 3.0 T (b,d,f), for four different CRs. Error bars for R2* and R2 data represent fitting confidence intervals (these are often no larger than the points). Plasma R2 is largest for gadofosveset (AB), then gadobenate (MH), then gadobutrol (GV) and gadoteridol (PH), and it increases approximately linearly with plasma [CRe] for all reagents. R2′ is very small in plasma.
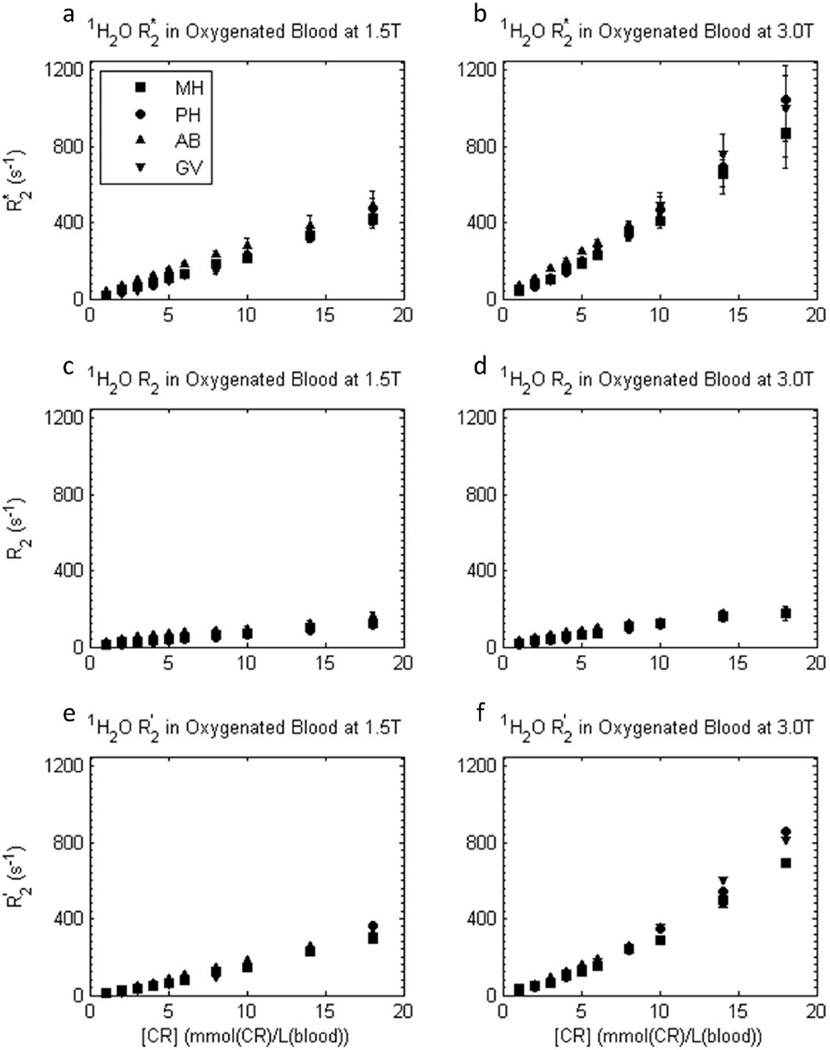
The situation is different for the approximately linear [CRb]-dependences of the transverse relaxation rate constants R2*, R2, and R2′ for 1H2O in blood, shown in Figure 5. First, the R2* values are generally larger (particularly at 3T) than for plasma. Second, the R2*, R2, and R2′ values are similar for all contrast reagents. There is very little dependence on the contrast reagent molecular structure; the hyperfine mechanism [(12), which would lead to hyperbolic [CRb]-dependence (1)] is overwhelmed. Third, the large blood R2′ values indicate the majority of the dephasing is re-focusable by spin echo; most of the accelerated dephasing is reversible. As we will see, each of these three points indicates it is the compartmentalized nature of blood that makes the difference.
Figure 5.
[CRb]-dependence of experimental transverse 1H2O relaxation R2* (a,b), R2 (c,d), and R2′ ([≡ R2* - R2]; e,f) rate constants in oxygenated whole blood samples at 1.5 T (a,c,e) and 3.0 T (b,d,f), for four different CRs. Here, blood concentrations, [CRb], are used. Error bars in R2* and R2 data represent fitting confidence intervals (these are often no larger than the points). In blood, the transverse relaxivities are similar for all four CRs. R2* is approximately doubled at 3.0 T vs. 1.5 T, and R2′ provides a large fraction of R2*.
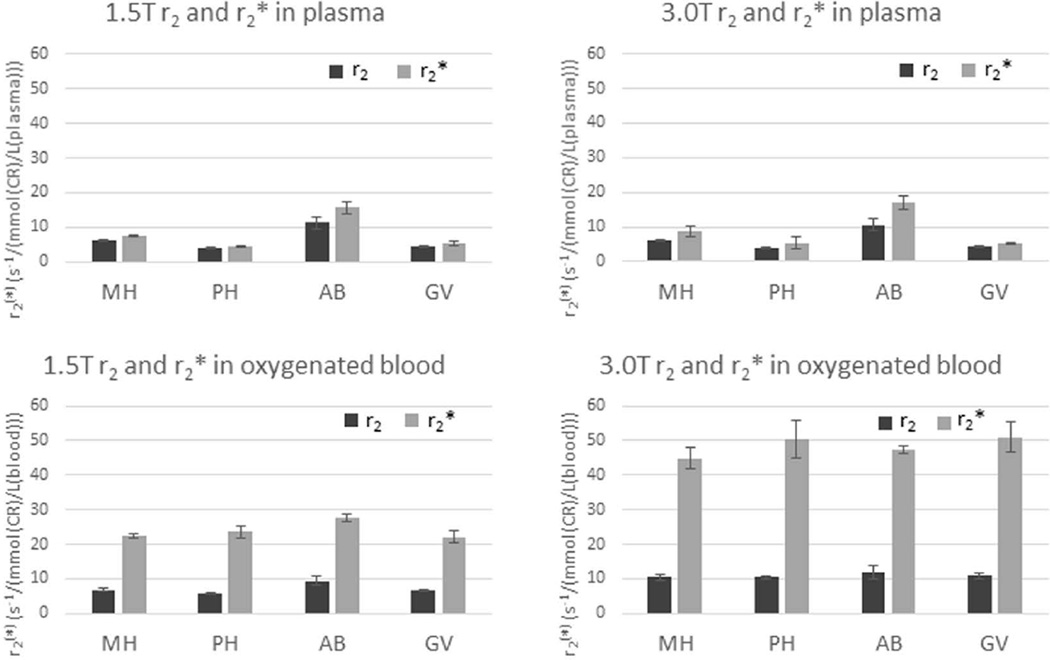
Approximate r2 and r2* relaxivities from the slopes of the linear fittings of R2 and R2* [CR]-dependence (such as in Figs. 4 and 5 middle and top rows, respectively) are presented in Supporting Tables S1 and S2 for GBCRs in plasma and blood, respectively, and summarized in Figure 6. Although the linear fittings provide a reasonable approximation for the [CR]-dependence over this large concentration range (0 to 18 mmol(CR)/L(blood)), close inspection reveals some non-linearities.
Figure 6.
CR relaxivity bar graphs (Sup. Tables S1 and S2). In plasma, r2 ≡ (R2 - R20)/[CRe] (dark bars) and r2* ≡ (R2* - R20*)/[CRe] (light bars); and in blood r2 ≡ (R2 - R20)/[CRb] (dark bars) and r2* ≡ (R2* - R20*)/[CRb] (light bars), where R20 and R20* were set to 5 s−1. These illustrate the very large whole blood r2* values, approximately doubling at 3.0T. In addition, there is relatively little variation in whole blood r2* values between different contrast reagent chelates.
Computer simulations
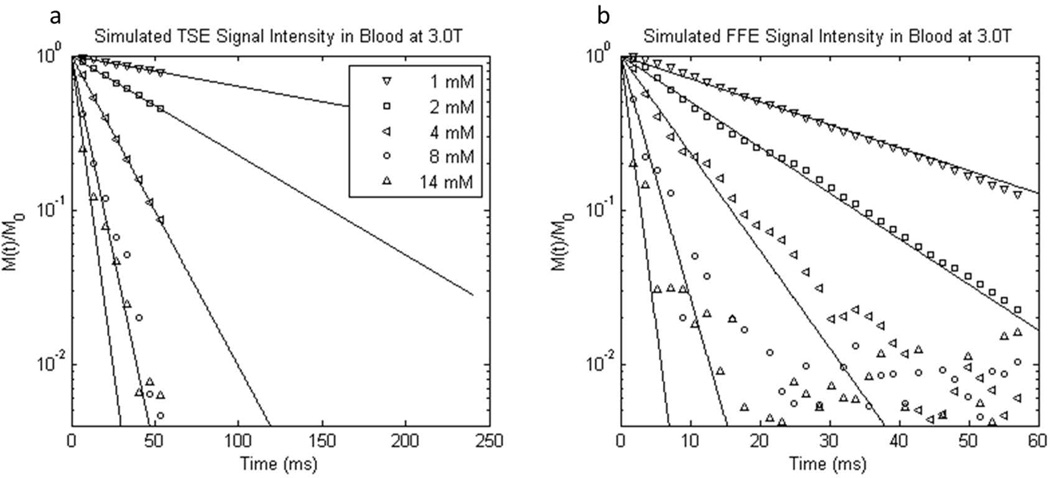
Example results and fittings from the sub-sampled (discretized) TSE and FFE simulated blood decays are shown in Figure 7. These plots are analogous to those in Fig. 3. The results are generally well-fitted by mono-exponential decays, until the noise level is reached, and are applicable to all GBCRs because χe (Eq. 2) is independent of chemical structure. Unlike the TSE experiments, the simulated results are available for only the 60 ms random walk duration. There is relatively large noise after the first few echoes in the high [CR] TSE results, but the logarithms of the decays are reasonably linear. [Completely sampled (continual) simulated blood decays are shown in Sup. Figs. S4 and S6.]
Figure 7.
Semilogarithmic plots of representative simulated 3.0 T a) turbo spin echo and b) free-induction 1H2O signal decays from randomly oriented oxygenated blood cell ensembles containing different GBCR concentrations (simulated χe is the same for all GBCRs). Note the different abscissa scales. The mM concentration values have units mmol(CR) per liter(whole blood). Mono-exponential fittings are represented by solid lines. The simulated signal intensities are vector sums of proton spins from 13,000 Monte Carlo simulations. The decays are discretized by sub-sampling. Though the simulations were of only 60 ms duration, the spin echo fittings (a) are plotted out to 240 ms, for comparison with the experimental data (Fig. 3).
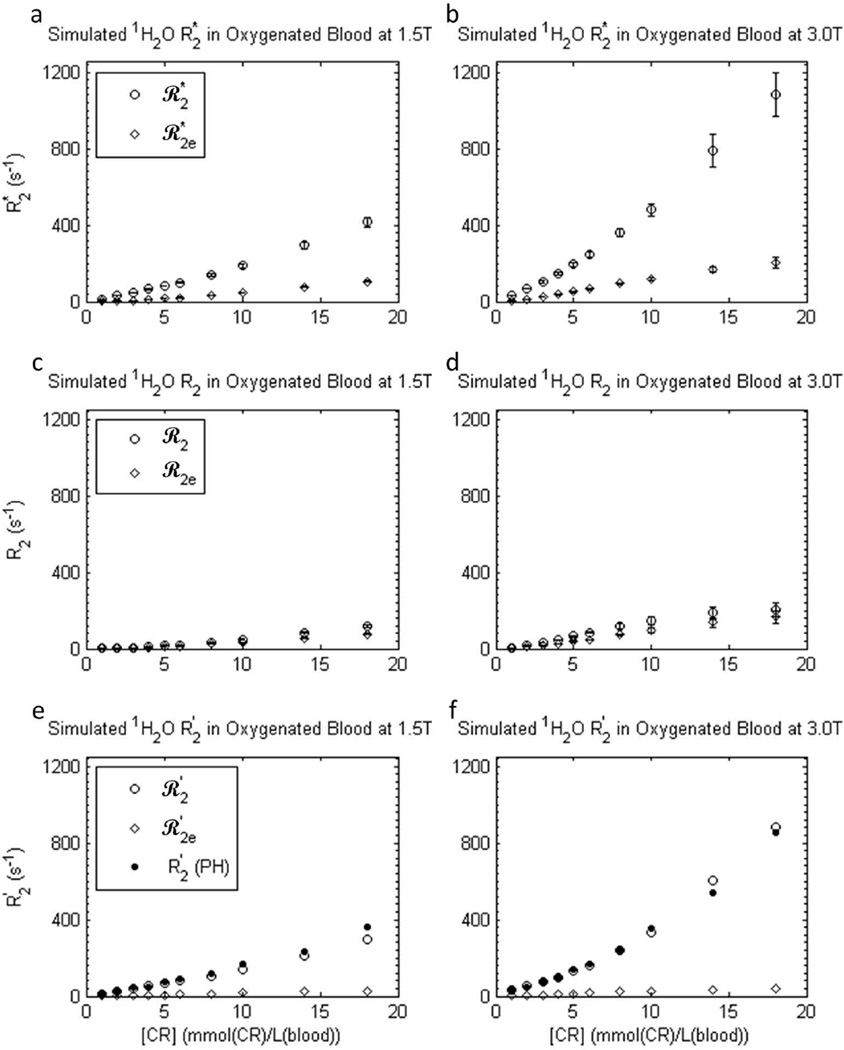
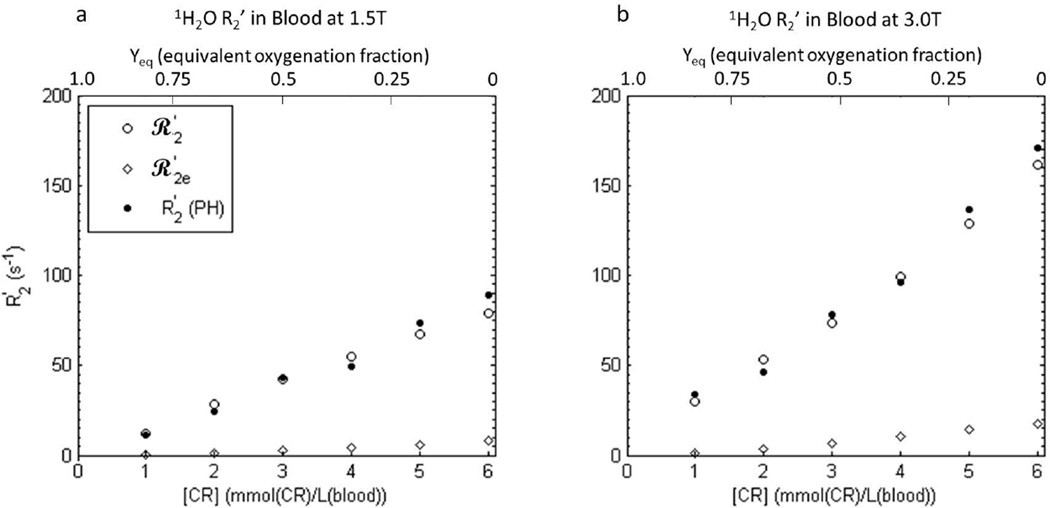
The [CR]-dependences of the simulated blood 1H2O transverse relaxation rate constants R2*, R2, and R2′ are shown in Figure 8 (open circles). As in the in vitro blood experiments (Fig. 5), R2* (top panels) is relatively large and more than double at 3.0 T compared to 1.5 T. In addition, there is a relatively large reversible contribution to the dephasing (R2′; bottom panels), also as in the experimental data (Fig. 5). Both R2* and R2′ increase supra-linearly with concentration. The simulated R2′ values (open circles, bottom panels) are in remarkable agreement with the experimental R2′ values (filled circles; PH); the points are almost indistinguishable.
Figure 8.
Simulated transverse 1H2O relaxation rate constants ℛ2* (a,b), ℛ2 (c,d), and ℛ2′ [(≡ℛ2* - ℛ2); e,f] for an ensemble of randomly oriented oxygenated blood cells at 1.5 T (a,c,e) and 3.0 T (b,d,f) as functions of GBCR concentration: here, blood concentration, [CRb]. Error bars in ℛ2* and ℛ2 results represent fitting confidence intervals (these are often no larger than the points). Rate constants were predicted using both extracellular field inhomogeneities and intracellular BMS frequency differences (open circles), and only extracellular inhomogeneities (open diamonds). The experimental R2′ values for gadoteridol (Fig. 5 circles) are re-plotted in e-f (filled circles) to show the remarkable agreement of ℛ2′ with R2′ when both dephasing contributions are included. Simulation details are given in the text: there are no adjustable parameters. Simulations using only the extracellular field inhomogeneities (open diamonds) resulted in ℛ2e dephasing, but very little ℛ2e′.
Rate constants simulated for only extracellular dephasing (R2e*, R2e, and R2e′) are also displayed (open diamonds) in Fig. 8. R2e* and R2e′ are much smaller than R2* and R2′ obtained in simulations that included intracellular dephasing. Diffusion through the extracellular field inhomogeneities appears to account for only a small fraction of the total dephasing. The simulated rate constants for reversible extracellular magnetization decay (R2e′) are relatively low for all [CR] values at both field strengths (bottom panels). This indicates the small dephasing caused by the extracellular field inhomogeneities is largely not re-focusable by spin echo, and is thus irreversible (i.e., caused by molecular-scale fluctuations).
It is instructive to consider BMS contributions to 1H2O transverse relaxation in CR-free blood with varying amounts of fractional oxygenation Y (the blood-oxygenation-level-dependent [BOLD] effect in the blood). In that case, decreasing Y means increasing intracellular, paramagnetic deoxy-hemoglobin and χi > χe. Susceptibility effects on transverse relaxation, however, depend on only the absolute value of the χi, χe difference, |Δχ| (12). |Δχ| depends linearly on either Y (28) or [CRe] (Eq. 2). Thus, converting the molar susceptibilities of deoxy- and oxy-hemoglobin reported in (28) to SI units, we can calculate the equivalences of Y and [CRe] in producing |Δχ| values. For Yeq = 0 (i.e., completely deoxygenated blood), we obtain the equivalent value of [CRe] to be 9.8 mM. Figure 9 displays enlargements of regions near the origins of the Fig. 8 bottom panels. The only differences are that the upper abscissae show Yeq, increasing from right to left. Taking note that the Fig. 8 abscissae represent [CRb], not [CRe], the Yeq values run from 1 (when [CRb] = 0 mM) to 0 (when [CRb] = 6.1 mM; 37% hematocrit). Only Y variation [i.e, the BOLD effect] was used in many literature studies (20,29–31). The large blood-agent-level-dependent (BALD) effect (12) range in Figs. 8e,f (3X the BOLD range) makes the very minor extracellular 1H2O contribution (R2e′) to R2′ very obvious.
Figure 9.
a, b) Enlargements of the areas near the Fig. 8 e and f origins, respectively. The upper abscissae are labeled with Yeq, the fractional oxygenation of RBC hemoglobin – running from right-to-left (Yeq = 0 represents completely deoxygenated (paramagnetic) hemoglobin). This would be the situation for CR-free blood. The lower abscissa [CRb] range in oxygenated blood produces the same range of transmembrane susceptibility difference as would the full range of blood oxygenation (Yeq, top abscissa scale) in the absence of contrast reagent. In other words, blood oxygenation Yeq of 1.0 produces the same |Δχ| as would [CRb] = 0 mM in fully oxygenated blood, and Yeq of 0 produces the same |Δχ| as would [CRb] = 6.1 mM in fully oxygenated blood (with 37% Hct).
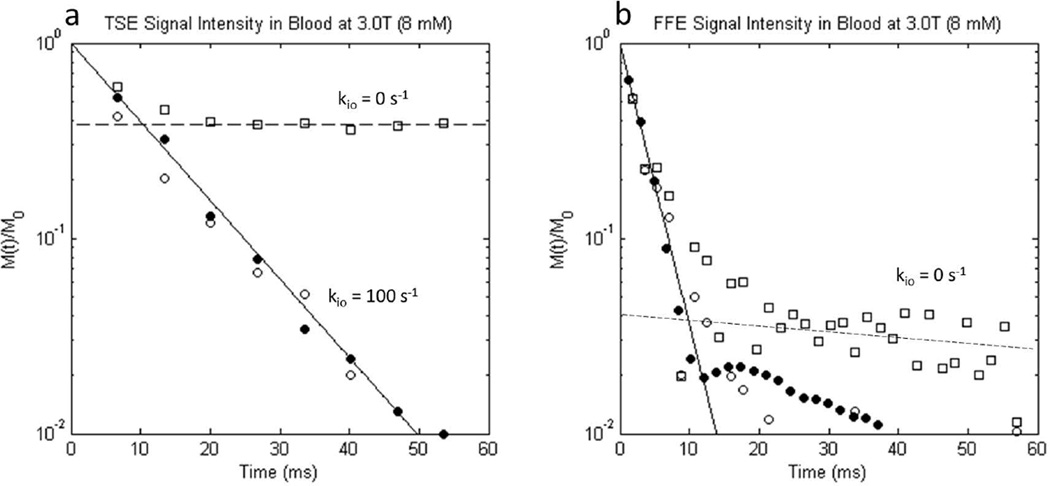
Results for the NXL condition (kio → 0) simulations (open squares) are shown in the Figure 10 semi-logarithmic plots of (a) TSE and (b) FFE signal decay along with the matching experimental data ([CRb] = 8 mM PH, filled circles (Fig. 3 filled circles)) and kio = 100 s−1 (τi = 10 ms) simulation (open circles (Fig. 7 open circles)). As seen in the TSE results (Fig. 10a), 62% of the signal dephases irreversibly in the NXL condition, but 38% persists [i.e., 38% of the dephasing is indefinitely re-focusable by spin echo (since we neglect R20)]. The re-focusable signal originates from the intracellular water fraction, as these spins are confined to the cells and thus each has a fixed resonance frequency (the spins are isochromats; recall the simulated RBCs do not change orientation during the 60 ms random walk). The simulated FID (Fig. 10b) is also bi-exponential. Intracellular spins trapped in different cells have different frequencies, but during the FID there is no 180° pulse to reverse their precessions and re-focus their vector sum. There is a small (4% of signal) component that dephases very slowly. This signal likely results from spins trapped in cells whose normals are perpendicular to the magnetic field (i.e., resonance frequency is that of the peaked shoulder of the intracellular powder pattern, Fig. 1 and Sup. Fig. S1). There are more such spins than in other cell orientations, and therefore their coherence persists longer. Thus it is clear that equilibrium trans-cytolemmal water exchange plays a significant role in transverse 1H2O relaxation of blood containing paramagnetic CR in the plasma. If this exchange is turned off, the simulated data come nowhere close to agreement with experiment.
Figure 10.
Semilogarithmic plots of simulated 3.0 T a) turbo spin echo and b) free-induction 1H2O signal decays from ensembles of randomly oriented oxygenated erythrocytes in blood with [CRb] = 8 mM. Simulated (open shapes) and experimental (PH; filled circles; Fig. 3 filled circles) signal intensities are indicated, along with the fitted mono-exponential decays (solid lines; PH experimental data). In addition to the kio = 100 s−1 [τi = 10 ms] simulations (open circles), results are presented for the no-exchange-limit [NXL] condition [kio = 0] simulations (open squares). In the NXL condition, spins constrained to the intracellular space (38% of the total spins) are completely re-focused by a spin echo, while the extracellular spins are only partially re-focused, and therefore their vector sum decays. Thus, the NXL condition TSE signal intensity never drops below 38% of M0. A dashed line through the open squares at longer times intercepts the ordinate at 0.38 (panel a). Conversely, in the kio = 100 s−1 simulations (open circles), spins can leave the confines of a single RBC, and thus dephase irreversibly. Only these simulations agree with the experimental data (filled circles) in panel a. Equilibrium trans-cytolemmal water exchange plays an important role in blood 1H2O transverse relaxation. For the free-induction-decay (panel b), the simulation behavior differs. Almost all of the simulated spin coherence decays rapidly. A dashed line drawn through the open squares at longer times intercepts the ordinate at only 0.04. This is consistent with the ∼4 % of all water that is trapped in cells whose normals are perpendicular to B0 (φ = 90°, Eq. [6]). Since there are more of these isochromats (Fig. 1 and Sup. Fig. S1), their coherence persists after most of the other signals have decayed. As in panel a, however, the kio = 100 s−1 simulation (open circles) exhibits better agreement with the experimental data (filled circles), because the water can eventually escape these cells, and its spins can dephase.
Discussion
We report experimental measurements of R2 and R2* as functions of B0 and [CR] in plasma and in oxygenated blood, for four different GBCRs. While there are reports of blood and plasma 1H2O r2 values for various GBCRs, little is known about r2* in whole blood, which is important for non-spin echo imaging. Our measured relaxivities are given in Fig. 6 and Sup. Tables S1 and S2. They agree with analogous r2 literature values in bovine plasma and canine whole blood (32), measured over smaller [CRe] and [CRb] ranges, except their estimate of greater AB r2 may be attributed to unsaturated protein-CR binding (1) at the small [CR] values studied (32).
The Nottingham group measured R2* for [PHb] and [ABb] values between 0.3 and 3 mM in partially deoxygenated blood, at three B0 values (28). They report a parabolic [CRb]-dependence, indicating χi, χe susceptibility matching near [CRb] = 1.5 mM. The salient point is that the Nottingham R2* values are on-the-order of our reported values, and thus are much higher in whole blood than in plasma. The authors did not measure R2, to separately quantify the reversible and irreversible transverse relaxation components (28). Our data show the majority of dephasing in whole blood is reversible by spin echo (R2 is much smaller than R2′). This suggests a whole blood dephasing mechanism that is largely static during the < 7 ms inter-echo spacing (Sup. Fig. S2). (Interestingly, this is not seen when χi ≠ χe samples are not shimmed (29,30).)
The most important insights come from our simulations. These employed Monte Carlo random walks of water molecules through an ensemble of randomly oriented, stationary erythrocytes. The validity of our relatively simple model is supported by the fact that the predicted large R2′ contribution (open circles) is nearly identical to the experimental result (filled circles) (Fig. 8). It is important to note that this remarkable agreement was achieved with essentially no adjustable variables. The values of important parameters, such as cell size, vi, χi, χe, D′, and τi, were taken from independent literature reports. The agreement with experimental results indicates the cells do not rotate significantly on the 7 ms time scale.
There are two major conclusions from our simulations. First, the contribution of extracellular field inhomogeneities (R2e*, R2e. and R2e′ in Fig. 8) themselves to overall transverse relaxation is quite small. This is in agreement with the Nottingham researchers, who reported similar Monte Carlo simulations, but of only extracellular water (28). There is an error in their Figs. 3 and 5 abscissae. The quantity plotted is [CRb], but [CRe] is required for the calculations. These results show that the dephasing caused by water diffusion through the extracellular magnetic field inhomogeneities provides only a small fraction of the total reversible dephasing. The precession frequency susceptibility contribution experienced by extracellular water protons, while often large, fluctuates rapidly and quickly averages to near zero (Sup. Fig. S2). The majority of the dephasing results from the intracellular BMS frequency differences (not considered in (28)), and this dephasing is largely reversible by spin echo.
The second major conclusion is that equilibrium trans-membrane water exchange is crucial for transverse 1H2O relaxation in blood. This is seen in the simulation results when the exchange kinetics (kio) are set to zero (Fig. 10). The simulated results do not resemble the experimental results at all. Yet, when kio is set to the known value, 100 s−1 (1), the simulated and experimental data match almost perfectly. In the NXL condition, all the spins trapped inside RBCs could be completely re-focused by a spin echo, while spins in the plasma space still dephased over time. As stated above, cellular rotations are not sufficiently rapid to account for the discrepancy between the NXL results and experiment. Only when trans-membrane water exchange is permitted, originally-intracellular spins can experience extracellular and other intracellular environments and dephase irreversibly. The signal decay experimentally observed clearly included transmembrane water exchange.
The in vitro data and simulations here directly explored the effect of GBCR in oxygenated or arterial blood. However, it is interesting to consider the effects of partially oxygenated or venous blood as well. In the absence of GBCR, RBCs in partially oxygenated blood will be more paramagnetic than surrounding plasma because paramagnetic deoxyhemoglobin is confined to the RBCs. In this case, extracellular field inhomogeneities and intracellular BMS shift will have the same form (Eqs. 5 and Eqs. 6), but with opposite sign. The translation of our results to the oxygenation fraction, Y, of CR-free blood is shown in Fig. 9.
In addition to oxygenation, transverse relaxation is likely dependent on the hematocrit. Although it was beyond the scope of this study, different hematocrit levels will vary the relative water population fractions pi (intracellular) and pe (extracellular), and vary the average plasma residence time τe. Likely, the transverse relaxation rate constant R2* would increase with increasing hematocrit, as the fraction of intracellular water undergoing BMS shift dephasing will increase. This effect warrants further study.
While the agreement between the experimental data and the simulation is remarkable, generally one would expect some deviation between measurement and simulation due to the approximations used (eg, spherical vs. bi-concave cells). There are still some limitations of this study. In particular, all experimental measurements were made in vitro, and while every attempt was made to replicate the in vivo environment (eg, oxygenation, pH, temperature), there still may be aspects of the in vivo environment that alter 1H2O relaxation. One of these aspects may be blood flow and the motion of the RBCs. The in vitro samples had relatively little RBC motion compared to arterial blood, and the simulation assumed the RBCs were stationary throughout.
Capillary blood flow is much too slow to affect the dynamics modeled here. For example, a conservative estimate for the mean blood transit time through a capillary in a high-resolution 1H2O brain MRI voxel is one second (33). This is 17 times the lengths of the Figs. 3b, 7b, 10, S2, S4, and S6 abscissae, and four times the lengths of the Fig. 3a and 7a abscissae. Thus, any given water molecule enters and leaves red blood cells about 40 times and experiences many extracellular fluctuations [Fig. S2] during its voxel passage. Also, transverse relaxation is complete long before this period is ended [Figs. 3, 7, 10, S4, and S6].
Furthermore, the successful simulations did not include any RBC alignment with the magnetic field. This appears not to have occurred in vitro (Sup. Figs. S3 and S4). The Δχ value for the simulations in Figs. S3 and S4 is 33% greater than would be the case for fully de-oxygenated whole blood. These cells did not orient, and would be even less likely to in flowing blood.
Finally, the measurements and simulations were performed for a single hematocrit of 37 ± 1%, on the low end of the normal range. In addition to using stationary, spherical RBCs, there were other approximations used in the simulations: using the BMS shift frequency for a disk rather than bi-concave ellipsoid; and neglecting higher order terms such as the intracellular inhomogeneity “proximity” terms.
In an ensemble of many cells, when their separations necessarily become small, the Ie of an adjacent cell can penetrate its neighbor. Then, in principle, even when approximating the RBC as an ellipsoid of revolution, the Ii term is no longer zero. We have neglected this “proximity” susceptibility effect in our simulation. The excellent agreement between simulated and experimental results suggests its effect is small.
Despite these approximations, the simulations accurately predict the experimental relaxation data. In particular, the simulations predict the high blood r2* and the large fraction of reversible dephasing. The very gratifying agreement between experiment and simulation indicates that all of these limitations are minor.
In conclusion, 1H2O transverse relaxation in oxygenated whole blood was measured and predicted via Monte Carlo simulations. R2* values are much higher in whole blood than in plasma due to the exclusion of the GBCR from the intracellular space, and increase with magnetic field strength. Re-focusable R2′ dominates the transverse relaxation and is primarily attributed to orientation-dependent BMS frequencies of intracellular water protons in the presence of trans-cytolemmal water exchange.
Note Added During Revision
After this work was completed, a paper appeared (34) proposing the consensus human erythrocyte τi value of 10 ms [kio = 100 s−1] is caused by the common use in the seminal studies of Mn(H2O)62+ as the extracellular CR to raise the shutter-speed. The authors report the use of GBCR yields a τi value of 19 ms [kio = 53 s−1] (34). Therefore, we substituted a value of τi = 21 ms [kio = 48 s−1] in our simulations. This caused very little difference in our simulated results, except for a slightly poorer agreement with the experimental data at the largest [CR] values. [For example, the last two open circles in Fig. 8f are very slightly elevated.] Thus, our results are more consistent with the consensus value of kio = 100 s−1. A possible reason for this difference is that the new experiments were conducted at 25°C (34). Our experiments were conducted at 37°C and, generally, rate constants increase with temperature. Another possible source of variation is that the kio value has recently been found to depend on the metabolic state of the cell (26). Generally, this has not been controlled in studies of whole blood or erythrocyte suspensions.
Supplementary Material
Supporting Table S1. Water proton transverse relaxivities (r2 and r2*) in plasma (s−1/(mmol(CR)/L(plasma))) at 1.5 and 3.0 T. Relaxivities were determined by best fittings with the linear expression R2(*) = r2(*)[CRe] + 5 s−1. Data were fit over the concentration [CRe] range from 1.6 to 28 mmol(CR)/L(plasma). Confidence intervals from the linear fittings are listed in parentheses.
Supporting Table S2. Water proton transverse relaxivities (r2 and r2*) in blood (s−1/(mmol(CR)/L(blood))) at 1.5 and 3.0 T. Relaxivities were determined by best fittings with the linear expression R2(*) = r2(*)[CRe] + 5 s−1. Data were fit over the concentration [CRb] range from 1 to 18 mmol(CR)/L(blood). Confidence intervals from the linear fittings are listed in parentheses.
Supporting Figure S1. The distributions of resonance frequencies sensed during random walks through a cell ensemble. This spectrum is for randomly oriented erythrocytes, [CRb] = 8 mM and B0 = 3T.
Supporting Figure S2. Example a) resonance frequency time-course and b) accumulated precessional phase trajectory of a single water proton during a random walk through an ensemble of randomly oriented erythrocytes; [CRb] = 8 mM and B0 = 3T. This water molecule started in extracellular space and entered, and exited, three erythrocytes (a, horizontal line segments) with different orientations. In the extracellular space, the water proton experiences rapid fluctuations centered about zero frequency shift (relative to De = χe/3; −217 Hz in this case; Eq. [5]). Thus, while extracellular, it accumulated phase much more slowly than while it was intracellular.
Supporting Figure S3. The distributions of resonance frequencies sensed during random walks through a cell ensemble. This intracellular spectrum is for erythrocytes with all ellipsoid normals perpendicular to the B0 direction, [CRb] = 8 mM and B0 = 3T. The intracellular resonance frequency is χi/3 ppm (φ = 90o, Eq. [6]; −391 Hz, here) for all intracellular water protons.
Supporting Figure S4. Semilogarithmic plots of completely sampled (continual) simulated signal intensity decays from samples with randomly oriented cells (dark curve) and completely aligned cells (light curve); kio = 100 s−1, [CRb] = 8 mM and B0 = 3T. The aligned cell simulated FID (light curve) exhibits slower decay than the experimental data (filled circles), while the randomly oriented cell simulated FID matches them quite closely.
Supporting Figure S5. The distributions of resonance frequencies sensed during random walks through an ensemble of randomly oriented cells. This spectrum was obtained when the Lorentz cavity was neglected; for [CRb] = 8 mM and B0 = 3T. Notice both intra- and extracellular distributions are shifted to lower frequency compared to the case including the Lorentz cavity (Fig. A1), but by different amounts. Thus, if the Lorentz cavity is neglected, water proton spins experience a broader range of frequencies.
Supporting Figure S6. Semilogarithmic plots of completely sampled (continual) simulated signal intensity decays with (dark curve) and without (light curve) the Lorentz cavity correction; for kio = 100 s−1, [CRb] = 8 mM and B0 = 3T. The “no Lorentz cavity” simulated FID exhibits more rapid decay than the experimental data (filled circles) and very high frequency modulations. On the other hand, the signal decay including the Lorentz cavity correction matches the experimental data (filled circles) quite well.
Acknowledgments
We thank Drs. Thomas Barbara, Christopher Kroenke, Xin Li, Mark Woods, and William Rooney for spirited discussions. This work was funded in part by a grant from Bracco Diagnostics, and by NIH support: UO1 CA154602 and R44 CA180425.
Abbreviations
- AB
gadofosveset trisodium, Ablavar
- BMS
bulk magnetic susceptibility
- BOLD
blood oxygenation level dependent
- CR
contrast reagent
- [CRb]
blood tissue contrast reagent concentration: mol(CR)/liter(whole blood)
- [CRe]
extracellular contrast reagent concentration
- D
homogeneous contribution to the magnetic field
- De
extracellular homogeneous term
- Di
intracellular homogeneous term
- D′
water diffusion coefficient
- FFE
fast field echo or gradient echo
- FID
free-induction decay
- GBCR
gadolinium-based contrast reagent
- GV
gadobutrol, Gadavist
- HCP
hexagonal close packed
- I
inhomogeneous contribution to the magnetic field
- Ie
extracellular inhomogeneous term
- Ii
intracellular inhomogeneous term
- MH
gadobenate dimeglumine, MultiHance
- PH
gadoteridol, ProHance
- RBC
red blood cell
- SE
spin echo
- SI
signal intensity
- TSE
turbo spin echo
Footnotes
This work was presented in part at the 22nd Annual Meeting of the International Society for Magnetic Resonance in Medicine, Milan, Italy, April 2014.
References
- 1.Wilson GJ, Woods M, Springer CS, Jr, Bastawrous S, Bhargava P, Maki JH. Human whole-blood (1)H2O longitudinal relaxation with normal and high-relaxivity contrast reagents: influence of trans-cell-membrane water exchange. Magn Reson Med. 2014;72:1746–1754. doi: 10.1002/mrm.25064. [DOI] [PMC free article] [PubMed] [Google Scholar]
- 2.Gillis P, Petö S, Moiny F, Mispelter J, Cuenod CA. Proton transverse nuclear magnetic relaxation in oxidized blood: a numerical approach. Magn Reson Med. 1995;33:93–100. doi: 10.1002/mrm.1910330114. [DOI] [PubMed] [Google Scholar]
- 3.Bryant RG, Marill K, Blackmore C, Francis C. Magnetic relaxation in blood and blood clots. Magn Reson Med. 1990;13:133–144. doi: 10.1002/mrm.1910130112. [DOI] [PubMed] [Google Scholar]
- 4.Thulborn KR, Waterton JC, Matthews PM, Radda GK. Oxygenation dependence of the transverse relaxation time of water protons in whole blood at high field. Biochimica et Biophysica Acta. 1982;714:265–270. doi: 10.1016/0304-4165(82)90333-6. [DOI] [PubMed] [Google Scholar]
- 5.Hadizadeh DR, Jost G, Pietsch H, et al. Intraindividual quantitative and qualitative comparison of gadopentetate dimeglumine and gadobutrol in time-resolved contrast-enhanced 4-dimensional magnetic resonance angiography in minipigs. Investigative Radiology. 2014;49:457–464. doi: 10.1097/RLI.0000000000000036. [DOI] [PubMed] [Google Scholar]
- 6.Herbst MD, Goldstein JH. A review of water diffusion measurement by NMR in human red blood cells. The American Journal of Physiology. 1989;256:C1097–C1104. doi: 10.1152/ajpcell.1989.256.5.C1097. [DOI] [PubMed] [Google Scholar]
- 7.Kuchel PW, Benga G. Why does the mammalian red blood cell have aquaporins? Biosystems. 2005;82:189–196. doi: 10.1016/j.biosystems.2005.07.002. [DOI] [PubMed] [Google Scholar]
- 8.House C. Water transport in cells and tissues. Baltimore: Williams and Wilkins; 1974. [Google Scholar]
- 9.Hills B, Belton P. NMR studies of membrane transport. Ann Rep NMR Spectrosc. 1989;21:99–159. [Google Scholar]
- 10.Albert MS, Huang W, Lee JH, Patlak CS, Springer CS., Jr Susceptibility changes following bolus injections. Magn Reson Med. 1993;29:700–708. doi: 10.1002/mrm.1910290520. [DOI] [PubMed] [Google Scholar]
- 11.Landis CS, Li X, Telang FW, Coderre JA, Micca PL, Rooney WD, Latour LL, Vétek G, Pályka I, Springer CS., Jr Determination of the MRI contrast agent concentration time course in vivo following bolus injection: effect of equilibrium transcytolemmal water exchange. Magn Reson Med. 2000;44:563–574. doi: 10.1002/1522-2594(200010)44:4<563::aid-mrm10>3.0.co;2-#. [DOI] [PubMed] [Google Scholar]
- 12.Springer C. Physicochemical principles influencing magnetopharmaceuticals. In: Gilles R, editor. NMR in physiology and biomedicine. San Diego: Academic Press; 1994. pp. 75–99. [Google Scholar]
- 13.Chu SC, Xu Y, Balschi JA, Springer CS., Jr Bulk magnetic susceptibility shifts in NMR studies of compartmentalized samples: use of paramagnetic reagents. Magn Reson Med. 1990;13:239–262. doi: 10.1002/mrm.1910130207. [DOI] [PubMed] [Google Scholar]
- 14.Higashi T, Yamagishi A, Takeuchi T, Kawaguchi N, Sagawa S, Onishi S, Date M. Orientation of erythrocytes in a strong static magnetic field. Blood. 1993;82:1328–1334. [PubMed] [Google Scholar]
- 15.Plyavin’ YA, Blum EY. Magnetic Parameters of Blood Cells and High-Gradient Paramagnetic and Diamagnetic Phoresis. Magnetohydrodyanamics. 1983;19:349–359. [Google Scholar]
- 16.Brindle KM, Brown FF, Campbell ID, Grathwohl C, Kuchel PW. Application of spin-echo nuclear magnetic resonance to whole-cell systems Membrane transport. The Biochemical journal. 1979;180:37–44. doi: 10.1042/bj1800037. [DOI] [PMC free article] [PubMed] [Google Scholar]
- 17.Kuchel PW, Bulliman BT. Perturbation of homogeneous magnetic fields by isolated single and confocal spheroids Implications for NMR spectroscopy of cells. NMR in Biomedicine. 1989;2:151–160. doi: 10.1002/nbm.1940020404. [DOI] [PubMed] [Google Scholar]
- 18.Springer C. Bulk Magnetic Susceptibility Frequency Shifts in Cell Suspensions. NMR in Biomedicine. 1994;7:198–202. doi: 10.1002/nbm.1940070406. [DOI] [PubMed] [Google Scholar]
- 19.Kuchel PW, Coy A, Stilbs P. NMR “diffusion-diffraction” of water revealing alignment of erythrocytes in a magnetic field and their dimensions and membrane transport characteristics. Magn Reson Med. 1997;37:637–643. doi: 10.1002/mrm.1910370502. [DOI] [PubMed] [Google Scholar]
- 20.Spees WM, Yablonskiy DA, Oswood MC, Ackerman JJ. Water proton MR properties of human blood at 1.5 Tesla: magnetic susceptibility, T(1), T(2), T*(2), and non-Lorentzian signal behavior. Magn Reson Med. 2001;45:533–542. doi: 10.1002/mrm.1072. [DOI] [PubMed] [Google Scholar]
- 21.Meiboom S, Gill D. Modified spin-echo method for measuring nuclear relaxation times. Rev. Sci. Instrum. 1959;29:688–691. [Google Scholar]
- 22.Barth M, Moser E. Proton NMR relaxation times of human blood samples at 1.5 T and implications for functional MRI. Cellular and Molecular Biology (Noisy-le-Grand, France) 1997;43:783–791. [PubMed] [Google Scholar]
- 23.Weisskoff RM, Zuo CS, Boxerman JL, Rosen BR. Microscopic susceptibility variation and transverse relaxation: theory and experiment. Magn Reson Med. 1994;31:601–610. doi: 10.1002/mrm.1910310605. [DOI] [PubMed] [Google Scholar]
- 24.Regan DG, Kuchel PW. Simulations of NMR-detected diffusion in suspensions of red cells: the “signatures” in q-space plots of various lattice arrangements. European Biophysics Journal : EBJ. 2003;31:563–574. doi: 10.1007/s00249-002-0249-8. [DOI] [PubMed] [Google Scholar]
- 25.Ackerman JJH, Neil JJ. The use of MR-detectable reporter molecules and ions to evaluate diffusion in normal and ischemic brain. NMR in Biomedicine. 2010;23:725–733. doi: 10.1002/nbm.1530. [DOI] [PMC free article] [PubMed] [Google Scholar]
- 26.Springer CS, Jr, Li X, Tudorica LA, et al. Intratumor mapping of intracellular water lifetime: metabolic images of breast cancer? NMR in Biomedicine. 2014;27:760–773. doi: 10.1002/nbm.3111. [DOI] [PMC free article] [PubMed] [Google Scholar]
- 27.Springer C. Aspects of bulk magnetic susceptibility in in vivo MRI and MRS. In: Rinck P, Muller R, editors. New developments in contrast agent research. 1st. Sophia Antipolis: European Magnetic Resonance Forum; 1991. pp. 13–25. [Google Scholar]
- 28.Blockley NP, Jiang L, Gardener AG, Ludman CN, Francis ST, Gowland PA. Field strength dependence of R1 and R2* relaxivities of human whole blood to prohance, vasovist, and deoxyhemoglobin. Magn Reson Med. 2008;60:1313–1320. doi: 10.1002/mrm.21792. [DOI] [PubMed] [Google Scholar]
- 29.Zhao JM, Clingman CS, Närväinen MJ, Kauppinen RA, van Zijl PCM. Oxygenation and hematocrit dependence of transverse relaxation rates of blood at 3T. Magn Reson Med. 2007;58:592–597. doi: 10.1002/mrm.21342. [DOI] [PubMed] [Google Scholar]
- 30.Silvennoinen MJ, Clingman CS, Golay X, Kauppinen RA, van Zijl PCM. Comparison of the dependence of blood R2 and R2* on oxygen saturation at 1.5 and 4.7 Tesla. Magn Reson Med. 2003;49:47–60. doi: 10.1002/mrm.10355. [DOI] [PubMed] [Google Scholar]
- 31.Lee SP, Silva AC, Ugurbil K, Kim SG. Diffusion-weighted spin-echo fMRI at 9.4 T: microvascular/tissue contribution to BOLD signal changes. Magn Reson Med. 1999;42:919–928. doi: 10.1002/(sici)1522-2594(199911)42:5<919::aid-mrm12>3.0.co;2-8. [DOI] [PubMed] [Google Scholar]
- 32.Rohrer M, Bauer H, Mintorovitch J, Requardt M, Weinmann H. Comparison of magnetic properties of MRI contrast media solutions at different magnetic field strengths. Investigative Radiology. 2005;40:715–724. doi: 10.1097/01.rli.0000184756.66360.d3. [DOI] [PubMed] [Google Scholar]
- 33.Rooney WD, Li X, Sammi MK, Bourdette DN, Neuwelt EA, Springer CS. Mapping human brain capillary water lifetime: High-resolution metabolic neuroimaging. NMR Biomed. 2015;28:607–623. doi: 10.1002/nbm.3294. [DOI] [PMC free article] [PubMed] [Google Scholar]
- 34.Gianolio E, Ferrauto G, Di Gregorio E, Aime S. Re-evaluation of the water exchange lifetime value across red blood cell membrane. Biochim Biophys Acta. 2016;1858:627–631. doi: 10.1016/j.bbamem.2015.12.029. [DOI] [PubMed] [Google Scholar]
Associated Data
This section collects any data citations, data availability statements, or supplementary materials included in this article.
Supplementary Materials
Supporting Table S1. Water proton transverse relaxivities (r2 and r2*) in plasma (s−1/(mmol(CR)/L(plasma))) at 1.5 and 3.0 T. Relaxivities were determined by best fittings with the linear expression R2(*) = r2(*)[CRe] + 5 s−1. Data were fit over the concentration [CRe] range from 1.6 to 28 mmol(CR)/L(plasma). Confidence intervals from the linear fittings are listed in parentheses.
Supporting Table S2. Water proton transverse relaxivities (r2 and r2*) in blood (s−1/(mmol(CR)/L(blood))) at 1.5 and 3.0 T. Relaxivities were determined by best fittings with the linear expression R2(*) = r2(*)[CRe] + 5 s−1. Data were fit over the concentration [CRb] range from 1 to 18 mmol(CR)/L(blood). Confidence intervals from the linear fittings are listed in parentheses.
Supporting Figure S1. The distributions of resonance frequencies sensed during random walks through a cell ensemble. This spectrum is for randomly oriented erythrocytes, [CRb] = 8 mM and B0 = 3T.
Supporting Figure S2. Example a) resonance frequency time-course and b) accumulated precessional phase trajectory of a single water proton during a random walk through an ensemble of randomly oriented erythrocytes; [CRb] = 8 mM and B0 = 3T. This water molecule started in extracellular space and entered, and exited, three erythrocytes (a, horizontal line segments) with different orientations. In the extracellular space, the water proton experiences rapid fluctuations centered about zero frequency shift (relative to De = χe/3; −217 Hz in this case; Eq. [5]). Thus, while extracellular, it accumulated phase much more slowly than while it was intracellular.
Supporting Figure S3. The distributions of resonance frequencies sensed during random walks through a cell ensemble. This intracellular spectrum is for erythrocytes with all ellipsoid normals perpendicular to the B0 direction, [CRb] = 8 mM and B0 = 3T. The intracellular resonance frequency is χi/3 ppm (φ = 90o, Eq. [6]; −391 Hz, here) for all intracellular water protons.
Supporting Figure S4. Semilogarithmic plots of completely sampled (continual) simulated signal intensity decays from samples with randomly oriented cells (dark curve) and completely aligned cells (light curve); kio = 100 s−1, [CRb] = 8 mM and B0 = 3T. The aligned cell simulated FID (light curve) exhibits slower decay than the experimental data (filled circles), while the randomly oriented cell simulated FID matches them quite closely.
Supporting Figure S5. The distributions of resonance frequencies sensed during random walks through an ensemble of randomly oriented cells. This spectrum was obtained when the Lorentz cavity was neglected; for [CRb] = 8 mM and B0 = 3T. Notice both intra- and extracellular distributions are shifted to lower frequency compared to the case including the Lorentz cavity (Fig. A1), but by different amounts. Thus, if the Lorentz cavity is neglected, water proton spins experience a broader range of frequencies.
Supporting Figure S6. Semilogarithmic plots of completely sampled (continual) simulated signal intensity decays with (dark curve) and without (light curve) the Lorentz cavity correction; for kio = 100 s−1, [CRb] = 8 mM and B0 = 3T. The “no Lorentz cavity” simulated FID exhibits more rapid decay than the experimental data (filled circles) and very high frequency modulations. On the other hand, the signal decay including the Lorentz cavity correction matches the experimental data (filled circles) quite well.


