

Abstract
Background
As Twitter has grown in popularity to 313 million monthly active users, researchers have increasingly been using it as a data source for tobacco-related research.
Objective
The objective of this systematic review was to assess the methodological approaches of categorically coded tobacco Twitter data and make recommendations for future studies.
Methods
Data sources included PsycINFO, Web of Science, PubMed, ABI/INFORM, Communication Source, and Tobacco Regulatory Science. Searches were limited to peer-reviewed journals and conference proceedings in English from January 2006 to July 2016. The initial search identified 274 articles using a Twitter keyword and a tobacco keyword. One coder reviewed all abstracts and identified 27 articles that met the following inclusion criteria: (1) original research, (2) focused on tobacco or a tobacco product, (3) analyzed Twitter data, and (4) coded Twitter data categorically. One coder extracted data collection and coding methods.
Results
E-cigarettes were the most common type of Twitter data analyzed, followed by specific tobacco campaigns. The most prevalent data sources were Gnip and Twitter’s Streaming application programming interface (API). The primary methods of coding were hand-coding and machine learning. The studies predominantly coded for relevance, sentiment, theme, user or account, and location of user.
Conclusions
Standards for data collection and coding should be developed to be able to more easily compare and replicate tobacco-related Twitter results. Additional recommendations include the following: sample Twitter’s databases multiple times, make a distinction between message attitude and emotional tone for sentiment, code images and URLs, and analyze user profiles. Being relatively novel and widely used among adolescents and black and Hispanic individuals, Twitter could provide a rich source of tobacco surveillance data among vulnerable populations.
Keywords: tobacco, Internet, social marketing, review
Introduction
As Twitter has grown in popularity to 313 million monthly active users [1], researchers have increasingly been using it as a data source for tobacco-related research. Twitter is a microblogging platform where users have 140 characters to share thoughts, jokes, information, images, and URLs (ie, Web addresses). Twitter posts (ie, tweets) are in real time and often public, with the potential to reach a wide audience. Users can retweet or share tweets with others, which can cause tweets to spread to large numbers of users (“go viral”). Posts can be seen when users follow each other or search for specific terms (eg, #vape). Hashtags signify a topic for users to participate in the conversation. Antitobacco campaigns may use a hashtag to start a conversation about the harms of tobacco, for example, the Truth Initiative account, @truthinitiative, promotes the use of #tobaccofreegen in the user description [2]. Similarly, the tobacco industry and independent manufacturers can use Twitter to advertise their products. Imperial Brands uses such an approach when it promotes the electronic cigarette (e-cigarette) blu through its account, @blucigs, with the hashtag #JustYouAndblu in the user description and messages to engage with Twitter users [3]. Furthermore, social media can be used to counter antitobacco campaigns. When the anti–e-cigarette campaign Still Blowing Smoke [4] was released by the State of California on television and Facebook, the pro–e-cigarette campaign Not Blowing Smoke [5], developed by pro-vaping groups, countered by taking the Twitter handles @StillBlwngSmoke [6] and @NotBlwngSmoke [7] to challenge the California campaign’s messages [8].
Tobacco-related tweets can reach a relatively young and ethnically diverse audience. Pew Research Center studies have found that, in the United States, a third of teenagers use Twitter [9], while 20% of adults have accounts with the majority being younger than 50 years [10]. Twitter is especially popular among girls aged 15 to 17 years with 49% having accounts [9]. Similarly, 45% of black, 34% of Hispanic, and 31% of white adolescents use Twitter [9]. Comparably, a larger proportion of black (28%) and Hispanic (28%) than white (20%) adult Internet users also use Twitter [10]. Therefore, tobacco conversations on Twitter, whether pro or anti, may be particularly likely to reach these populations.
Research utilizing Twitter data is fairly novel without established standards across studies. Thus, it could be advantageous to establish what methods are being used and their strengths and weaknesses. Standards for reporting social media data are needed to be able to compare methods and results across studies [11]. This review focuses specifically on the methodology of tobacco-related studies that code Twitter data categorically by examining data collection methods, coding methods, and coding categories. It addresses the questions, “What methodologies are used to categorically code tobacco-related Twitter data” and “What recommendations can be made for future studies?”
Methods
Data Sources
A literature search was conducted in July 2016 using the databases PsycINFO, Web of Science, PubMed, ABI/INFORM, Communication Source, and the journal Tobacco Regulatory Science. Searches included a Twitter term and a tobacco term: (Twitter OR tweet) AND (tobacco OR nicotine OR...) (Table 1). Tobacco terms were selected based on an article on noncigarette tobacco products [12] and the US Food and Drug Administration’s (FDA) article, Recognize Tobacco in Its Many Forms [13]. Searches were limited to peer-reviewed journals in English published from January 2006 to those available in July 2016. The beginning date was selected because Twitter was launched in 2006. The initial search produced 274 nonduplicate articles (Figure 1).
Table 1.
Tobacco search terms.
| Search terma | Tobacco products covered by search term |
| tobacco | Tobacco, smokeless tobacco, chewing tobacco, dissolvable tobacco |
| nicotine | Nicotine, electronic nicotine delivery system |
| cig* | Cigarette, cigar, little cigar, large cigar, cigarillo, electronic cigarette, e-cigarette, e-cig |
| pipe | Pipe, waterpipe |
| bidi | Bidi |
| kretek | Kretek |
| shisha | Shisha |
| hookah | Hookah, e-hookah, hookah pen |
| narghile | Narghile |
| argileh | Argileh |
| cheroot | Cheroot |
| smok* | Smoke, smokeless tobacco, smoking, smoker |
| chew | Chew, chewing tobacco |
| snuff | Snuff, dry snuff, moist snuff |
| snus | Snus |
| betel quid | Betel quid |
| gutkha | Gutkha |
| zarda | Zarda |
| toombak | Toombak |
| dissolvable | Dissolvable, dissolvable tobacco |
| ENDS | ENDS (electronic nicotine delivery system) |
| vap* | Vape, vaper, vape pen, vaping, vapor |
aAsterisk (*) represents stemmed words; for example, cig* would capture all words beginning with cig.
Figure 1.
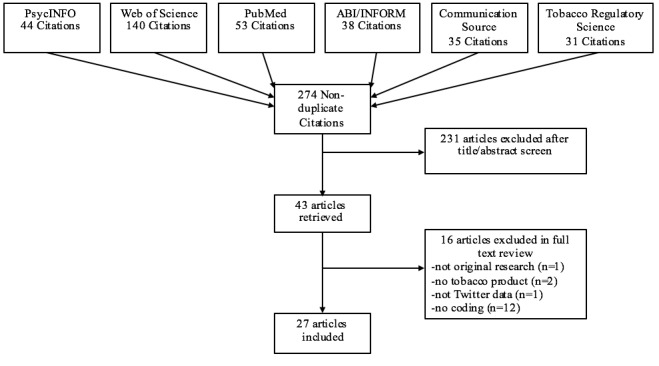
PRISMA (Preferred Reporting Items for Systematic Reviews and Meta-Analyses) diagram of articles included in the systematic review.
Study Selection
One coder independently reviewed all titles and abstracts and selected 43 articles from the initial 274 that referenced any of the tobacco products and Twitter. Full text of the articles was then reviewed. Explicit inclusion criteria were determined a priori to reduce coder bias when selecting articles. Articles were included in the review if they met the following criteria: (1) original research in a peer-reviewed journal, (2) focused on tobacco, (3) analyzed Twitter data, and (4) coded data categorically (eg, sentiment, theme). If an article was excluded for failing to meet multiple inclusion criteria, it was counted in the higher-order criteria for exclusion. A total of 16 articles were excluded, so 27 articles were included in the review (Figure 1). We excluded 1 article because it was a narrative review rather than original research, 2 articles because they did not address a tobacco product, 1 article because it analyzed Web search results and tobacco control websites rather than Twitter data, and 12 articles because they did not categorically code tobacco-related Twitter data. For example, a study may have tracked changes in the number of tweets over time but not coded the tweets categorically. The 27 included articles ranged from 2011 to 2016. Although there is risk for bias in studies, this review considered all studies that met the inclusion criteria to evaluate the strengths and weakness of all methodological approaches within this domain. The primary focus of this review is the methodology of qualitative studies rather than the outcomes of quantitative studies. Therefore, the risk of publication bias of studies with significant results and selective reporting of significant results is minimal for this type of review compared with a meta-analysis of quantitative outcomes.
Data Extraction
One author read each article to extract methodological information on data collection (data sources, date collected, tobacco topics, search keyword selection), coding methods (type of coding method, number of coders, number of tweets coded, coded retweets, number of Twitter accounts, followed URLs, coding agreement), and coded categories. This information is presented in detail in Tables 2, 3, and 4 and is summarized in the results.
Table 2.
Data collection methods.
| Article | Date collected | Type of tweets or accounts | Keyword selectiona,b | Data source | Retrieval precision | Retrieval recall |
| [8] | March 22 to June 27, 2015 | Tweets about the California Department of Public Health “Still Blowing Smoke” media campaign about the harms of e-cigarettes and the pro–e-cigarette campaign “Not Blowing Smoke” |
#stillblowingsmoke, stillblowingsmoke, “still blowing smoke”, stillblngsmoke, “still blng smoke”, #notblowingsmoke, notblowingsmoke, “not blowing smoke”, notblngsmoke, “not blng smoke”, @CAPublicHealth |
Gnip | 97.5% | NRc |
| [25] | May 1, 2013, to May 1, 2014 | E-cigarettes | vaping, vape, vaper, vapers, vapin, vaped, evape, vaporing, e-cig*, ecig*, e-pen, epen, e-juice, ejuice, e-liquid, eliquid, cloud chasing, cloudchasing, deeming AND regulation, deeming AND FDA, deemed AND FDA, deem* AND FDA | Gnip | 59.23% | NR |
| [26] | July 1, 2008, to February 28, 2013 | E-cigarettes |
55 keywords (only examples reported): general e-cigarette terms (eg, electronic cigarette, eCig), specific brand names (eg, blu, NJoy, green smoke), and terms about e-cigarette use (eg, vaping) Excluded words related to tobacco or drugs (only examples reported): marijuana, hookah |
Radian6 | 91% | 93% |
| [27] | December 5, 2011, to July 17, 2012 (15-day intervals) | Tobacco | cig*, nicotine, smok*, tobacco; hookah, shisha, waterpipe, e-juice, e-liquid, vape and vaping |
Twitter’s Streaming APId |
57.25% | 95%-99% |
| [28] | January 1 to December 31, 2014 | E-cigarettes and smoking cessation |
E-cigarette keywords: vaping, vaper, vapes, vapers, e-cigarette, e-cig, mod, eGo, mod, RBA, RDA, vape, “vape pen”, “e-hookah”, “e-pipe”, “e-shisha”, “hookah pen”, “vape pipe”, #vape #vapelife #vapor #vapeporn #vapenation #vapestars #vaperazzi #vapingstyle #vaperevolution #vapeswag #vapesirens #vaperscommunity #vapepics #vapesociety #socialvapers #vapefamily #vapefreedom #vapelove #vapers #vapstagram #vapelyfe #vapeshop #vapeon #vapestrong #girlswhovape #alldayvape #adv #vapersoul #VGOD #ecig #ecigarette Smoking cessation keywords: quit, stop, “quit smoking”, “stop smoking”, “quit cigarettes”, “smoke less”, “smoking less”, help, NRT, patch, lozenge, spray, gum, nicorette, nicotine, #quit #quitsmoking #quitsmokingcigarettes #Cessationnation Exclusion keywords: marijuana, weed, pot, dank, trees, green, cheeba, THC, cannabis, sativa, indica, bud, marihuana, MJ, “mary jane” |
Sysomos Heartbeat |
NR | NR |
| [29] | February 1 to April 30, 2014 | Blu e-cigarettes’ tweets and retweets | @blucigs | Twitter REST API | NR | NR |
| [30] | April 12 to May 10, 2014 | Hookah or shisha | hookah, #hookah, shisha, #shisha, hooka, #hooka, sheesha, #sheesha | Simply Measured |
99.56% | NR |
| [31] | November 1, 2011, to August 31, 2013 | Hookah, cigarettes, and cigars | cigar, cigars, cigarette, cigarettes, hookah, waterpipe, water pipe, shisha, sheesha | Twitter’s Streaming API |
NR | NR |
| [32] | October 4 to November 3, 2010 | Tobacco | Smoking, tobacco, cigarette, cigar, hookah, hooka | Twitter’s Search API |
NR | NR |
| [33] | May 1, 2012, to June 30, 2012 | E-cigarettes |
Keywords: e-cigarette, ecigarette, e-cig, ecig Additional keywords AND “cig” or “cigarette”: electronic, blu, njoy |
Gnip | >99% of a random sample of 500 tweets | NR |
| [34] | December 6, 2012, to June 20, 2013 | Tobacco or cessation price promotion |
Tobacco-related: cig(s), cigarette(s), smoking, tobacco, blu cigarette, njoy cigarette, ecig, e-cig, @blucig, e-cigarette, ecigarette, from:blucigs*, ecigs, e-cigs, ecigarettes, e-cigarettes, “green smoke”, “south beach smoke”, cartomizer, (atomizer OR atomizers) –perfume*, ehookah OR e-hookah, ejuice OR ejuices OR e-juice OR e-juices, eliquid OR eliquids OR e-liquid OR e-liquids, e-smoke OR e-smokes, (esmoke OR esmokes), eversmoke, “joye 510”, joye510, lavatube OR lavatubes, logicecig OR logicecigs, smartsmoker, smokestik OR smokestiks, “v2 cig” OR “v2 cigs” OR v2cig OR v2cigs, vaper OR vapers OR vaping, zerocig OR zerocigs, cartomizers, Vuse, MarkTen Price-related: Coupon(s), Promo(s), Promotions(s), Promotional, Discount(s)(ed), Save, Code(s) |
Gnip | 56.94% | NR |
| [35] | July 2014 | Slogans for the Dutch health campaign “Smoking is so outdated” (Roken kan echt niet meer) | #rokenkanechtnietmeer [#smokingissooutdated] | Twitter’s Search API |
NR | NR |
| [36] | December 2013 | Little cigars | Swisher Sweets, Black & Milds | Twitonomy | 67.50% | NR |
| [37] | September 2012 and January to May 2013 | Genetic information on smoking | genetic, smoking | NR | 49.1% | NR |
| [38] | August 2010 | Smoking cessation accounts | Searched for smoking cessation accounts using the following terms: “quit or stop smoking” or “smoking cessation” | NR | NR | NR |
| [39] | January 8-15, 2014 | Tweets about Chicago Department of Public Health’s e-cigarette Twitter campaign |
@ChiPublicHealth | twitteR package for R and NodeXL | NR | NR |
| [40] | January 2010 to January 2015 | E-cigarettes | vape, ecig, ecigarette, vaping, ejuice, vapers, drip AND tip, dripping, eliquid AND flavor, e AND juice, e AND liquid, smoke AND free, off AND cigarettes, ex AND smoker, no AND analogs, I AND quit | NR | NR | NR |
| [41] | January 2012 to December 2014 | E-cigarettes | e(-)cig, e(-)cigarette, electronic cigarette, etc | Twitter’s Streaming API | 81% to 90.8% for 4 groups of 500 randomly sampled automated tweets |
NR |
| [42] | September to December 2013 and March 2015 | E-cigarettes | Electronic-cigarette, e-cig, e-cigarette, e-juice, e-liquid, vape-juice, vape-liquid |
Twitter’s Streaming API and Twitter’s Firehose | 97.21% | 86.63% |
| [43] | April 21 to October 20, 2014 | Blu and V2 e-cigarettes’ tweets and retweets | @blucigs, @v2cigs | NR | 100% | NR |
| [44] | July 7 to 21, 2014 | Tweets about the Centers for Disease Control and Prevention’s (CDC) Tips From Former Smokers campaign |
#cdctips, CDC AND smoking | Social Network Importer for NodeXL |
81.70% | NR |
| [45] | May 1, 2013, to May 1, 2014 | E-cigarettes | vaping, vape, vaper, vapers, vapin, vaped, evape, vaporing, e-cig*, ecig*, e-pen, epen, e-juice, ejuice, e-liquid, eliquid, cloud chasing, cloudchasing, deeming AND regulation, deeming AND FDA, deemed AND FDA, deem* AND FDA | Gnip | 59.23% | NR |
| [46] | March to June 2013 | Tobacco control program tweets during the months that the national CDC Tips smoking cessation campaign aired |
Google search for tobacco control programs using the terms “ tobacco program ” and “ quitline .” If the site included a link to a Twitter account, that
account was included. |
Radian6 | NR | NR |
| [47] | March 15 to June 9, 2012 | Tweets about the CDC’s Tips campaign |
Tobacco behavior: cig(s), cigarette(s), nicotine, smoke(s), smoker, smoking, tobacco Tobacco policy: @cdcgov, @cdctobaccofree, @drfriedencdc, @fdatobacco, @smokefreegov, antitobacco, antismoking, CDC, quitline, quitnow, secondhand+smoke, smokefree, smokefree.gov, tobaccofree Ad specific: #cdctips, amputation, amputee, Buerger’s+Disease, heart+attack, hole+neck, hole+throat, lung+cancer, stoma, stroke, throat+cancer Engagement: ad, commercial, campaign, PSA |
Gnip | 78.87% | 94% |
| [48] | February 5-12, 2014 | CVS Health-related tweets surrounding the announcement of ending tobacco sales |
#cvs, #cvsquits | Twitter’s Streaming API | 72.38% | NR |
| [49] | 50 most recent tweets from July 18, 2012 | Smoking cessation accounts | Searched for smoking cessation accounts using the terms: “quit smoking” and “smoking cessation” | NR | NR | NR |
| [50] | February 23 to April 9, 2015 | Exposure to secondhand e-cigarette aerosol | “secondhand vape” OR “secondhand vaping” OR “second-hand vape” OR “second-hand vaping” OR “vape smoke” OR “ecig smoke” OR “e-cig smoke” OR “e-cigarette smoke” OR “vape shs” OR “ecig shs” OR “vape secondhand smoke” OR “vape second-hand smoke” OR “esmoke” OR “e-smoke” |
NCapture | NR | NR |
aAsterisk (*) represents stemmed words; for example, cig* would capture all words beginning with cig.
bWords in italics were not keywords used for searches.
cNR: not reported.
dAPI: application programming interface.
Table 3.
Coding methods.
| Article | Coding method | No. of coders | No. of tweets coded | Coded retweets | No. of Twitter accounts | Followed URLs | Coding agreement |
| [8] | Hand-coded by researchers | 1: all tweets; 2: subsample 300 tweets |
2248: relevance; 2192: content |
Yes | NRa | No | 91%: sentiment; 72%: theme |
| [25] | Hand-coded by researchers | 6: for a subset of 250 tweets; NR for total |
17,098: relevance; 10,128: content |
Yes, if additional context | NR | Yes | κ=.64 to .70 |
| [26] | Machine learning with initial hand-coding; Python Scikit-Learn | NR | 1,669,123 | Yes | NR | Yes | NR |
| [27] | Machine learning and hand-coding; naïve Bayes, k-nearest neighbors, and support vector machines |
2: pilot of 1000; 2: random subset of 150; 2: all 7362 |
7362: relevance; 4215: content |
Retweeted posts were only included once |
NR | NR | κ>.70 for the random subset of 150 |
| [28] | Hand-coded by researchers | 1: all tweets; 2: for 10% subsample |
300: complete sample; 300: industry-free sample; 481 of 600: content (duplicates between samples removed) |
Yes | 148: complete sample; 215: industry-free sample |
Yes | κ=.74 |
| [29] | Hand-coded by researchers | 2 | NR | Yes | Approximately 3400 | NR | NR |
| [30] | Crowdsourcing with initial hand-coding | 3 | 5000: relevance; 4978: content |
NR | 3804 | NR | κ=.66 to .85 among a subset coded by researchers |
| [31] | Topic modeling with machine learning; MALLET, a command-line implementation of latent Dirichlet allocation (LDA) |
NR | 319,315: total; 95,738: hookah; 22,513: cigar; 201,064: cigarette |
NR | NR | NR | NR |
| [32] | Topic modeling (LDA) with machine learning |
NR | 4962 | NR | NR | NR | NR |
| [33] | Machine learning and hand-coding; DiscoverText | 2: for a subset of 500 for relevance, 4500 for commercial versus organic, 7500 for cessation |
73,672 | Yes | 23,700 | Yes, hand-coded tweets with URLs | κ=.87 to .93 |
| [34] | Hand-coded by researchers | 1: all; 2: for subsets of 100 tweets |
5000: relevance; 2847: content |
NR | NR | Yes | κ=.64 to 1.00 |
| [35] | Hand-coded by researchers | 1: all tweets; 3: subsample |
133 | No | NR | NR | alpha = .61 to 1.00 |
| [36] | Hand-coded by researchers | 3 | 3935: relevance, foreign language, retweets; 2656 sampled for 288 original tweets for coding |
No | 346 | Yes | κ=.64 to .91 |
| [37] | Hand-coded by researchers; wordcloud R package | NR | 171: relevance; 84: content |
NR | 84 | NR | NR |
| [38] | Hand-coded by researchers | 1: all tweets; 2: for 20% of tweets |
143,287: identified; 4753: coded for clinical practice guidelines for treating tobacco dependence |
NR | 153 | Yes | >90% |
| [39] | Hand-coded by researchers | 2 | 684 | Yes | 306 | Yes | NR |
| [40] | Machine learning and hand-coding; naïve Bayes, LIBLINEAR, Bayesian logistic regression, random forests; keyword comparisons |
1: all tweets; 2: subsample of 2000 |
13,146 | NR | 2147 | No, removed URLs | κ=.87 for subsample |
| [41] | Machine learning and hand-coding; human detection algorithm; Hedonometrics; key phrasal pattern matching |
2: for all tweets from 500 automated accounts and 500 organic accounts as classified by the algorithm; 2: for 4 groups of 500 randomly sampled tweets to gauge accuracy of subcategorical tweet topics |
850,000 | Yes | 131,622: automated accounts; 134717: organic accounts: 188,182: not classified accounts (ie, accounts with <25 tweets) |
No, but the algorithm used the count of URLs to distinguish automated accounts from organic accounts; also used keywords in the URLs for the algorithm to determine subcategories of automated accounts |
94.6% true- positive rate, 12.9% false- positive rate for the machines on the tweets from the 1000 accounts also coded with human-coding |
| [42] | Machine learning with initial hand-coding; Python Scikit-Learn; topic modeling with MALLET |
2: for a subset of 1000 profiles | 224,000 in 2013 sample; 349,401 in 2015 sample |
Yes | 34,000 in 2013 sample; 100,000 in 2015 sample |
No; metadata on the presence of URL links | κ=.88 |
| [43] | Hand-coded by researchers and MySQL pattern matcher | NR | 1180 | Yes | 2: Blu and V2; 537: users retweeting Blu and V2 |
NR | NR |
| [44] | Hand-coded by researchers | 1: all tweets; 2: for 20% of tweets (n=358) |
2191: relevance; 1790: content |
Yes | NR (>21) | NR | κ=.95 for 20% subsample |
| [45] | Machine learning with initial hand-coding; naïve Bayes classifier, k-nearest neighbors, support vector machines |
6: for a subset of 250 tweets; NR for total |
17,098: relevance; 10,128: content |
Yes, if additional context | NR | NR | κ=.64 to .70 |
| [46] | Hand-coded by researchers | 3 | 1776 | No | 16 | Yes | For 5% of data, 95.7%; κ=.72 |
| [47] | Machine learning with initial hand-coding; naïve Bayes classifier | 2: subset of 450 tweets for relevance; 2: subset of 350 tweets for content |
245,319: relevance; 193,491: content |
NR | 166,857 | NR; metadata on the presence of URL links | κ=.93 |
| [48] | Hand-coded by researchers | 1: all tweets; 2: for 1% of tweets |
8645: relevance; 6257: content |
Yes | NR | Yes | 90% for a 1% sample of tweets |
| [49] | Hand-coded by researchers | 2 | 900, with 50 tweets per account | Yes | 18 | NR | 84% |
| [50] | Hand-coded by researchers | 2 | 1519 | No | 1321 | Yes | κ=.84 |
aNR: not reported.
Table 4.
Coded categories.
| Category type | Category | Number of articles and percent of totala
n (%) |
Articles | |
| Relevance | Relevant versus nonrelevant | 16 (59) | [8,25,27,30,33,34,36,37,41-45,47-49] | |
| Sentiment |
|
9 (33) | [8,25,27,28,35,41,45,48,50] | |
|
|
Positive or negative (ie, supportive or against) | 6 (22) | [8,25,27,45,48,50] | |
|
|
Positive or negative (ie, emotional tone) | 2 (7) | [28,41] | |
|
|
Positive or negative valence | 1 (4) | [35] | |
|
|
Neutral or unknown | 6 (22) | [8,27,28,45,48,50] | |
| Message attitude | Pro or con | 1 (4) | [28] | |
| Type of utterance | Comparison versus attribution versus metonymy | 1 (4) | [35] | |
| Topics, themes, or genres |
|
21 (78) | [8,25-28,30,33,34,36-43,45-47,49,50] | |
|
|
Joke or humorous | 3 (11) | [27,28,36] | |
|
|
Song or music | 2 (7) | [30,36] | |
|
|
Profanity | 1 (4) | [36] | |
|
|
Social relationships | 2 (7) | [27,50] | |
|
|
Sex or romance | 1 (4) | [30] | |
|
|
Image or stereotype | 1 (4) | [27] | |
|
|
Risky behaviors or other substances | 6 (22) | [25,27,28,30,36,45] | |
|
|
Illicit substance use in e-cigarettes | 2 (7) | [25,45] | |
|
|
Preference for another substance | 1 (4) | [30] | |
|
|
Affiliation and preference | 1 (4) | [36] | |
|
|
Flavors | 7 (26) | [25,36,39,41-43,45] | |
|
|
Pleasure | 1 (4) | [27] | |
|
|
Tastes good | 1 (4) | [28] | |
|
|
Craving, desire, and need | 5 (19) | [25,27,28,36,45] | |
|
|
Addiction | 1 (4) | [37] | |
|
|
Type of tobacco product | 4 (15) | [27,30,34,38] | |
|
|
Type of tobacco product brand | 1 (4) | [26] | |
|
|
E-cigarettes’ smoke-free aspect | 1 (4) | [42] | |
|
|
Health, safety, harms | 9 (33) | [8,25,27,30,33,37,39,45,50] | |
|
|
Downplayed or refuted harms, harm reduction | 2 (7) | [27,42] | |
|
|
E-cigarettes for smoking cessation | 7 (26) | [25,28,33,40-42,45] | |
|
|
Cessation | 5 (19) | [27,30,37,41,46] | |
|
|
Cessation product | 2 (7) | [34,38] | |
|
|
Socioemotional support tweets regarding quitting smoking | 1 (4) | [49] | |
|
|
Encouraging or engaging tweets regarding quitting smoking | 1 (4) | [49] | |
|
|
Clinical practice guidelines for treating tobacco dependence | 1 (4) | [38] | |
|
|
Demonstration | 1 (4) | [36] | |
|
|
Use | 8 (30) | [25,27,28,30,36,37,40,45] | |
|
|
|
Use: general | 2 (7) | [36,40] |
|
|
|
First-person use or intent | 5 (19) | [25,27,28,30,45] |
|
|
|
Second- or third-person experience | 4 (15) | [25,27,28,45] |
|
|
|
Starting use or smoking initiation | 3 (11) | [27,28,37] |
|
|
|
Recent use | 1 (4) | [30] |
|
|
|
Underage use | 3 (11) | [25,27,45] |
|
|
|
Parental use | 2 (7) | [25,45] |
|
|
|
Does not use or does not want to use | 1 (4) | [30] |
|
|
Secondhand smoke | 1 (4) | [46] | |
|
|
Rejection and prevention | 1 (4) | [36] | |
|
|
Disgust, unattractive, or uncool | 2 (7) | [27,30] | |
|
|
Policy, government, regulation, activism, politics | 7 (26) | [8,25,27,28,39,45,46] | |
|
|
Normalization versus discouragement | 1 (4) | [30] | |
|
|
Getting others started or advocating use | 1 (4) | [28] | |
|
|
Attempt to engage other Twitter users | 1 (4) | [28] | |
|
|
Fear appeals | 1 (4) | [47] | |
|
|
Lies or propaganda | 2 (7) | [8,39] | |
|
|
Advertisement, promotion, marketing, industry, commercial | 12 (44) | [8,25-28,30,33,36,38,41,45,50] | |
|
|
Offering advice | 1 (4) | [28] | |
|
|
Personal opinion or communication | 6 (22) | [25,27,28,33,38,45] | |
|
|
News or update | 4 (15) | [25,27,28,45] | |
|
|
Information | 5 (19) | [25,27,28,45,49] | |
|
|
Science or scientific publication | 2 (7) | [37,39] | |
|
|
Cultural reference | 1 (4) | [27] | |
|
|
Issue salience | 1 (4) | [39] | |
|
|
Commodity | 1 (4) | [27] | |
|
|
Connoisseurship | 1 (4) | [27] | |
|
|
Cheaper than smoking | 1 (4) | [28] | |
|
|
Money | 1 (4) | [8] | |
|
|
Price promotion, discount, coupon | 4 (15) | [26,33,34,41] | |
|
|
Backgrounded | 1 (4) | [27] | |
|
|
Other or undetermined | 2 (7) | [36,50] | |
| Domains smoking was compared with for campaign slogans |
Personal features; hobby or hype; person or group; social norm; big event; technology and innovation; sex or relation; eating, drinking, and stimulants; school; transport; and campaign | 1 (4) | [35] | |
| Links (URLs) | Most common links | 1 (4) | [26] | |
| Location of use |
|
1 (4) | [26] | |
|
|
Class | 1 (4) | [26] | |
|
|
House, room, bed | 1 (4) | [26] | |
|
|
School | 1 (4) | [26] | |
|
|
Public | 1 (4) | [26] | |
|
|
Bathroom | 1 (4) | [26] | |
|
|
Work | 1 (4) | [26] | |
|
|
In front of someone | 1 (4) | [26] | |
|
|
Car | 1 (4) | [26] | |
|
|
Restaurant | 1 (4) | [26] | |
|
|
Movie theater | 1 (4) | [26] | |
|
|
Airplanes or airport | 1 (4) | [26] | |
|
|
Store | 1 (4) | [26] | |
|
|
Bars or clubs | 1 (4) | [26] | |
|
|
Dormitory | 1 (4) | [26] | |
|
|
Library | 1 (4) | [26] | |
|
|
Mall | 1 (4) | [26] | |
|
|
Bowling alley | 1 (4) | [26] | |
|
|
Café or coffee shop | 1 (4) | [26] | |
|
|
Hospital | 1 (4) | [26] | |
|
|
Locker room | 1 (4) | [26] | |
| Topic modeling |
|
2 (7) | [31,32] | |
|
|
Hookah topic 1: social locations, leisure time, and positive affect | 1 (4) | [31] | |
|
|
Hookah topic 2: fun, leisure time, and sociability | 1 (4) | [31] | |
|
|
Cigarette topic 1: death and unpleasant smell | 1 (4) | [31] | |
|
|
Cigar topic 1: positive affect and enjoyment | 1 (4) | [31] | |
|
|
Cigar topic 2: luxury alcohol products | 1 (4) | [31] | |
|
|
Tobacco topic 1: tobacco use and substance use | 1 (4) | [32] | |
|
|
Tobacco topic 2: addiction recovery | 1 (4) | [32] | |
|
|
Tobacco topic 3: addiction recovery and tobacco promotion by clubs or bars | 1 (4) | [32] | |
|
|
Tobacco topic 4: tobacco promotion by bars or clubs and marijuana use |
1 (4) | [32] | |
|
|
Tobacco topic 5: antismoking and addiction recovery | 1 (4) | [32] | |
| User or account |
|
10 (37) | [8,25,28,29,34,37,41,44,45,49] | |
|
|
Government | 3 (11) | [25,44,45] | |
|
|
Foundations or nonprofit organizations | 4 (15) | [25,44,45,49] | |
|
|
Public health and health care | 1 (4) | [28] | |
|
|
Researcher or research center | 2 (7) | [29,37] | |
|
|
News | 5 (19) | [25,28,37,44,45] | |
|
|
|
Reputable news source | 2 (7) | [25,45] |
|
|
|
Press, media, or news | 3 (11) | [28,37,44] |
|
|
|
Medical news source | 1 (4) | [37] |
|
|
Personal accounts | 7 (26) | [8,25,28,29,37,44,45] | |
|
|
|
Personal accounts, everyday people, individuals | 6 (22) | [8,25,28,37,44,45] |
|
|
|
Personal accounts with industry ties | 1 (4) | [28] |
|
|
|
Person: supporter | 1 (4) | [29] |
|
|
|
Person: basic profile (no mention of e-cigarettes) | 1 (4) | [29] |
|
|
Celebrity, public figures | 3 (11) | [25,28,45] | |
|
|
Organic (human) | 1 (4) | [41] | |
|
|
E-cigarette community movement | 2 (7) | [25,45] | |
|
|
Industry | 5 (19) | [25,28,29,34,45] | |
|
|
|
Industry: retailer or manufacturer | 2 (7) | [28,29] |
|
|
|
Retailer or vendor | 3 (11) | [25,34,45] |
|
|
|
Tobacco company | 2 (7) | [25,45] |
|
|
|
Industry: other (eg, vaping magazine, Web marketer) | 1 (4) | [29] |
|
|
For-profit organization | 1 (4) | [44] | |
|
|
Entity: general (eg, company, store, advocacy group) | 1 (4) | [8] | |
|
|
Nonperson (eg, musical band) | 1 (4) | [29] | |
|
|
Bots, automatic, fake | 4 (15) | [25,28,38,41,45] | |
|
|
Unclassified or other | 5 (19) | [8,29,37,44,49] | |
| Profile photo |
|
1 (4) | [36] | |
|
|
Single person versus multiple people | 1 (4) | [36] | |
|
|
Gender (male, female, mixed group) | 1 (4) | [36] | |
|
|
Age (babies or children, high school or college, adult) | 1 (4) | [36] | |
|
|
Race (African American, white, Hispanic, Asian, undetermined) | 1 (4) | [36] | |
| Location of user |
|
4 (15) | [8,37-39] | |
|
|
City, state, and country | 1 (4) | [39] | |
|
|
State | 1 (4) | [8] | |
|
|
Country | 1 (4) | [37] | |
|
|
Continent | 1 (4) | [38] | |
aPercentages are rounded to the nearest whole percent.
Results
Data Collection Methods
Data Sources
In total, 22 of the 27 articles discussed the sources they used for their sample of Twitter messages, while 5 articles did not. Twitter provides 3 primary sources of data: Twitter’s Search application programming interface (API), Twitter’s Streaming API, and Twitter’s Firehose. An additional method is Twitter’s REST API, which allows tracking specific users by their username. One study collected data using Twitter’s REST API.
Twitter’s Search API is free to use and provides a maximum of 3200 past tweets (ie, published in the past 7 days, so it is not in real time) with a limit of 180 searches every 15 minutes [14,15]. Twitter’s Search API was used in 2 studies (Table 2). There are programs developed to interact between Twitter’s Search API and specific analyses programs. For example, twitteR package for R [16], NCapture for NVivo [17], and Social Network Importer for NodeXL, the free add-on for Excel [18], provide access to Twitter’s Search API. A small subset of the studies used these programs: twitteR package for R (n=1), NCapture (n=1), and Social Network Importer for NodeXL (n=1).
More useful to researchers is Twitter’s Streaming API, which provides all tweets related to the search terms up to a limit of 1% of the Twitter database for that time period. If the selected search terms are infrequently used across Twitter (eg, the name of a local tobacco campaign), all tweets related to the search terms will be available. However, if the selected search terms are commonly used, tweets related to those terms will be available up to a limit of 1% of the current Twitter database. Twitter’s Streaming API is free, publicly available data [19]. A total of 5 studies used Twitter’s Streaming API (Table 2). Twitonomy is an analytics tool that accesses Twitter’s Streaming API and offers both free and premium packages for a small fee [20]. One article used Twitonomy.
Providing the greatest access to data, Twitter’s Firehose has real-time access to 100% of Twitter content. Twitter’s Firehose formerly was handled by multiple data providers (eg, Gnip, DataSift, and Topsy). After the acquisition of Gnip in 2014, Twitter transitioned to only allowing access to Twitter’s Firehose through Gnip for a fee from August 2015 onward [21]. A total of 6 articles used Gnip, making it the most common method to collect data (Table 2). There are social listening programs that buy Twitter data from data providers such as Gnip. Radian6 [22], Simply Measured [23], and Sysomos Heartbeat [24] collect data from across social networking sites, blogs, forums, and news sites for a fee. A few articles used these social listening programs to collect data: Radian6 (n=2), Simply Measured (n=1), and Sysomos Heartbeat (n=1).
Date Collected
Twitter data were collected across the studies from 2008 to 2015. The time span of Twitter data collected within an individual study ranged from 1 day to 5 years with a median of 14 weeks (Table 2).
Tobacco Topics
Among the 27 studies, 41% (n=11) analyzed messages related to e-cigarettes, 19% (n=5) related to other tobacco products, and 22% (n=6) about specific tobacco campaigns (Table 2). The remaining topics included smoking cessation accounts (n=2), tobacco or cessation price promotion (n=1), genetic information on smoking (n=1), and ending tobacco sales at CVS Health (n=1).
Search Keyword Selection
Kim and colleagues [11] proposed a framework of three steps to develop and validate search filters. This framework was selected because it provided a standard in which to compare studies. Most of the articles partially fulfilled these steps within the framework. The first step is to develop a search filter. All the articles generated a list of keywords presumably based on expert knowledge of the topic or a systematic search of language related to the topic of interest. However, only 4 articles discussed the process of discarding keywords that returned a high proportion of irrelevant results and adding new keywords as new terms appeared in the returned literature [25-28]. It should be noted that for some studies this process of developing a search filter may be irrelevant because they are coding all tweets from a specific account (eg, coding tweets from the blu e-cigarette account, @blucigs) [29].
Search keyword selection was tailored to the studies’ specific topics (Table 2). To search for e-cigarette Twitter data, variations on e-cigarette (eg, e-cig), vape (eg, vaping), e-liquid (eg, eliquid), and e-juice (eg, ejuice) were common. Some e-cigarette studies also included major e-cigarette companies or brands as key search terms (eg, Njoy). Studies that analyzed Twitter data on specific tobacco campaigns used a variety of tactics such as searching for variations on the campaign name (eg, still blowing smoke), the source of the campaign (eg, CDC), specific features of the campaign ads (eg, lung+cancer), tobacco products and behavior (eg, smoke), and general campaign terms (eg, PSA). Some studies also used a combination of searching for terms with and without hashtags (eg, hookah, #hookah). In 2 studies, marijuana terms (eg, weed) were used as exclusion keywords [26,28].
The second step of the framework is to apply the search filter and split data into retrieved and unretrieved sets. The third step is to assess the search filter on its ability to distinguish between relevant and irrelevant messages [11]. Precision refers to how much retrieved data are relevant, whereas recall refers to how much relevant data are retrieved. Recall is similar to measures of sensitivity. Precision is much less difficult to accurately estimate than recall because recall requires conclusions to be drawn about the tweets that were not retrieved. A precision score of 100% means that all retrieved data were relevant, while a recall score of 100% means that all relevant data were retrieved. However, precision and recall are inversely related. As a search filter expands to collect more data, the proportion of relevant data decreases. Publications can present a precision-recall curve to show the extent of this trade-off for their search filter. A good search filter will maintain a relatively high level of precision as recall increases. A total of 15 articles reported precision, which ranged from 49.1% to 100% (Table 2). A total of 4 articles reported recall, which ranged from 86.6% to 99% (Table 2).
Coding Methods
Coding methods for the studies included hand-coding, machine learning, or a combination of the two. Hand-coding involves one or more human coders categorizing data. When 2 or more coders independently code data, a coding agreement score (eg, kappa) between the coders can be calculated. In contrast, machine learning uses an algorithm for a computer to learn how to code data. However, human-coding is used for an initial subset of data to help refine the algorithm to improve its accuracy. Coding categories may be determined a priori based on prior research or they may be developed inductively through the process of coding. Studies used hand-coding only (n=17), machine learning + hand-coding (n=8), and machine learning only (n=2; Table 3). Of the studies using hand-coding, data were coded by the reviewed studies’ researchers in 16 studies, while 1 study used crowdsourcing (ie, many Web workers) [30]. All the studies that used machine learning also used initial hand-coding for a subset of the data, except for 2 studies that used topic modeling [31,32]. Topic modeling produces thematically related word clusters from the text [31].
The data collected in the hand-coded studies ranged from a collection period of 1 day to 1 year, while the machine learning studies ranged from 1 month to 5 years of Twitter data. Across the articles that used hand-coding, the number of coders per tweet ranged from 1 to 6. Coding agreement was reported by 20 articles: coding agreement percentage (n=5; 72% to 95.7%), kappa scores (n=13; kappa=.64 to 1.00), Cronbach alpha (n=1; alpha=.61 to 1.00), and both coding agreement percentage and kappa scores (n=1). Kappa values can be interpreted as poor (<.20), fair (.21-.40), moderate (.41-.60), good (.61-.80), and very good (.81-1.00) [51]. Cronbach alpha can be interpreted as unacceptable (<.50), poor (.50-.59), questionable (.60-.69), acceptable (.70-.79), good, (.80-.89), and excellent (>.90) [52]. However, it is important to note that these thresholds are not derived statistically but instead rely on intuitive judgments. The number of tweets coded per study ranged from 171 to 17,098 for hand-coding and from 7362 to 1,669,123 for machine learning. A total of 14 articles included retweets in their total number of tweets. A total of 15 articles reported the number of unique Twitter accounts, which ranged from 2 to 3804 for hand-coding studies and from 23,700 to 166,857 for machine learning studies (see Table 3).
URLs in tweets can provide information that changes the context or meaning of a tweet. Following URLs to their respective webpages can be time-consuming, but it can increase coding accuracy. Machine learning algorithms can analyze the text within URLs but may require human coders to follow them to their respective webpages. A total of 15 articles reported whether they followed URLs (followed: n=10, did not follow: n=5; Table 3). One article provided the most common URLs [26]. The studies tended to show that advertising or commercial tweets were significantly more likely to contain URLs than other types of tweets [25,33,34].
Coded Categories
All the studies developed categories for content. These content areas included one or more of the following: sentiment, theme, location of use, user description, profile photo, or location of user (Table 4).
Sentiment
A total of 9 articles coded for sentiment (Table 4). One article made a distinction between coding for sentiment (ie, emotional tone or affective content: positive, negative, or neutral) and message attitude (ie, pro, con, neutral or do not know) [28]. Two articles coded for sentiment in terms of emotional tone. In 6 articles, sentiment was described in terms of being supportive or against tobacco, tobacco users, or decisions regarding tobacco, which suggests an assessment of message attitude. Furthermore, 1 article assessed valence, but it was not clear whether positive or negative valence suggested an attitude or emotional tone [35].
Topic or Theme
A total of 21 studies coded for topic or theme (Table 4). The most common themes included the following: advertisement, marketing, industry or commercial (n=12 articles); health, safety, harms (n=9); use (n=8); policy, government, regulation, activism (n=7); e-cigarettes for smoking cessation (n=7); flavors (n=7); personal opinion or communication (n=6); risky behaviors or other substances (n=6); cessation (n=5); information (n=5), and craving or need (n=5). One study coded for location of use with 20 categories (eg, school, work) [26]. Finally, 2 studies used topic modeling to explore tobacco content [31,32].
User or Account
A total of 10 studies coded for user description from data found in the user profile, including type of account, age, location, and other characteristics (Table 4). The most common types of user categories coded were personal accounts (n=7 articles), industry accounts (n=5), news (n=5), unclassified (n=5), and bots, automatic, or fake (n=4; ie, automated computer program). None of the articles reported the percentage of tweets that had accounts without user profile information. However, across the articles with a category for tweets with an unclassifiable user description, 0.2%-38% of tweets were unclassified. Across the studies that coded for bots, the percentages of tweets varied drastically from 6.9% to 80.7%.
One study coded Twitter profile photos with 4 categories: gender, age, race, and single person versus multiple people [36]. Visual cues (eg, skin color, background themes, facial features) in the profile pictures were used for coding. Coding for age based on available visual cues in the profile photos tended to be difficult, so coding for age was simplified to 3 broad groups: young, middle age, and older adult. There were few middle-aged and older adults represented in the sample, so a dichotomous variable of young or not young was created [36].
A total of 4 studies coded for the location of the user with one each coding for state (California vs other) [8], country [37], continent [38], and city, state, and country (United States vs other) [39]. Location was identified for 51% to 63% of Twitter profiles. Most accounts that listed a location were from the United States and North America.
Discussion
Overview
Studies analyzing tobacco-related Twitter data have grown in number in recent years. Although we searched for articles published from 2006 to 2016, articles meeting inclusion criteria for this review were published from 2011 to 2016, with 85% (23/27) of the publications occurring in 2014-2016. Widely used among adolescents and black and Hispanic individuals, Twitter could provide a rich source of tobacco-related data among these groups. One of the benefits of Twitter research is the ability to focus on emerging issues and products that are not yet addressed in surveillance or epidemiological research. Collecting tobacco data in real time via Twitter could be a useful tool for tobacco surveillance, which could help inform tobacco control policies and social media campaigns.
Data Collection Methods
Twitter data can change rapidly as they are being posted daily [37]. If a study only collects data from one point in time, it may not be reflective of data at any other point in time. Twitter studies should consider collecting data at multiple time points or over longer periods of time to decrease the likelihood that results are idiosyncratic to that point in time. However, there may be some research questions that only require sampling one time or sampling directly before and after an event to gauge short-term responses.
The primary sources of data were Gnip and Twitter’s Streaming API, which offer different strengths and weaknesses. If a study wants access to all tobacco-related tweets, then Gnip may be more effective. However, if a study is interested in tweets about a specific tobacco campaign or has a constrained budget, then Twitter’s Streaming API may be a better data source. Alternatively, if a study is focusing on multiple social media sites (eg, Twitter, Facebook), then using Radian6, Simply Measured, or Sysomos Heartbeat may be appealing because of their cross-platform analysis.
The results of this review suggest that there are some gaps in the types of tobacco products studied by Twitter analyses. E-cigarettes were the product that was addressed by most studies, while none of the studies focused on smokeless tobacco, snus, bidis, or kreteks. The focus on e-cigarettes over other products could be due in part to their recent rise in popularity and recent debates about policies. From 2011 to 2014, e-cigarette use among high school students in the United States significantly increased from 1.5% to 13.4% [53]. Similarly, there was a significant increase in hookah use from 4.1% to 9.4%. However, there were significant decreases for cigarette (15.8% to 9.2%), snus (2.9% to 1.9%), cigar (11.6% to 8.2%), pipe (4.0% to 1.5%), and bidi (2.0% to 0.9%) use [53]. It could be useful to conduct studies comparing tweets about cigarettes, e-cigarettes, and hookah among adolescents to help understand the changing rates of use and Twitter postings that discuss issues related to use. The rates of e-cigarette, hookah, and cigar use among high school students may be affected by the FDA regulations of these products that went into effect on August 8, 2016. One of the provisions of these regulations is that it will be illegal to sell e-cigarettes, cigars, and hookah tobacco to persons younger than 18 years [54]. Researchers may want to analyze e-cigarette, cigar, and hookah tweets before and after August 8, 2016, to gain real-time insight into adolescents’ reactions to the new regulations.
Future Twitter studies could benefit from a standard of reporting data collection methods. Only 4 of the articles in this review reported such rigorous methods of selecting their search keywords as suggested by Kim and colleagues’ [11] search filter framework, while 15 articles reported retrieval precision and 4 reported retrieval recall. The terminology around newer products such as e-cigarettes is growing, so it may be difficult to capture all relevant Twitter conversations with one’s keywords [25]. Future studies will need to continue to refine and expand search keywords.
Data Coding
The methods of coding were hand-coding, machine learning, or a combination of the two. Machine learning can code larger quantities of data at a quicker rate than hand-coding, but human coders may have greater discretion at coding for the complexities and subtlety of language such as humor, irony, or sarcasm. For example, algorithms developed to detect irony only retrieved 54%-57% of tweets coded as irony by multiple independent human coders [55]. Hand-coding can be subject to bias, but creating coding schemes based on prior literature and working to achieve acceptable levels of interrater reliability can help attenuate individual bias. Hand-coding allows researchers to follow URLs, which can change the meaning of the tweet. Viewing the webpage may provide additional information that may not be discernable from the URL. Studies that require determining subtle differences in context may be better suited to hand-coding a small sample of Twitter data, while studies that rely less on context could code large samples with machine learning.
Coded Categories
The sentiment of tweets could help evaluate whether the responses to pro- and antitobacco efforts are positive or negative as a way of understanding social norms about these products. Clarity and comparability across studies could be improved if a distinction is made between attitude and emotion when coding for sentiment. For example, a tweet could be pro-vaping but have a negative emotional tone or it could be anti-vaping but have a positive tone. Only 1 article clarified the meaning by making an explicit distinction between coding for emotional sentiment and message attitude [28]. This is reflective of coding for stance (in favor of, against, or neutral) versus sentiment (emotional tone) [56].
The three most common themes used for coding were advertisements or marketing; health, safety, harms; and use. Surveillance of these themes could be beneficial to understand whether tobacco advertisements are being circulated on Twitter with the potential of reaching underage individuals, whether the content is making unproven claims about the health and safety of their products, or promoting the use of their products to vulnerable populations such as youth or ethnic minorities.
The most common user account descriptions that the studies coded for were personal accounts, industry, news, unclassified, and bots. Determining the user description and demographic information for the accounts that tweet about tobacco could help determine whether tobacco companies, pro-vaping advocacy groups, or antitobacco efforts are circulating with a potential to reach certain groups (eg, adolescents). Researchers could also monitor how news organizations are presenting tobacco-related information to the public.
It may be difficult to determine the demographics of the person tweeting or of the audience exposed to the tweets, which could be especially problematic when studies want to focus on vulnerable populations (eg, adolescents). A Twitter account could be run by an individual, multiple people (eg, vape shop employees), or bots. To reduce bias, bots should be identified and the tweets from these accounts removed from analysis or identified as tweets originating from automated accounts [57]. Only 4 studies coded for bots with a range from 6.9% to 80.7% of tweets classified as bots. Even if an account is run by an individual, a Twitter profile provides little information. It may or may not include a photograph, profile description, location, website, and birthday. It does not include gender or ethnicity and race, so this information needs to be estimated. Although none of the studies reported the percentage of tweets with accounts missing profile information, 5 studies coded for an unclassified category with 0.2%-38% of tweets being unable to be classified based on the account profile. If profile information is included, it could be used in combination with natural language processing to infer information about the individual from his or her tweets [29]. For example, algorithms have estimated gender with a 75.5% accuracy based on tweets and a 92.0% accuracy based on tweets, screen name, full name, and profile description [58]. A study that combined analysis of text and image processing predicted gender with an accuracy of 85.1% [59]. Additionally, algorithms based on tweets were capable of predicting the exact age of the user within a margin of 4 years, while accuracy for age categories were 93.0% for <20 years, 67.4% for 20-40 years, and 81.6 for >40 years [60].
Recommendations
It is recommended that tobacco Twitter studies adopt methodological standards of reporting and data quality assessment. Important information to consider reporting include data sources (eg, Gnip, Twitter’s Streaming API), the date range of tweets collected, the number of tweets coded, whether retweets were coded, whether coders followed URLs, whether images were coded, the categories coded, the decision criteria for each category, the number of unique Twitter accounts, and the types of Twitter accounts. Studies that use hand-coding should also consider reporting the number of independent coders, the number of tweets coded across coders, and their coding agreement, while it is important for machine learning studies to detail the development and refinement of their algorithms. Providing this information is likely to increase comparability across studies and the ability to replicate results.
Depending on research goals, studies may want to sample Twitter’s databases multiple times, especially if they collect from Twitter’s Search API or Streaming API, which put limitations on the amount of data that can be collected per sample. Sampling at multiple times is also important for studies that have access to Twitter’s Firehose through Gnip, considering that tweets are in real time, which could lead to fluctuations based on real-world events (eg, the FDA’s new regulations for e-cigarettes). Following messages over time could also help establish trends in the content of posts. However, some studies may be interested in short-term reactions to an event, which requires different sampling methods than following trends. For example, if a study is interested in short-term reactions to the FDA’s new regulations for e-cigarettes, then a single sample before and after the implementation of the new regulations could be sufficient.
When coding for sentiment, researchers could improve clarity by making a distinction between whether they are coding for message attitude or for emotional tone [28]. A clear distinction between the two could improve comparability of sentiment ratings across studies.
If relevant to the research questions, Twitter studies may want to code images and URLs. This added step can be time-consuming, but doing so could change the context or meaning of a tweet. For example, an image could help determine if a tweet should be coded as humor or sarcasm, while following a URL could help determine if the tweet is an advertisement. Failing to code images and URLs could result in missing significant content that could affect coding accuracy and skew results.
Analyzing Twitter user profiles could provide context for tweets. The same pro–e-cigarette tweet could hold very different significance for a study’s results if it is from a vape shop versus an adolescent. However, the limitations of analyzing user profiles should be recognized and steps taken to improve accuracy. It should be noted that user profiles may be misleading (eg, a tobacco industry representative posing as an unaffiliated citizen) or profiles of bots. Bots should be identified and potentially removed to reduce bias and improve the quality of data [57]. We cannot assume that the analysis is describing individuals but must instead consider the poster to be an “account” rather than a person.
A limitation of Twitter data is that it does not provide much information on the effects of tweets on behavior. For example, tweeting about tobacco use does not necessarily mean that the person tweeting uses tobacco [40]. Additionally, an individual may tweet about a quit smoking campaign with positive sentiment, but that does not mean that the campaign has influenced his or her smoking behavior. Follow-up studies with the individuals tweeting about the campaign would need to be conducted. None of the studies in the review included follow-up survey studies with individuals from their Twitter sample. Although recruitment of individuals through Twitter may come with its own set of obstacles, this could be an avenue for future Twitter research. Following specific individuals over time could allow for the analysis of changes in message content.
Review Limitations
There are several limitations of this systematic review. First, the results are limited to the databases and search keywords selected, which could have resulted in incomplete retrieval of identified research. Second, this review is limited to its inclusion criteria and the decision rules of the single, independent coder who selected the articles and extracted the data to be included in the review. Individual bias was limited by explicit inclusion, exclusion, and data extraction criteria. However, some studies that were included or excluded for this review may have varied given different inclusion criteria or a different coder. Finally, this review is limited to methodology of categorically coded tobacco Twitter data. Different methodological results and recommendations may have been made if the topic of Twitter data had been different (eg, marijuana) or if the review had focused on different outcomes (eg, popularity of tweets or diffusion of tweets).
Conclusions
Categorically coded Twitter research can be used for certain insights that other survey research does not provide: emerging issues, popular content in real time, changes over time, how tobacco companies and pro-vaping advocacy groups use social media to increase message exposure in the population (eg, youth who might otherwise be protected from tobacco marketing), how tobacco control policies and campaigns can most effectively use social media, arguments by groups that may be incorporated into media message design, and quick reactions to antitobacco media campaigns and regulations. There are several approaches that researchers are taking to this end, each having its own set of strengths and weaknesses. Standards for data collection and coding should be developed to more easily compare and replicate tobacco-related Twitter results. Additional recommendations, dependent on one’s research goals, include the following: sample Twitter’s databases multiple times, make a distinction between message attitude and emotional tone for sentiment, code images and URLs, analyze user profiles, and identify and remove bots.
Acknowledgments
This work was supported by the National Cancer Institute grant number T32CA009492-29 and the USC (University of Southern California) Tobacco Center of Regulatory Science for Vulnerable Populations grant number 3P50CA180905-04S1.
Abbreviations
- API
application programming interface
- FDA
US Food and Drug Administration
Footnotes
Authors' Contributions: BAL planned the review, conducted the literature search, synthesized the results, and wrote the manuscript. JBU, TBC, and KC assisted in the conceptualization of the review and edited the manuscript.
Conflicts of Interest: None declared.
References
- 1.Twitter. 2016. Jun 30, [2016-11-17]. Twitter Usage/Company Facts https://about.twitter.com/company .
- 2.Twitter. 2016. [2016-11-17]. Truth Initiative Twitter account https://twitter.com/truthinitiative .
- 3.Twitter. 2016. [2016-11-17]. Blu Twitter account https://twitter.com/blucigs .
- 4.Still Blowing Smoke. 2016. [2016-11-17]. http://stillblowingsmoke.org/
- 5.Not Blowing Smoke. 2016. [2016-11-17]. http://notblowingsmoke.org/
- 6.Twitter. 2016. [2016-11-17]. Still Blowing Smoke account https://twitter.com/stillblwngsmoke .
- 7.Twitter. 2016. [2016-11-17]. Not Blowing Smoke account https://twitter.com/notblwngsmoke .
- 8.Allem J, Escobedo P, Chu K, Soto DW, Cruz TB, Unger JB. Campaigns and counter campaigns: reactions on Twitter to e-cigarette education. Tob Control. 2016 Mar 8;:1–4. doi: 10.1136/tobaccocontrol-2015-052757.tobaccocontrol-2015-052757 [DOI] [PMC free article] [PubMed] [Google Scholar]
- 9.Lenhart A. Pew Research Center. 2015. Apr 19, [2016-11-18]. Teen, Social Media and Technology Overview 2015 http://www.pewinternet.org/2015/04/09/teens-social-media-technology-2015 .
- 10.Duggan M. Pew Research Center. 2015. Aug 19, [2016-11-18]. Mobile Messaging and Social Media - 2015 http://www.pewinternet.org/2015/08/19/mobile-messaging-and-social-media-2015/
- 11.Kim Y, Huang J, Emery S. Garbage in, Garbage Out: Data Collection, Quality Assessment and Reporting Standards for Social Media Data Use in Health Research, Infodemiology and Digital Disease Detection. J Med Internet Res. 2016 Feb 26;18(2):e41. doi: 10.2196/jmir.4738. http://www.jmir.org/2016/2/e41/ v18i2e41 [DOI] [PMC free article] [PubMed] [Google Scholar]
- 12.O'Connor RJ. Non-cigarette tobacco products: what have we learnt and where are we headed? Tob Control. 2012 Mar;21(2):181–90. doi: 10.1136/tobaccocontrol-2011-050281. http://europepmc.org/abstract/MED/22345243 .tobaccocontrol-2011-050281 [DOI] [PMC free article] [PubMed] [Google Scholar]
- 13.US Food and Drug Administration. 2016. May 05, [2016-11-17]. Recognize tobacco in its many forms http://www.fda.gov/ForConsumers/ConsumerUpdates/ucm392735.htm .
- 14.Twitter. 2016. [2016-11-17]. Public API: GET statuses/user_timeline https://dev.twitter.com/rest/reference/get/statuses/user_timeline .
- 15.Twitter. 2016. [2016-11-17]. Public API: The Search API https://dev.twitter.com/rest/public/search .
- 16.R-project. 2015. Jul 29, [2016-11-16]. twitteR: R Based Twitter Client https://cran.r-project.org/web/packages/twitteR/index.html .
- 17.QSR International. 2015. Jul 07, [2016-11-18]. What is NCapture? http://www.qsrinternational.com/support/faqs/what-is-ncapture .
- 18.Social Media Research Foundation Social Network Importer for NodeXL. 2015. Mar 21, [2016-11-17]. https://socialnetimporter.codeplex.com/
- 19.Twitter. 2016. [2016-11-17]. The Streaming APIs https://dev.twitter.com/streaming/overview .
- 20.Twitonomy. 2016. [2016-11-17]. http://www.twitonomy.com/
- 21.Gnip Inc Gnip. 2016. [2016-11-18]. https://www.gnip.com/
- 22.Salesforce Marketing Cloud. 2016. [2016-11-18]. Radian6 is now part of Salesforce Marketing Cloud https://www.marketingcloud.com/products/social-media-marketing/radian6/
- 23.Simply Measured Inc Simply Measured. 2016. [2016-11-18]. http://simplymeasured.com/
- 24.Sysomos Heartbeat. [2016-11-18]. Proactive Social Media Monitoring https://sysomos.com/products/heartbeat .
- 25.Cole-Lewis H, Pugatch J, Sanders A. Social listening: a content analysis of e-cigarette discussions on Twitter. J Med Internet Res. 2015;17:e243. doi: 10.2196/jmir.4969. [DOI] [PMC free article] [PubMed] [Google Scholar]
- 26.Kim AE, Hopper T, Simpson S, Nonnemaker J, Lieberman AJ, Hansen H, Guillory J, Porter L. Using twitter data to gain insights into e-cigarette marketing and locations of use: an infoveillance study. J Med Internet Res. 2015 Nov;17(11):e251. doi: 10.2196/jmir.4466. http://www.jmir.org/2015/11/e251/ v17i11e251 [DOI] [PMC free article] [PubMed] [Google Scholar]
- 27.Myslín M, Zhu S, Chapman W, Conway M. Using twitter to examine smoking behavior and perceptions of emerging tobacco products. J Med Internet Res. 2013 Aug;15(8):e174. doi: 10.2196/jmir.2534. http://www.jmir.org/2013/8/e174/ v15i8e174 [DOI] [PMC free article] [PubMed] [Google Scholar]
- 28.van der Tempel J, Noormohamed A, Schwartz R, Norman C, Malas M, Zawertailo L. Vape, quit, tweet? electronic cigarettes and smoking cessation on twitter. Int J Public Health. 2016 Mar;61(2):249–56. doi: 10.1007/s00038-016-0791-2.10.1007/s00038-016-0791-2 [DOI] [PubMed] [Google Scholar]
- 29.Chu K, Unger JB, Allem J, Pattarroyo M, Soto D, Cruz TB, Yang H, Jiang L, Yang CC. Diffusion of messages from an electronic cigarette brand to potential users through twitter. PLoS One. 2015;10(12):e0145387. doi: 10.1371/journal.pone.0145387. http://dx.plos.org/10.1371/journal.pone.0145387 .PONE-D-15-34480 [DOI] [PMC free article] [PubMed] [Google Scholar]
- 30.Krauss M, Sowles S, Moreno M. Hookah-related twitter chatter: a content analysis. Prev Chronic Dis. 2015;12:e121. doi: 10.5888/ped12.150140. [DOI] [PMC free article] [PubMed] [Google Scholar]
- 31.Jain S, Zhu S, Conway M. Exploring consumer attitudes towards hookah, cigarettes, and cigars using twitter. Tobacco Reg Sci. 2015 Oct 01;1(3):198–203. doi: 10.18001/TRS.1.3.1. [DOI] [Google Scholar]
- 32.Prier KW, Smith MS, Giraud-Carrier C, Hanson CL. Identifying health-related topics on twitter: an exploration of tobacco-related tweets as a test topic. In: Salerno J, editor. Social Computing, Behavioral-Cultural Modeling and Prediction. Berlin, Heidelberg: Springer-Verlag; 2011. pp. 18–25. [Google Scholar]
- 33.Huang J, Kornfield R, Szczypka G, Emery SL. A cross-sectional examination of marketing of electronic cigarettes on twitter. Tob Control. 2014 Jul;23 Suppl 3:iii26–30. doi: 10.1136/tobaccocontrol-2014-051551. http://tobaccocontrol.bmj.com/cgi/pmidlookup?view=long&pmid=24935894 .tobaccocontrol-2014-051551 [DOI] [PMC free article] [PubMed] [Google Scholar]
- 34.Jo CL, Kornfield R, Kim Y, Emery S, Ribisl KM. Price-related promotions for tobacco products on twitter. Tob Control. 2016 Jul;25(4):476–9. doi: 10.1136/tobaccocontrol-2015-052260.tobaccocontrol-2015-052260 [DOI] [PMC free article] [PubMed] [Google Scholar]
- 35.van den Heerik RAM, van Hooijdonk CMJ, Burgers C, Steen GJ. “Smoking Is Sóóó ... Sandals and White Socks”: Co-creation of a Dutch anti-smoking campaign to change social norms. Health Commun. 2016 Jun 29;:1–8. doi: 10.1080/10410236.2016.1168000. [DOI] [PubMed] [Google Scholar]
- 36.Step MM, Bracken CC, Trapl ES, Flocke SA. User and content characteristics of public tweets referencing little cigars. Am J Health Behav. 2016 Jan;40(1):38–47. doi: 10.5993/AJHB.40.1.5. [DOI] [PubMed] [Google Scholar]
- 37.de Viron S, Suggs L, Brand A, Van Oven H. Communicating genetics and smoking through social media: are we there yet? J Med Internet Res. 2013 Sep 09;15(9):e198. doi: 10.2196/jmir.2653. http://www.jmir.org/2013/9/e198/ v15i9e198 [DOI] [PMC free article] [PubMed] [Google Scholar]
- 38.Prochaska J, Pechmann C, Kim R, Leonhardt J. Twitter = quitter? an analysis of twitter quit smoking social networks. Tobacco Control. 2012;21:447–9. doi: 10.1007/978-3-642-19656-0. [DOI] [PMC free article] [PubMed] [Google Scholar]
- 39.Harris JK, Moreland-Russell S, Choucair B, Mansour R, Staub M, Simmons K. Tweeting for and against public health policy: response to the Chicago Department of Public Health's electronic cigarette twitter campaign. J Med Internet Res. 2014;16(10):e238. doi: 10.2196/jmir.3622. http://www.jmir.org/2014/10/e238/ v16i10e238 [DOI] [PMC free article] [PubMed] [Google Scholar]
- 40.Aphinyanaphongs Y, Lulejian A, Brown D, Bonneau R, Krebs P. Text classificationfor automatic detection of e-cigarette use and use for smoking cessation from twitter: a feasibility pilot. Pac Symp Biocomput. 2016;21:480–91. [PMC free article] [PubMed] [Google Scholar]
- 41.Clark EM, Jones CA, Williams JR, Kurti AN, Norotsky MC, Danforth CM, Dodds PS. Vaporous marketing: uncovering pervasive electronic cigarette advertisements on twitter. PLoS One. 2016 Jul;11(7):e0157304. doi: 10.1371/journal.pone.0157304. http://dx.plos.org/10.1371/journal.pone.0157304 .PONE-D-15-39861 [DOI] [PMC free article] [PubMed] [Google Scholar]
- 42.Kavuluru R, Sabbir AK. Toward automated e-cigarette surveillance: Spotting e-cigarette proponents on twitter. J Biomed Inform. 2016 Jun;61:19–26. doi: 10.1016/j.jbi.2016.03.006.S1532-0464(16)00046-0 [DOI] [PMC free article] [PubMed] [Google Scholar]
- 43.Chu K, Unger J, Cruz T. Electronic cigarettes on twitter - spreading the appeal of flavors. Tob Regul Sci. 2015;1:36–41. doi: 10.18001/TRS.1.1.4. [DOI] [PMC free article] [PubMed] [Google Scholar]
- 44.Chung JE. A smoking cessation campaign on twitter: understanding the use of twitter and identifying major players in a health campaign. J Health Commun. 2016 May;21(5):517–26. doi: 10.1080/10810730.2015.1103332. [DOI] [PubMed] [Google Scholar]
- 45.Cole-Lewis H, Varghese A, Sanders A, Schwarz M, Pugatch J, Augustson E. Assessing electronic cigarette-related tweets for sentiment and content using supervised machine learning. J Med Internet Res. 2015 Aug 25;17(8):e208. doi: 10.2196/jmir.4392. http://www.jmir.org/2015/8/e208/ v17i8e208 [DOI] [PMC free article] [PubMed] [Google Scholar]
- 46.Duke JC, Hansen H, Kim AE, Curry L, Allen J. The use of social media by state tobacco control programs to promote smoking cessation: a cross-sectional study. J Med Internet Res. 2014 Jul;16(7):e169. doi: 10.2196/jmir.3430. http://www.jmir.org/2014/7/e169/ v16i7e169 [DOI] [PMC free article] [PubMed] [Google Scholar]
- 47.Emery S, Szcyzpka G, ABril E. Are you scared yet? evaluating fear appeal messages in tweets about the tips campaign. J Commun. 2014;64:278–95. doi: 10.1111/jcom.12083. [DOI] [PMC free article] [PubMed] [Google Scholar]
- 48.McDaniel PA, Patzke H, Malone RE. Twitter users' reaction to a chain pharmacy's decision to end tobacco sales. Tob Induc Dis. 2015;13:36. doi: 10.1186/s12971-015-0060-9. http://tobaccoinduceddiseases.biomedcentral.com/articles/10.1186/s12971-015-0060-9 .60 [DOI] [PMC free article] [PubMed] [Google Scholar]
- 49.Rocheleau M, Sadasivam RS, Baquis K, Stahl H, Kinney RL, Pagoto SL, Houston TK. An observational study of social and emotional support in smoking cessation Twitter accounts: content analysis of tweets. J Med Internet Res. 2015;17(1):e18. doi: 10.2196/jmir.3768. http://www.jmir.org/2015/1/e18/ v17i1e18 [DOI] [PMC free article] [PubMed] [Google Scholar]
- 50.Unger JB, Escobedo P, Allem J, Soto DW, Chu K, Cruz T. Perceptions of secondhand e-cigarette aerosol among twitter users. Tobacco Reg Sci. 2016 Apr 01;2(2):146–52. doi: 10.18001/TRS.2.2.5. [DOI] [PMC free article] [PubMed] [Google Scholar]
- 51.Altman D. Practical statistics for medical research. London: Chapman and Hall; 1991. [Google Scholar]
- 52.George D, Mallery P. SPSS for Windows step by step: A simple guide and reference. 11.0 update. 4th edition. Boston, MA: Allyn & Bacon; 2003. [Google Scholar]
- 53.Centers for Disease Control and Prevention. 2015. Apr 17, [2016-11-18]. Morbidity and Mortality Weekly Report: Tobacco use among middle and high school students: United States, 2011-2014 http://www.cdc.gov/mmwr/preview/mmwrhtml/mm6414a3.htm .
- 54.US Food and Drug Administration. 2016. Nov 28, [2017-03-13]. The Facts on the FDA's New Tobacco Rule https://www.fda.gov/ForConsumers/ConsumerUpdates/ucm506676.htm .
- 55.Reyes A, Rosso P, Veale T. A multidimensional approach for detecting irony in Twitter. Lang Resources & Evaluation. 2012 Jul 24;47(1):239–68. doi: 10.1007/s10579-012-9196-x. [DOI] [Google Scholar]
- 56.Sobhani P, Mohammad S, Kiritchenko S. Detecting stance in tweets and analyzing its interaction with sentiment. Proceedings of the Fifth Joint Conference on Lexical and Computational Semantics; August 2016; Berlin, Germany. 2016. pp. 159–169. [Google Scholar]
- 57.Allem J, Ferrara E. The importance of debiasing social media data to better understand e-cigarette-related attitudes and behaviors. J Med Internet Res. 2016 Aug 09;18(8):e219. doi: 10.2196/jmir.6185. http://www.jmir.org/2016/8/e219/ v18i8e219 [DOI] [PMC free article] [PubMed] [Google Scholar]
- 58.Burger JD, Henderson J, Kim G, Zarrella G. Discriminating gender on Twitter. Proceedings of the Conference on Empirical Methods in Natural Language Processing; July 2011; Edinburgh, Scotland, UK. 2011. [Google Scholar]
- 59.Sakaki S, Miura Y, Ma X, Hattori K, Ohkuma T. Twitter user gender inferences using combined analysis of text and image processing. Proceedings of the 25th International Conference on Computational Linguistics; August 2014; Dublin, Ireland. 2014. [Google Scholar]
- 60.Nguyen D, Gravel R, Trieschnigg D, Meder T. “How old do you think I am?”: a study of language and age in twitter. Proceedings of the Seventh International AAAI Conference on WeblogsSocial Media; July 2013; Cambridge, MA. 2013. [Google Scholar]