

Abstract
Background
Visual dysfunction in MS can be quantified using a variety of tests. Many vision tests have not been formally evaluated among MS patients with existing visual dysfunction.
Objective
Evaluate several versions of visual acuity and contrast sensitivity tests, measures of central and peripheral vision, retina structure, electrophysiologic function, and quality of life among MS patients with moderate/severe visual dysfunction.
Methods
Cross-sectional study of 46 patients with stable, incompletely recovered optic neuritis. Testing included Snellen eye charts, several Sloan low contrast charts, Pelli Robson (PR) contrast sensitivity charts, optical coherence tomography, visual fields, Farnsworth Munsell 100-hue test, visual evoked potentials (VEP), and visual function quality of life (VFQ-25) testing.
Results
98% of eyes could read two lines of the PR chart, while only 43% read the 2.5% contrast chart. Low contrast tests correlated strongly with each other and with retinal nerve fiber layer (RNFL) thickness, visual fields, and color vision but not with VEPs. For patients with RNFL <75μm, VFQ-25 scores dropped by approximately 2 points for every 1 μm decrease in RNFL.
Conclusion
Among MS patients with visual impairment due to optic neuritis, PR contrast sensitivity could be utilized as a single chart. Visual quality of life was associated with RNFL thinning below 75μm.
Keywords: Visual acuity, multiple sclerosis
Introduction1
Visual dysfunction is common in multiple sclerosis (MS), a concern for patients, and a frequent cause of disability and reduced quality of life (1). The visual system can be readily assessed by a number of measures including low contrast visual acuity (LCVA), visual evoked potentials (VEP), visual fields, color vision and retinal nerve fiber layer (RNFL) thickness (2-8). While such measures are interrelated, each test highlights a unique facet of the visual system. In some instances, several variations of a test exist. Which test to utilize depends upon the research question, how a therapy is postulated to work, and the characteristics of the patient population being recruited.
Recent studies of visual testing in MS have focused on patients with normal or near-normal vision. LCVA testing using 2.5% contrast charts has emerged from this work as a test that is sensitive for detecting visual disability and tracking it over time (9, 10). RNFL thickness is another informative outcome measure increasingly utilized in clinical practice and trials (6, 11) and color vision is frequently impaired in MS patients with and without a history of optic neuritis (12, 13). Because most of these tests have not been evaluated in patients with moderate to severe visual dysfunction, whether these instruments will be useful across the full spectrum of MS patients has yet to be established.
To determine which clinical tests of visual function are most useful for detecting and quantifying deficits among patients with baseline visual impairment, we performed a comprehensive battery of visual tests on 46 MS patients with residual visual dysfunction due to past optic neuritis (ON) and relatively low vision qualify of life scores.
Methods
Subjects
This prospective, cross-sectional observational study of 46 patients with clinically definite MS (by 2010 McDonald criteria) and incompletely recovered optic neuritis was performed at the John L. Trotter Multiple Sclerosis Center at Washington University in St. Louis. Patients had at least one clinical episode of ON, diagnosed by an MS-specializing neurologist or neuro-ophthalmologist, which occurred >12 months prior to study entry. All patients underwent ophthalmologic evaluation to exclude other ocular pathology, and all visual tests were performed with best refracted vision. Patients were required to have ongoing self-reported visual dysfunction and at least one eye with best corrected visual acuity 0.67 (20/30) or worse. Participants were required to read at least 2 letters on the 5% Sloan contrast chart at 3 meters in at least one clinically affected eye (the other eye may also be affected and unable to read the 5% chart). Use of disease modifying drugs was noted. Patients with known ophthalmologic conditions other than past ON and those who had received glucocorticoids within the last 3 months were excluded. All visual tests were performed monocularly. One prosthetic eye was excluded from the analysis. The study received institutional review board approval and written informed consent was obtained from each patient.
Visual acuity assessment
Standard Snellen visual acuity testing was performed. Corrected high contrast visual acuity (HCVA) and LCVA were measured using low contrast 3 meter Sloan letter charts with 100%, 25%, 10%, 5% and 2.5% contrast (Precision Vision, IL, USA). LCVA testing requires the identification of progressively smaller gray letters with a fixed contrast level on a white, retroilluminated background. Subjects who had a clinically affected eye that was unable to visualize the 5% chart from the standard distance were also tested with 10% and 25% contrast charts. The number of letters identified correctly was recorded (maximum score of 100). Pelli-Robson (PR) 1 meter contrast sensitivity charts (Precision Vision, IL, USA) consist of 48 letters of a fixed large size, and contrast is decreased within each group of three letters. The number of correct responses was recorded as log contrast sensitivity. LCVA and contrast sensitivity testing were performed in the early morning for all patients.
Color vision assessment
Color vision was measured using the Farnsworth Munsell 100-Hue test (FM-100) (X-Rite, MI, USA). Patients were required to sort 85 hues across the visual spectrum. A daytime source light booth was used to ensure consistent testing conditions (X-Rite Judge II, MI, USA), and a patch was placed over the eye not being tested. Total error scores (TES) were tabulated for each subject; error scores of ≤100 correspond to average color discrimination and scores of >100 indicate poor color discrimination compared to normative data. Additionally, total partial error scores were calculated by tabulating errors in caps 13-33 and 55-75 for the red-green axis and in caps 1-12, 34-54, and 76-85 for the blue-yellow axis (14, 15).
Other visual testing
Pattern reversal visual evoked potentials (VEP) were recorded using an Espion E2 system (Diagnosys, LLC). Monocular VEPs were recorded from an active electrode placed on the occipital scalp 2 cm above the inion and referenced to an identical at electrode placed on the mastoid. Responses were recorded to 60' check size, 100% contrast, counter phased at 4 reversals per second. P100 latencies and amplitudes were recorded. Spectral domain optical coherence tomography (OCT) of the retina was performed by an experienced technician using a Zeiss Cirrus machine (Zeiss, Dublin, CA, USA). A signal strength ≥7 was required, and data were reviewed by a neurologist or neuro-ophthalmologist for artifacts prior to inclusion. RNFL thickness was measured on average and segmented into superior, inferior, nasal and temporal quadrants. Participants had automated perimetry in both eyes with Humphrey Field Analyzer SITA Standard program 24-2 (Zeiss, Dublin, CA, USA). The testing was performed by a technician certified by the Visual Field Reading Center.
Quality of life
The National Eye Institute's Visual Function Questionnaire (VFQ-25) is a vision targeted quality of life scale that is the standard patient reported outcome tool for ophthalmologic research and clinical trials (16). The VFQ-25 consists of 12 sub-scales representing 11 aspects of visual function and a general health rating question. The composite score is an unweighted average of the subscales, excluding general health. Scores range from 0 to 100, with higher scores representing better vision.
Statistical analysis
Statistical analysis was performed using the SPSS 21 package (IBM, Somers, NY, USA) and SAS 9.4/STAT 13.2. For correlations between measures of low contrast vision, OCT, FM-100 score, VEPs and visual fields, rank correlations were performed. Accounting for the additional level of correlation between the two eyes of single patients, one randomly selected eye per patient was included in each instance of a correlation and the procedure was repeated 1000 times. The correlation coefficients reported are the median values from these 1000 repetitions. P-values were false discovery rate-adjusted for multiple comparisons. Comparisons of visual function in patients with ≥75 μm versus <75 μm RNFL were carried out using Wilcoxon rank sum tests calculated from 1000 randomly selected samples of one eye per patient and p-values determined as described above. Visual function quality of life is a single value that depends on binocular vision. Since other visual tests were performed monocularly, simple correlations were not possible. The relationship of VFQ-25 scores to other visual measures was examined by plotting a locally weighted regression line over the scatterplots with a smoothing factor of 0.9.
Results
Forty-six subjects contributed 91 eyes to the analysis (Table 1). A remote clinical history of ON was present in 100% of patients and 81% of eyes (74/91). Testing by VEP and OCT revealed subclinical ON in an additional 5% (5/91) of eyes, defined as results falling >2 standard deviations from published normative values. The median cohort HCVA was 20/40 (0.5); HCVA was worse than 20/20 (1.0) in 85% of eyes (77/91) and worse than 20/40 (0.5) in 33% of eyes (30/91). The mean NEI-VFQ-25 composite score was 70, consistent with markedly decreased quality of life and functional activities due to visual impairment (17).
Table 1. Demographic data for cohort.
| n=46 patients/91 eyes | |
|---|---|
| Age, y, mean (SD) | 47 (10) |
| Sex, n (%), female | 34 (74) |
| Caucasian, n (%) | 33 (72) |
| RRMS, n (%) | 38 (83) |
| Eyes with clinical ON history, n (%) | 74 (81) |
| MS disease duration, y, median (range) | 11.5 (<1-27) |
| Patients with disease modifying treatment, n (%) | 41 (89.1) |
| EDSS score, median (range) | 3.75 (1.5-8.5) |
| Monocular Snellen VA (median, range) | 0.5 (0-1.33) |
| NEI-VFQ-25 composite score, mean (SD) | 70 (19.8) |
| Pelli-Robson contrast sensitivity score (mean, SD) | 1.5 (0.39) |
| EDTRS 5%, no of letters (max score 50), (mean, SD) | 21 (16.8) |
| EDTRS 2.5%, no of letters (max score 50), (mean, SD) | 12 (12.8) |
Previous work has established both two line (10 letter) and 7-letter changes in Sloan LCVA testing scores (2.5% contrast) as clinically meaningful for visual function (3, 18). We assessed whether this cohort could achieve these thresholds, allowing these criteria to be met in the context of disease progression or a therapeutic intervention. Only 43% of the eyes (n=39/91) in our cohort were able to read two lines of the 2.5% contrast chart under standard testing conditions; 50% (n=45/91) could read at least 7 letters. A median Snellen visual acuity of 20/25 (0.8) was required to read two lines of the 2.5% chart, and no one with a VA of less than 20/70 (0.29) was able to accomplish this task (Figure 1A). Similarly, the 5% contrast chart required a median visual acuity of 20/30 (0.67); no patients with VA worse than 20/70 (0.29) could read two lines of this chart (Figure 1A). Results were comparable when 7 LCVA letters were used as the cutoff (Figure 1C).
Figure 1.
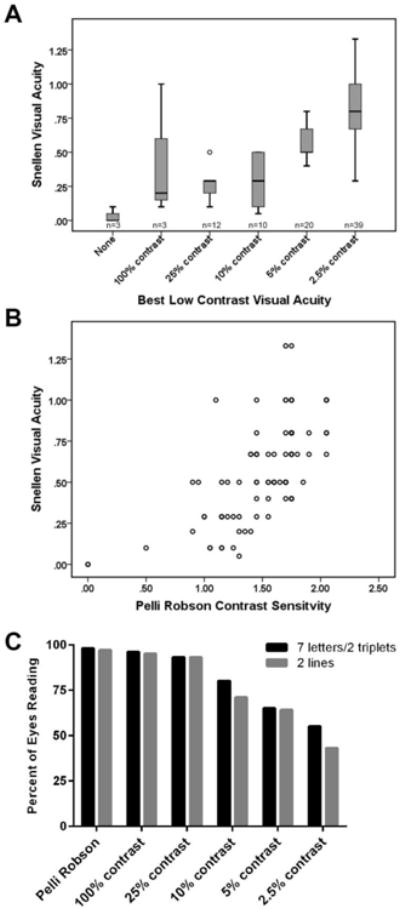
Patient performance on low contrast visual testing is dependent on high contrast visual acuity.
Best LCVA (A) was defined as the lowest contrast chart that was readable by a given eye; n represents the number of eyes for which this was the best LCVA chart. Performance on low contrast vision testing correlated strongly with visual acuity (A, B). Many eyes were unable to read 2.5% or 5% LCVA charts (C). Patients were determined to have read a chart when they read at least 2 lines (A, C), 7 letters (for Sloan charts, C), or two triplets (for PR charts, C). LCVA: low contrast visual acuity.
Pelli Robson (PR) contrast sensitivity testing differs from Sloan LCVA testing by maintaining a single large letter size (20/60 optotype) to be read at 1 meter, but contrast decreases progressively down the chart. Two-triplet (6 letter) changes in PR scores has previously been considered clinically meaningful (19). Two triplets of the PR chart were read by 98% of patients, with a median VA of 20/40 (0.5). Three eyes in this cohort had visual acuity worse than 20/800 (<0.025), yet one of these severely affected eyes was able to read 20 letters on the PR chart. All individuals with VA of 20/400 or better were able to read at least two triplets on the PR chart (Figure 1B, C).
Both LCVA and PR tests correlated strongly with RNFL thickness (r=0.66 to 0.69, p<0.001), color vision testing (r=-0.59 to -0.63, p< 0.001), and visual fields (r=0.59 to 0.72, p=<0.001), but not with VEP latencies (Table 2). Correlating quadrant-specific RNFL thickness with other measures of visual function demonstrated that the superior and inferior quadrants performed similarly to average RNFL thickness; nasal and temporal quadrants were not associated with other measures of visual function (data not shown).
Table 2. Low contrast vision testing correlates with other quantitative measures of visual function.
| Average RNFL | VEP P100 | VEP amplitude | FM-100 TES | Humphrey Visual Field MD | |
|---|---|---|---|---|---|
| Snellen VA (n) | 0.58***(90) | 0.027 (90) | 0.51**(90) | -0.59*** (90) | 0.56*** (90) |
| Sloan 100% (n) | 0.66*** (91) | -0.026 (91) | 0.54*** (91) | -0.62*** (91) | 0.64*** (91) |
| Sloan 5% (n) | 0.69*** (91) | -0.038 (91) | 0.51*** (91) | -0.61*** (91) | 0.63*** (91) |
| Sloan 2.5% (n) | 0.67*** (91) | -0.04 (91) | 0.52** (91) | -0.62*** (91) | 0.61*** (91) |
| Pelli Robson (n) | 0.66*** (91) | 0.02 (91) | 0.58*** (91) | -0.63*** (91) | 0.65*** (91) |
Retinal nerve fiber layer thinning below 75um has previously been identified as a clinically relevant threshold, as patients below this level had significantly poorer performance on Humphrey visual fields than those with RNFLs of ≥75um thickness (20). Among the current cohort of ON patients, 59/91 (65%) had thin RNFLs by this criterion. These eyes performed significantly more poorly on LCVA and visual field testing when compared to eyes with normal RNFL thickness, but did not differ with regards to color vision or VEP latency (Table 3).
Table 3.
Visual performance as a function of RNFL thickness.
| RNFL ≥75 μm (n= 32) | RNFL <75 μm (n= 59) | |
|---|---|---|
|
| ||
| RNFL thickness (μm) | ||
| Mean ± SD | 84.8 ± 7.6 | 63.8 ± 6.8 |
| Median (range) | 83.5 (75-105) | 64.0 (47-74) |
|
| ||
| PR score | ||
| Mean ± SD | 1.8 ± 0.2 | 1.4 ± 0.4**** |
| Median (range) | 1.75 (1.45-2.05) | 1.4 (0-2.05) |
|
| ||
| FM-100 TES | ||
| Mean ± SD | 149 ± 76 | 355 ± 258 |
| Median (range) | 136 (44-234) | 266 (0-1064) |
|
| ||
| Sloan 5% contrast | ||
| Mean ± SD | 34.3 ± 9.8 | 13.2 ± 15.0**** |
| Median (range) | 37.5 (13-49) | 3 (0-45) |
|
| ||
| Sloan 2.5% contrast | ||
| Mean ± SD | 21.3 ± 12.9 | 6.7 ± 9.7 ** |
| Median (range) | 25.0 (0-40) | 0.0 (0-34) |
|
| ||
| Humphrey visual field MD | ||
| Mean ± SD | -2.4 ± 2.0 | -8.7 ± 8.5**** |
| Median (range) | -2.0 (-6.7-0.4) | -5.3 (-32.9 - -0.1) |
|
| ||
| VEP 60m amplitude | ||
| Mean ± SD | 5.9 ± 3.9 | 3.9 ± 2.9 |
| Median (range) | 4.8 (1-21) | 3.6 (0-19) |
|
| ||
| VEP P100 latency | ||
| Mean ± SD | 122.3 ± 13 | 122.4 ± 21.5 |
| Median (range) | 120.8 (94.5-148.5) | 125 (0-177.5) |
Patients' self-report of activities and quality of life related to visual function, as measured by the VFQ-25, correlated with average RNFL thickness below a critical threshold of 75 μm. Each additional 1 μm decrease in RNFL thickness was associated with a 2.4 point decrease in VFQ-25 score. Above 75 μm, no relationship between RNFL thickness and VFQ-25 was apparent (Figure 2). Linear relationships were not evident between VFQ-25 and the other quantitative visual measures in this cohort.
Figure 2.
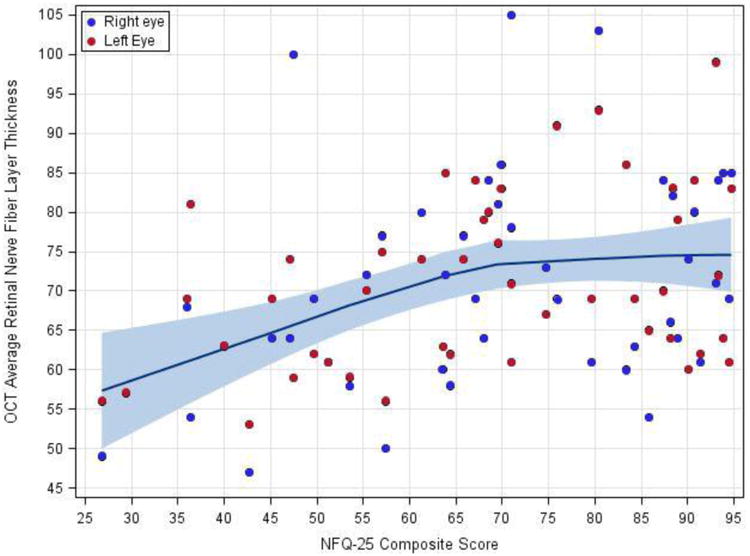
Relationship between retinal nerve fiber layer thickness and visual function quality of life.
Visual function quality of life score was plotted against RNFL thickness and a locally weighted regression line with a smoothing factor of 0.9 was calculated. Shading represents the 95% confidence interval for the smoothed line.
Color vision, measured by the FM-100, was markedly impaired for most of this cohort; 83% of eyes had poor color discrimination compared to normative data. FM-100 scores correlated strongly with RNFL thickness (ρ = -0.55, p<0.001), LCVA testing (ρ = -0.61 to -0.65, p<0.001) and PR testing (ρ = -0.63, p<0.01) (Table 2). When total error scores were subdivided into total partial error scores (TPES) along different color spectrums, MS patients did not demonstrate differentiation of dyschromatopsia along either partial color axis (mean TPES 139 for red/green, mean TPES 146 for blue/yellow, p=0.66), in accordance with previous work (13, 21). Both red/green and blue/yellow TPESs correlated significantly with overall RNFL thickness but color disturbances could not be topographically mapped to any specific retinal quadrant (data not shown).
Discussion
This study of MS patients with vision loss from incompletely recovered ON demonstrated that the Pelli-Robson contrast sensitivity chart could be read by 98% of eyes, whereas the Sloan 2.5% contrast chart could be read by no more than half of eyes tested. Prior studies have demonstrated increased sensitivity for detecting abnormal vision using the 2.5% charts in MS patients with preserved high contrast visual acuity (10, 22, 23) and have shown that in well-recovered ON eyes, Pelli-Robson testing detected abnormal contrast sensitivity (defined as two standard deviations below normative data) in 17% while Sloan 2.5% contrast charts were abnormal in 28% (24, 25). Thus, the 2.5% contrast may have an advantage in patients with normal high-contrast visual acuity (26). In contrast, the Pelli-Robson test performed well as a single chart used across a range of visual outcomes.
Both Pelli-Robson and Sloan charts were strongly and similarly correlated with retinal nerve fiber layer thickness, FM-100 scores and visual field testing. Neither chart was inferior in its relationship to other visual measures. Retinal nerve fiber layer thickness was associated with vision-related quality of life below the critical threshold of 75 μm. This complements prior work demonstrating a relationship between contrast sensitivity and VFQ-25 scores (3) with the added benefit that RNFL thickness is a quantifiable measure with low intra-site and intra-visit variability. Although VEP latency was frequently abnormal, it was not associated with the degree of visual dysfunction. This lack of correlation may not be unexpected, as P100 latency reflects demyelination while RNFL thickness assesses axon density. The fact that the measures did not correlate in this cohort emphasizes that each test addresses distinct components of vision. P100 prolongation early after ON predicts later retinal axonal loss (27), thus VEPs may have utility as a prognostic biomarker. However, an isolated change in VEP latency among stable MS patients may be dissociated from other aspects of visual function and the patient's ability to function. Based upon this cross-sectional study, a potential lack of relationship between VEP latency and visual function should be considered when evaluating mechanisms of action for remyelinating therapies. Whether an intervention that improves VEP latency through remyelination can also improve visual function from an individual's baseline remains to be demonstrated (28).
Another important aspect of contrast testing in clinical trials is sensitivity to change. While the present study did not assess longitudinal changes with treatment, Sloan charts have demonstrated sensitivity in other studies. Indeed, 1.25% and 2.5% contrast charts were incorporated into the AFFIRM trial of natalizumab and investigators and detected a treatment effect of natalizumab for sustained visual improvement (18, 29). In our cohort, recruited based on incompletely recovered ON, LCVA remained a sensitive measure of visual dysfunction. However, the previously characterized 2.5% contrast chart was unreadable by a large fraction of our cohort, indicating a floor effect. Multiple low contrast charts ranging from 2.5% to 25% contrast allowed accurate determination of patients' best low contrast visual acuity but were cumbersome to administer and challenging to analyze. Alternatively, PR charts were readable regardless of the level of visual dysfunction and therefore may have value in studies of progressive MS where vision is more likely abnormal. The phase II trial of alemtuzumab included the Pelli-Robson, and demonstrated a strong treatment effect on contrast sensitivity with this measure (30).
RNFL thinning has emerged as a biomarker for MS severity, correlating with global cerebral volume loss and clinical disability as well as with past ON (31-33). We found that RNFL thickness correlated strongly with LCVA in patients with previous ON, complementing prior work which demonstrated that RNFL thinning occurs independent of ON (34, 35) and correlates with LCVA in patients without significant visual disability (2, 6). Interestingly, although retinal thinning in MS usually begins in the papillomacular bundle and the temporal quadrant (11, 36, 37), retinal thickness in this region did not correlate with other tests of visual function in this cohort.
Color vision is commonly impaired in MS, and dyschromatopsia has long been recognized as a sequale of ON (38). Recent work linking dyschromatopsia to retinal anatomy has been limited to brief screening tests of color vision (4). These were abnormal in MS patients compared to controls, and scores correlated well with RNFL thickness. Nevertheless, we hypothesized that using the more exhaustive FM-100 would increase the sensitivity of this assessment. As expected, FM-100 scores were abnormal in almost all MS eyes. TESs correlated well with RNFL thickness, but were not statistically different in eyes with RNFLs less than 75μm (Table 3). Similar to prior literature, there appears to be no advantage to the time-consuming FM-100 when compared to shorter screening tests of color vision (39). We also confirmed that in optic neuritis due to MS, both red-green and blue-yellow color axes are affected (40). While we did not include less cumbersome tests of color vision for direct comparison, the literature would support use of the more feasible Hardy-Rand-Rittler plates or the Lanthony D15 test (41).
This study was limited to MS patients with chronic visual dysfunction and complements previous work in less disabled patients. Our study provides evidence that LCVA, contrast sensitivity, color vision, and Humphrey visual fields correlate well with retinal anatomy in patients with existing visual dysfunction and underscores the clinical utility of RNFL measurements. For clinical implementation, PR contrast sensitivity testing holds some practical advantages over Sloan LCVA charts in that a single testing paradigm can be used for all patients, regardless of the degree of visual impairment. In contrast, Sloan LCVA testing may require modified procedures to accommodate patients with poor vision.
Acknowledgments
Role of Sponsor: This investigator-initiated study was supported by Acorda Therapeutics. The authors had full independence in these baseline analyses and manuscript generation. It was also supported in part by NIH training grant UL1 TR000448 and NIH grant C06RR014513.
Dr. Longbrake has received honoraria from speaking/consulting for Genzyme, Teva and Biogen. Her salary is supported by a Sylvia Lawry Physicians Fellowship from the National MS Society.
Dr. Naismith has received honoraria for consulting or speaking from Alkermes, Acorda, Bayer, Biogen, EMD Serono, Genentech, Genzyme, Mallinckrodt, Novartis, Pfizer, and Teva.
Footnotes
Abbreviations: FM-100: Farnsworth Munsell 100-hue test; HCVA: high contrast visual acuity; LCVA: low contrast visual acuity; MD: mean deviation; MS: multiple sclerosis; OCT: optical coherence tomography; ON: optic neuritis; PR: Pelli Robson contrast sensitivity; RNFL: retinal nerve fiber layer; TES: total error score; TPES: total partial error score; VEP: visual evoked potential; VFQ: visual function quality of life
Conflicts of Interest: Dr. Trinkaus, Ms. Lancia & Dr. Tutlam have no disclosures.
Publisher's Disclaimer: This is a PDF file of an unedited manuscript that has been accepted for publication. As a service to our customers we are providing this early version of the manuscript. The manuscript will undergo copyediting, typesetting, and review of the resulting proof before it is published in its final citable form. Please note that during the production process errors may be discovered which could affect the content, and all legal disclaimers that apply to the journal pertain.
References
- 1.McDonald WI, Barnes D. The ocular manifestations of multiple sclerosis. 1. Abnormalities of the afferent visual system. J Neurol Neurosurg Psychiatry. 1992;55(9):747–52. doi: 10.1136/jnnp.55.9.747. [DOI] [PMC free article] [PubMed] [Google Scholar]
- 2.Schinzel J, Zimmermann H, Paul F, Ruprecht K, Hahn K, Brandt AU, et al. Relations of low contrast visual acuity, quality of life and multiple sclerosis functional composite: a cross-sectional analysis. BMC Neurol. 2014;14:31. doi: 10.1186/1471-2377-14-31. [DOI] [PMC free article] [PubMed] [Google Scholar]
- 3.Mowry EM, Loguidice MJ, Daniels AB, Jacobs DA, Markowitz CE, Galetta SL, et al. Vision related quality of life in multiple sclerosis: correlation with new measures of low and high contrast letter acuity. J Neurol Neurosurg Psychiatry. 2009;80(7):767–72. doi: 10.1136/jnnp.2008.165449. [DOI] [PubMed] [Google Scholar]
- 4.Villoslada P, Cuneo A, Gelfand J, Hauser SL, Green A. Color vision is strongly associated with retinal thinning in multiple sclerosis. Mult Scler. 2012;18(7):991–9. doi: 10.1177/1352458511431972. [DOI] [PubMed] [Google Scholar]
- 5.Laron M, Cheng H, Zhang B, Schiffman JS, Tang RA, Frishman LJ. Comparison of multifocal visual evoked potential, standard automated perimetry and optical coherence tomography in assessing visual pathway in multiple sclerosis patients. Mult Scler. 2010;16(4):412–26. doi: 10.1177/1352458509359782. [DOI] [PMC free article] [PubMed] [Google Scholar]
- 6.Fisher JB, Jacobs DA, Markowitz CE, Galetta SL, Volpe NJ, Nano-Schiavi ML, et al. Relation of visual function to retinal nerve fiber layer thickness in multiple sclerosis. Ophthalmology. 2006;113(2):324–32. doi: 10.1016/j.ophtha.2005.10.040. [DOI] [PubMed] [Google Scholar]
- 7.Balcer LJ, Baier ML, Cohen JA, Kooijmans MF, Sandrock AW, Nano-Schiavi ML, et al. Contrast letter acuity as a visual component for the Multiple Sclerosis Functional Composite. Neurology. 2003;61(10):1367–73. doi: 10.1212/01.wnl.0000094315.19931.90. [DOI] [PubMed] [Google Scholar]
- 8.Balcer LJ, Miller DH, Reingold SC, Cohen JA. Vision and vision-related outcome measures in multiple sclerosis. Brain. 2015;138(Pt 1):11–27. doi: 10.1093/brain/awu335. [DOI] [PMC free article] [PubMed] [Google Scholar]
- 9.Baier ML, Cutter GR, Rudick RA, Miller D, Cohen JA, Weinstock-Guttman B, et al. Low-contrast letter acuity testing captures visual dysfunction in patients with multiple sclerosis. Neurology. 2005;64(6):992–5. doi: 10.1212/01.WNL.0000154521.40686.63. [DOI] [PubMed] [Google Scholar]
- 10.Balcer LJ, Baier ML, Pelak VS, Fox RJ, Shuwairi S, Galetta SL, et al. New low-contrast vision charts: reliability and test characteristics in patients with multiple sclerosis. Mult Scler. 2000;6(3):163–71. doi: 10.1177/135245850000600305. [DOI] [PubMed] [Google Scholar]
- 11.Pueyo V, Martin J, Fernandez J, Almarcegui C, Ara J, Egea C, et al. Axonal loss in the retinal nerve fiber layer in patients with multiple sclerosis. Mult Scler. 2008;14(5):609–14. doi: 10.1177/1352458507087326. [DOI] [PubMed] [Google Scholar]
- 12.Martínez-Lapiscina EH, Ortiz-Pérez S, Fraga-Pumar E, Martínez-Heras E, Gabilondo I, Llufriu S, et al. Colour vision impairment is associated with disease severity in multiple sclerosis. Mult Scler. 2014;20(9):1207–16. doi: 10.1177/1352458513517591. [DOI] [PubMed] [Google Scholar]
- 13.Schneck ME, Haegerstrom-Portnoy G. Color vision defect type and spatial vision in the optic neuritis treatment trial. Invest Ophthalmol Vis Sci. 1997;38(11):2278–89. [PubMed] [Google Scholar]
- 14.Smith VC, Pokorny J, Pass AS. Color-axis determination on the Farnsworth-Munsell 100-hue test. Am J Ophthalmol. 1985;100(1):176–82. doi: 10.1016/s0002-9394(14)75002-0. [DOI] [PubMed] [Google Scholar]
- 15.Kinnear PR, Sahraie A. New Farnsworth-Munsell 100 hue test norms of normal observers for each year of age 5-22 and for age decades 30-70. Br J Ophthalmol. 2002;86(12):1408–11. doi: 10.1136/bjo.86.12.1408. [DOI] [PMC free article] [PubMed] [Google Scholar]
- 16.Mangione CM, Lee PP, Gutierrez PR, Spritzer K, Berry S, Hays RD, et al. Development of the 25-item National Eye Institute Visual Function Questionnaire. Arch Ophthalmol. 2001;119(7):1050–8. doi: 10.1001/archopht.119.7.1050. [DOI] [PubMed] [Google Scholar]
- 17.Owen CG, Rudnicka AR, Smeeth L, Evans JR, Wormald RP, Fletcher AE. Is the NEI-VFQ-25 a useful tool in identifying visual impairment in an elderly population? BMC ophthalmology. 2006;6(1):24. doi: 10.1186/1471-2415-6-24. [DOI] [PMC free article] [PubMed] [Google Scholar]
- 18.Balcer LJ, Galetta SL, Polman CH, Eggenberger E, Calabresi PA, Zhang A, et al. Low-contrast acuity measures visual improvement in phase 3 trial of natalizumab in relapsing MS. J Neurol Sci. 2012;318(1-2):119–24. doi: 10.1016/j.jns.2012.03.009. [DOI] [PubMed] [Google Scholar]
- 19.Graves J, Galetta SL, Palmer J, Margolin DH, Rizzo M, Bilbruck J, et al. Alemtuzumab improves contrast sensitivity in patients with relapsing-remitting multiple sclerosis. Mult Scler. 2013;19(10):1302–9. doi: 10.1177/1352458513475722. [DOI] [PMC free article] [PubMed] [Google Scholar]
- 20.Costello F, Coupland S, Hodge W, Lorello GR, Koroluk J, Pan YI, et al. Quantifying axonal loss after optic neuritis with optical coherence tomography. Ann Neurol. 2006;59(6):963–9. doi: 10.1002/ana.20851. [DOI] [PubMed] [Google Scholar]
- 21.Moura AL, Teixeira RA, Oiwa NN, Costa MF, Feitosa-Santana C, Callegaro D, et al. Chromatic discrimination losses in multiple sclerosis patients with and without optic neuritis using the Cambridge Colour Test. Vis Neurosci. 2008;25(3):463–8. doi: 10.1017/S0952523808080437. [DOI] [PubMed] [Google Scholar]
- 22.van Diemen HA, Lanting P, Koetsier JC, Strijers RL, van Walbeek HK, Polman CH. Evaluation of the visual system in multiple sclerosis: a comparative study of diagnostic tests. Clin Neurol Neurosurg. 1992;94(3):191–5. doi: 10.1016/0303-8467(92)90088-k. [DOI] [PubMed] [Google Scholar]
- 23.Kupersmith MJ, Nelson JI, Seiple WH, Carr RE, Weiss PA. The 20/20 eye in multiple sclerosis. Neurology. 1983;33(8):1015–20. doi: 10.1212/wnl.33.8.1015. [DOI] [PubMed] [Google Scholar]
- 24.Pineles SL, Velez FG, Yu F, Demer JL, Birch E. Normative Reference Ranges for Binocular Summation as a Function of Age for Low Contrast Letter Charts. Strabismus. 2014;22(4):167–75. doi: 10.3109/09273972.2014.962751. [DOI] [PMC free article] [PubMed] [Google Scholar]
- 25.Mäntyjärvi M, Laitinen T. Normal values for the Pelli-Robson contrast sensitivity test1. Journal of Cataract & Refractive Surgery. 2001;27(2):261–6. doi: 10.1016/s0886-3350(00)00562-9. [DOI] [PubMed] [Google Scholar]
- 26.Balcer LJ, Baier ML, Cohen JA, Kooijmans MF, Sandrock AW, Nano–Schiavi ML, et al. Contrast letter acuity as a visual component for the Multiple Sclerosis Functional Composite. Neurology. 2003;61(10):1367–73. doi: 10.1212/01.wnl.0000094315.19931.90. [DOI] [PubMed] [Google Scholar]
- 27.Henderson AP, Altmann DR, Trip SA, Miszkiel KA, Schlottmann PG, Jones SJ, et al. Early factors associated with axonal loss after optic neuritis. Ann Neurol. 2011;70(6):955–63. doi: 10.1002/ana.22554. [DOI] [PubMed] [Google Scholar]
- 28.Cadavid D, Balcer L, Galetta S, Aktas O, Ziemssen T, Vanopdenbosch L, et al. Efficacy analysis of the anti-lingo-1 monoclonal antibody biib033 in acute optic neuritis: the renew trial (p7.202) Neurology. 2015;84(14 Supplement):P7, 202. [Google Scholar]
- 29.Balcer LJ, Galetta SL, Calabresi PA, Confavreux C, Giovannoni G, Havrdova E, et al. Natalizumab reduces visual loss in patients with relapsing multiple sclerosis. Neurology. 2007;68(16):1299–304. doi: 10.1212/01.wnl.0000259521.14704.a8. [DOI] [PubMed] [Google Scholar]
- 30.Graves J, Galetta SL, Palmer J, Margolin DH, Rizzo M, Bilbruck J, et al. Alemtuzumab improves contrast sensitivity in patients with relapsing–remitting multiple sclerosis. Multiple Sclerosis Journal. 2013 doi: 10.1177/1352458513475722. 1352458513475722. [DOI] [PMC free article] [PubMed] [Google Scholar]
- 31.Gordon-Lipkin E, Chodkowski B, Reich DS, Smith SA, Pulicken M, Balcer LJ, et al. Retinal nerve fiber layer is associated with brain atrophy in multiple sclerosis. Neurology. 2007;69(16):1603–9. doi: 10.1212/01.wnl.0000295995.46586.ae. [DOI] [PubMed] [Google Scholar]
- 32.Zivadinov R, Bergsland N, Cappellani R, Hagemeier J, Melia R, Carl E, et al. Retinal nerve fiber layer thickness and thalamus pathology in multiple sclerosis patients. Eur J Neurol. 2014;21(8):1137–e61. doi: 10.1111/ene.12449. [DOI] [PubMed] [Google Scholar]
- 33.Martinez-Lapiscina EH, Arnow S, Wilson JA, Saidha S, Preiningerova JL, Oberwahrenbrock T, et al. Retinal thickness measured with optical coherence tomography and risk of disability worsening in multiple sclerosis: a cohort study. Lancet Neurol. 2016 doi: 10.1016/S1474-4422(16)00068-5. [DOI] [PubMed] [Google Scholar]
- 34.Lange AP, Zhu F, Sayao AL, Sadjadi R, Alkabie S, Traboulsee AL, et al. Retinal nerve fiber layer thickness in benign multiple sclerosis. Mult Scler. 2013;19(10):1275–81. doi: 10.1177/1352458512474706. [DOI] [PubMed] [Google Scholar]
- 35.Fernandes DB, Raza AS, Nogueira RG, Wang D, Callegaro D, Hood DC, et al. Evaluation of inner retinal layers in patients with multiple sclerosis or neuromyelitis optica using optical coherence tomography. Ophthalmology. 2013;120(2):387–94. doi: 10.1016/j.ophtha.2012.07.066. [DOI] [PMC free article] [PubMed] [Google Scholar]
- 36.Fjeldstad C, Bemben M, Pardo G. Reduced retinal nerve fiber layer and macular thickness in patients with multiple sclerosis with no history of optic neuritis identified by the use of spectral domain high-definition optical coherence tomography. J Clin Neurosci. 2011;18(11):1469–72. doi: 10.1016/j.jocn.2011.04.008. [DOI] [PubMed] [Google Scholar]
- 37.Tátrai E, Simó M, Iljicsov A, Németh J, Debuc DC, Somfai GM. In vivo evaluation of retinal neurodegeneration in patients with multiple sclerosis. PLoS One. 2012;7(1):e30922. doi: 10.1371/journal.pone.0030922. [DOI] [PMC free article] [PubMed] [Google Scholar]
- 38.Katz B. The dyschromatopsia of optic neuritis: a descriptive analysis of data from the optic neuritis treatment trial. Trans Am Ophthalmol Soc. 1995;93:685–708. [PMC free article] [PubMed] [Google Scholar]
- 39.Trobe JD, Beck RW, Moke PS, Cleary PA. Contrast sensitivity and other vision tests in the optic neuritis treatment trial. American journal of ophthalmology. 1996;121(5):547–53. doi: 10.1016/s0002-9394(14)75429-7. [DOI] [PubMed] [Google Scholar]
- 40.Schneck ME, Haegerstrom-Portnoy G. Color vision defect type and spatial vision in the optic neuritis treatment trial. Investigative ophthalmology & visual science. 1997;38(11):2278–89. [PubMed] [Google Scholar]
- 41.Villoslada P, Cuneo A, Gelfand J, Hauser SL, Green A. Color vision is strongly associated with retinal thinning in multiple sclerosis. Multiple Sclerosis Journal. 2012;18(7):991–9. doi: 10.1177/1352458511431972. [DOI] [PubMed] [Google Scholar]