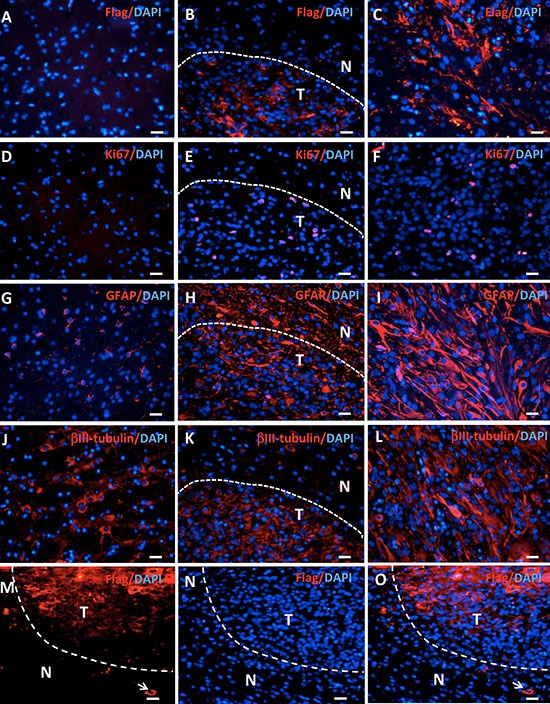
Figure 4. Gene expression in tree shrew brain tumors detected by immunofluorescence.

Staining for Flag-tagged H-Ras, Ki67, GFAP, and βIII-tubulin expression was performed in normal brains (A, D, G, J), the edge area between the tumor (T) and the normal tissue (N) (B, E, H, K), and the tumor (C, F, I, L). (M–O) Flag staining shows positive cells outside the tumor (arrows).
