Figure 5.

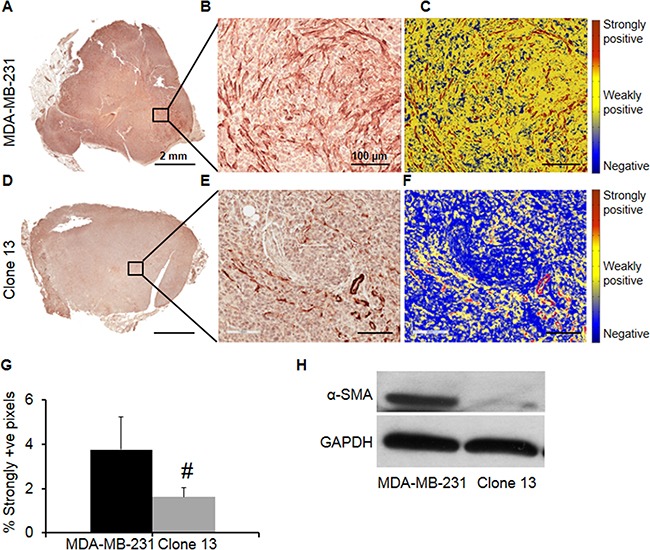
Representative images of α-SMA immunostained sections obtained from A. MDA-MB-231 and D. Clone 13 tumors. Magnified FOVs showing immunostained CAFs and the accuracy of the algorithm in identifying CAFs are presented in B. and C. for the MDA-MB-231 tumor section and in E. and F. for the Clone 13 tumor section. G. Quantification of immunostaining identified the presence of higher CAFs in MDA-MB-231 tumors (N=5) compared to Clone 13 tumors (N=6). Values represent Mean ± SEM. #p ≤ 0.084. H. Representative α-SMA immunoblot obtained from an MDA-MB-231 and a Clone 13 tumor. GAPDH was used as a loading control.
