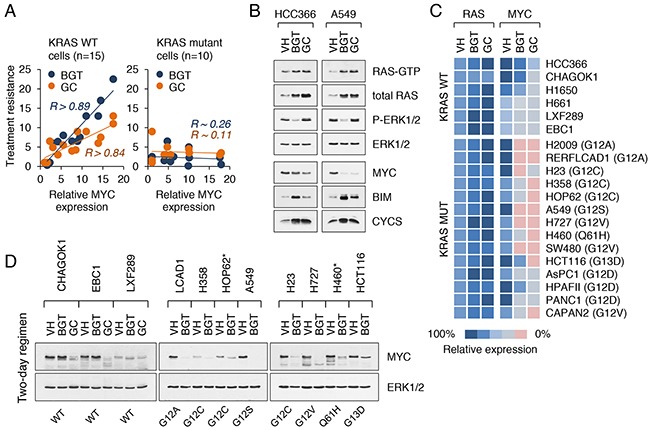
Figure 4. Suppression of MYC enhances the sensitivity of cancer cells to cytotoxic agents.

A. Correlation between the levels of MYC expression and drug resistance (BGT and GC treatment regimens) in KRAS WT (left) and KRAS mutant (right) cancer cell lines. Drug sensitivity was measured by the ratio of the number of live cells in the treated samples to the number of live cells in the untreated controls. R refers to the correlation coefficient. B. Western blot analysis of KRAS WT (HCC366) and KRAS mutant (A549) cell lines treated with vehicle alone, BGT inhibitors at 0.1 μM or GC at 5 μM for 2 d. RAS-GTP levels are shown. C. Schematic heat map showing RAS and MYC expression values in KRAS WT and KRAS mutant NSCLC, CRC and PDAC cell lines treated as in (B). Color key for expression levels is shown. Cells were maintained in DME supplemented with 5% FBS. D. MYC expression in nuclear extracts from NSCLC and CRC cell lines treated as in (B). Asterisks indicate BGT-resistant lines.
