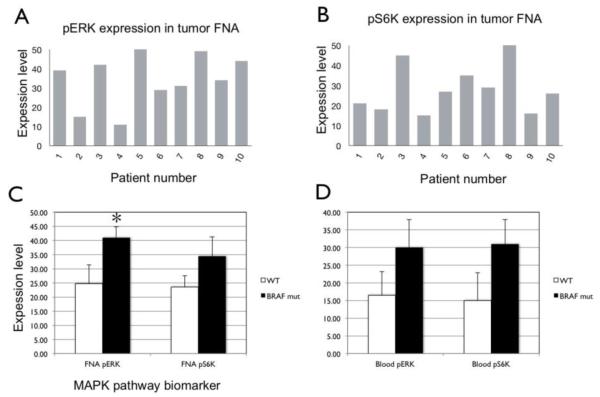
Figure 4.
μNMR assessment of MAPK activity from tumor FNA samples of melanoma pts. Tumor cell expression levels of pERK (A) and pS6K (B) are shown for each patient in the clinical study based on tumor FNA samples. (C) Mean expression levels of pERK and pS6K in BRAF wild-type (white bars) vs BRAF mutant (black bars) patients. Error bars indicate standard error. Asterisk indicates statistical significance (P = 0.0009, Student’s t test).

