

Abstract
Type I interferons (IFN-I) are critical in antimicrobial and antitumor defense. Although IFN-I signal via the interferon-stimulated gene factor 3 (ISGF3) complex consisting of STAT1, STAT2, and IRF9, IFN-I can mediate significant biological effects via ISGF3-independent pathways. For example, the absence of STAT1, STAT2, or IRF9 exacerbates neurological disease in transgenic mice with CNS production of IFN-I. Here we determined the role of IFN-I-driven, ISGF3-independent signaling in regulating global gene expression in STAT1-, STAT2-, or IRF9-deficient murine mixed glial cell cultures (MGCs). Compared with WT, the expression of IFN-α-stimulated genes (ISGs) was reduced in number and magnitude in MGCs that lacked STAT1, STAT2, or IRF9. There were significantly fewer ISGs in the absence of STAT1 or STAT2 versus in the absence of IRF9. The majority of ISGs regulated in the STAT1-, STAT2-, or IRF9-deficient MGCs individually were shared with WT. However, only a minor number of ISGs were common to WT and STAT1-, STAT2-, and IRF9-deficient MGCs. Whereas signal pathway activation in response to IFN-α was rapid and transient in WT MGCs, this was delayed and prolonged and correlated with increased numbers of ISGs expressed at 12 h versus 4 h of IFN-α exposure in all three IFN-I signaling-deficient MGCs. In conclusion, 1) IFN-I can mediate ISG expression in MGCs via ISGF3-independent signaling pathways but with reduced efficiency, with delayed and prolonged kinetics, and is more dependent on STAT1 and STAT2 than IRF9; and 2) signaling pathways not involving STAT1, STAT2, or IRF9 play a minor role only in mediating ISG expression in MGCs.
Keywords: gene expression, glial cell, interferon, interferon regulatory factor (IRF), signal transducers and activators of transcription 1 (STAT1)
Introduction
The type I IFN (IFN-I)3 family which includes multiple IFN-α isoforms and a single IFN-β, plays a pivotal role in antimicrobial and antitumor defense, and IFN-I cytokines are potent regulators of innate and adaptive immunity (reviewed in Refs. 1–3). All IFN-I family members bind to a common heterodimeric cell surface receptor, termed IFNAR, that triggers the Janus kinase (JAK)-mediated phosphorylation of tyrosine on signal transducer and activator of transcription 1 (STAT1) and STAT2 (4, 5). Phosphorylated STAT1 and STAT2 combine with interferon regulatory factor 9 (IRF9) to form a heterotrimeric transcription complex, termed the interferon-stimulated gene factor 3 (ISGF3). The ISGF3 binds to the interferon-stimulated response element (ISRE) in the promoters of interferon-regulated genes (IRGs) to modulate transcriptional activity. In this complex, STAT1 and IRF9 are required for sequence-specific recognition and stable binding with DNA, whereas STAT2 provides transcriptional modulation but is unable to interact with DNA directly (6).
Whereas IFN-I mediate many biological actions through the canonical ISGF3 pathway, the existence of various non-canonical IFN-I signaling pathways has been described (reviewed in Refs. 7 and 8). Studies using mice with targeted disruption of the IFNAR or the genes for the canonical signal transduction molecules STAT1 (9, 10) and STAT2 (11) have provided important insights into the physiological role of non-canonical IFN-I signaling pathways. STAT1 deficiency renders mice highly susceptible to infections with viruses (9, 10). However, STAT1-deficient mice are more resistant than IFNAR-deficient mice to infection with many different viruses, demonstrating that IFN-I can mediate some antiviral responses despite the absence of STAT1 (12–14). In contrast to WT mice that survive and clear LCMV infection, STAT1-deficient mice succumb to a lethal, IFN-I-dependent disease (15, 16). Interestingly, IFN-I also retain the ability to suppress the growth of Legionella pneumophila in macrophages from STAT1 and STAT2 KO mice (17) but not STAT1-STAT2 double KO mice (18). Evidence has emerged that these IFN-I-driven, STAT1-independent host antiviral responses involve, in large part, non-canonical signaling via STAT2 and IRF9 (14, 15). Further support for such a mechanism comes from a number of in vitro studies demonstrating that in response to IFN-I, STAT2 and IRF9 can form transcriptionally active complexes that modulate IRGs and can mediate antiviral and antibacterial responses (14, 18–20).
More direct and dramatic demonstration of the impact of non-canonical signaling in mediating IFN-I actions comes from the study of transgenic mice with CNS-targeted production of IFN-α (termed GFAP-IFNα mice). GFAP-IFNα mice with low levels of transgene-encoded IFN-α develop a mild progressive inflammatory encephalopathy from 8–12 months of age (21, 22). Unexpectedly, markedly more severe disease leading to early death occurs in these animals in the absence of STAT1 (23), STAT2 (24), or IRF9 (25). However, the nature of the neurological disease that afflicts the GFAP-IFNα mice deficient for these factors differs in the case of each factor. For example, in the absence of STAT1, GFAP-IFNα mice develop a severe inflammatory encephalopathy with characteristic calcification of the basal ganglia, whereas in the absence of STAT2, these mice develop medulloblastoma. These observations suggest the existence of diverse non-canonical signaling pathways that can mediate adverse actions of IFN-I in the brain, depending on which canonical factor is absent (26).
The complex milieu of the inflamed CNS does not allow easy differentiation between primary and secondary responses and effects due to CNS resident cells versus infiltrating leukocytes (where present). Transcriptional profiling of cultured murine neurons revealed that these cells do not respond to IFN-I in the absence of STAT1 (27) and therefore are unlikely to be direct targets of IFN-I action in GFAP-IFNα mice that lack STAT1. In contrast, primary murine mixed glial cell cultures (MGCs) that consist primarily of astrocytes with a low number of microglia can signal independently of either STAT1 or IRF9 in response to IFN-α (28), suggesting that these cells represent potential effector cells of IFN-I actions in ISGF3-independent signaling. However, it remains largely unknown to what extent non-canonical, ISGF3-indpendent signaling pathways mediate the functional effects of IFN-I. As a means to addressing this issue, the objective of this study was to investigate the genome-wide transcriptional regulation and signal transduction pathway dynamics in MGCs in response to IFN-α in the presence or absence of each of the ISGF3 canonical signaling molecules STAT1, STAT2, or IRF9.
Results
Untreated MGCs deficient in STAT1, STAT2, or IRF9 have altered expression of a subset of genes
Primary MGCs from WT and STAT1-, STAT2-, or IRF9-deficient mice cultured for one passage showed no overt morphological differences and had comparable growth rates and percentage of microglia (data not shown). Initially, we determined whether the absence of STAT1, STAT2, or IRF9 altered the expression of genes in untreated MGCs. Compared with WT MGCs, the expression of 28 genes was decreased and that of 24 genes was increased in cultures deficient for one of the ISGF3 components (Fig. 1). Of the 28 genes with decreased expression, 12 (Ifi27, Usp18, Rtp4, Ifit1, Oasl2, Rsad2, Isg15, Lgals3bp, Brd4, Trim30, D12Ertd647e, and Xaf1) were expressed at significantly lower levels in the STAT1-, STAT2-, and IRF9-deficient MGCs, whereas the majority of the remaining genes that had decreased expression were observed in the IRF9-deficient MGCs (Fig. 1 and Table 1). Of the 24 genes that showed higher basal expression in the absence of STAT1, STAT2, or IRF9, none were increased in all three signaling-deficient cells, and the majority (14) were increased in the STAT1-deficient MGCs and included Mela, Shisa3, LOC433762, Rhd1, Timp1, Efcab7, Pik3r1, Cd59a, Vcam1, Fst, Crispld2, Nudt6, and two ESTs (Fig. 1 and Table 2).
FIGURE 1.

The distribution of genes with altered expression in untreated MGCs that were deficient for STAT1, STAT2, or IRF9 compared with WT cells. MGCs were prepared from neonatal mouse brain and cultured as described under “Experimental Procedures.” RNA was isolated, processed, and interrogated with Affymetrix Mouse Genome 430 version 2.0 arrays, and data analysis was performed as described under “Experimental Procedures.” Venn diagrams were created for the comparison of genes whose expression was decreased (A) or increased (B) in untreated MGCs from STAT1, STAT2, or IRF9 KO mice in contrast to WT cells. The numbers in the brackets represent the total number of genes whose expression was decreased (A) or increased (B) at least 2-fold in IFN-I signaling-deficient cells when compared with WT cells from two independent experimental array sets.
TABLE 1.
Genes with decreased expression in untreated MGCs that lacked STAT1, STAT2, or IRF9 compared with WT cells
| Accession no. | Gene name | Abbreviation | Decrease in gene expression |
||
|---|---|---|---|---|---|
| STAT1 KO | STAT2 KO | IRF9 KO | |||
| -fold decrease | |||||
| AY090098 | Interferon, α-inducible protein 27 | Ifi27 | 9.3 | 5.4 | 7.1 |
| NM_011909 | Ubiquitin-specific peptidase 18 | Usp18 | 6 | 6.4 | 9 |
| BC024872 | Receptor transporter protein 4 | Rtp4 | 6 | 6.7 | 11.3 |
| NM_008331 | Interferon-induced protein with tetratricopeptide repeats 1 | Ifit1 | 5.4 | 5.3 | 14.4 |
| BQ033138 | 2′-5′-Oligoadenylate synthetase-like 2 | Oasl2 | 4 | 4.3 | 18 |
| BB132493 | Radical S-adenosylmethionine domain-containing 2 | Rsad2 | 3.8 | 3.3 | 3.8 |
| AK019325 | ISG15 ubiquitin-like modifier | Isg15 | 2.5 | 2.5 | 3.7 |
| NM_011150 | Lectin, galactoside-binding, soluble, 3-binding protein | Lgals3bp | 2.5 | 2.6 | 3.4 |
| BC008532 | Bromodomain-containing 4/bone marrow stromal cell antigen 2 | Brd4 / Bst2 | 2.4 | 2 | 2.7 |
| BM240719 | Tripartite motif-containing 30 | Trim30 | 2.4 | 2.1 | 2.4 |
| BB645745 | XIAP-associated factor 1 | Xaf1 | 2.2 | 2.5 | 3.6 |
| BQ084812 | Zinc finger with KRAB and SCAN domains 3 | Zkscan3 | 2.5 | <2 | 2.6 |
| AA960166 | Tripartite motif-containing 25 | Trim25 | 2 | 2 | <2 |
| X82786 | Antigen identified by monoclonal antibody Ki 67 | Mki67 | <2 | 2.4 | <2 |
| BB751387 | RAR-related orphan receptor β | Rorb | <2 | 2.1 | <2 |
| AK016825 | Ring finger protein 41 | Rnf41 | <2 | 2.1 | <2 |
| AJ007909 | Erythroid differentiation regulator 1 | Erdr1 | <2 | <2 | 2.7 |
| AI647999 | Dynein, axonemal, heavy chain 7B | Dnahc7b | <2 | <2 | 2.5 |
| AW214029 | Signal transducer and activator of transcription 1 | Stat1 | <2 | 2.5 | |
| BG073178 | Midline 1 | Mid1 | <2 | <2 | 2.4 |
| NM_018734 | Guanylate nucleotide-binding protein 3 | Gbp3 | <2 | <2 | 2.4 |
| BG092512 | Macrophage activation 2-like | Mpa2l | <2 | <2 | 2.2 |
| NM_019440 | Interferon-inducible GTPase 2 | Iigp2 | <2 | <2 | 2.2 |
| NM_010501 | Interferon-induced protein with tetratricopeptide repeats 3 | Ifit3 | <2 | <2 | 2.1 |
TABLE 2.
Genes with increased expression in untreated MGCs that lack STAT1, STAT2, or IRF9 compared with WT cells
| Accession no. | Gene name | Abbreviation | Increase in gene expression |
||
|---|---|---|---|---|---|
| STAT1 KO | STAT2 KO | IRF9 KO | |||
| -fold increase | |||||
| AV381752 | Ceruloplasmin | Cp | 4.7 | 3.1 | <2 |
| AI481026 | Insulin-like growth factor binding protein 7 | Igfbp7 | 2.7 | 2.5 | <2 |
| BB794642 | Melanoma antigen | Mela | 161.4 | <2 | <2 |
| BB740315 | Shisa homolog 3 (Xenopus laevis) | Shisa3 | 6.6 | <2 | <2 |
| AY140896 | Murine leukemia virus LI-12 truncated pol/envelope fusion protein | Mlvpe | 3.7 | <2 | <2 |
| BF580235 | Murine leukemia virus isolate 10 envelope protein | Mlve | 3.3 | <2 | <2 |
| BE852181 | Rho family GTPase 1 | Rnd1 | 3 | <2 | <2 |
| BC008107 | Tissue inhibitor of metalloproteinase 1 | Timp1 | 2.9 | <2 | <2 |
| BC020077 | EF-hand calcium binding domain 7 | Efcab7 | 2.8 | <2 | <2 |
| M60651 | Phosphatidylinositol 3-kinase, regulatory subunit, polypeptide1 (p85 α) | Pik3r1 | 2.8 | <2 | <2 |
| AK005507 | CD59a antigen | Cd59a | 2.7 | <2 | <2 |
| L08431 | Vascular cell adhesion molecule 1 | Vcam1 | 2.6 | <2 | <2 |
| BB444134 | Follistatin | Fst | 2.6 | <2 | <2 |
| BB558800 | Cysteine-rich secretory protein LCCL domain containing 2 | Crispld2 | 2.2 | <2 | <2 |
| BB043522 | Nudix (nucleoside diphosphate linked moiety X)-type motif 6 | Nudt6 | 2 | <2 | <2 |
| X14607 | Lipocalin 2 | Lcn2 | <2 | 8.6 | <2 |
| BC027285 | Interferon-induced transmembrane protein 1 | Ifitm1 | <2 | 2.6 | <2 |
| NM_023143 | Complement component 1, r subcomponent | C1r | <2 | 2.5 | <2 |
| BQ031098 | WD repeat and FYVE domain containing 1 | Wdfy1 | <2 | <2 | 6 |
| BB093204 | Zinc finger with KRAB and SCAN domains 1 | Zkscan1 | <2 | <2 | 4.2 |
| NM_009263 | Secreted phosphoprotein 1 | Spp1 | <2 | <2 | 2.1 |
Interestingly, among the 28 genes with decreased basal expression and 24 genes with increased basal expression in the signaling-deficient cells, 21 of these (Iigp2, Usp18, Gbp3, Rtp4, Trim25, Rsad2, Bst2, Ifi27, Isg15, Fst, Xaf1, Lgal3bp, Stat1, and Ifit1 and Wdfy1, Spp1, C1r, Ifitm1, Pik3rl, Cd59a, and Vcam1 with decreased and increased expression, respectively) were recognized as IRGs as determined by INTERFEROME (29). In addition, DAVID bioinformatics analysis classified 17 of these 52 genes into three functional biological groups: 1) antiviral response (genes with decreased expression in the IFN-I deficient cells (Isg15, Ifi27, Ifit1, Ifit3, Oasl2, Rsad2, and Trim25) and genes with increased expression in IFN-I signaling-deficient cells (Lcn2 and Ifitm1)), 2) proteolysis (genes with decreased expression in the IFN-I signaling-deficient cells (Isg15, Usp18, Rnf41, and Mid1) and genes with increased expression in IFN-I signaling-deficient cells (Ctse, Mela, and C1r), and 3) retroviral envelope polyprotein (genes with increased expression in STAT1-deficient cells (Mela, LOC433762, and murine leukemia virus isolate 10 envelope protein mRNA). Overall, these findings showed that all three canonical IFN-I signaling molecules regulate the constitutive expression of a subset of genes that are involved in the antiviral response, proteolysis, and retroviral envelope polyprotein production.
Differential requirement for STAT1, STAT2, or IRF9 in the response of MGCs to IFN-α
To examine the requirement for STAT1, STAT2, or IRF9 in IRG expression, WT and STAT1-, STAT2-, and IRF9-deficient MGCs were treated with IFN-α for 4 or 12 h. Treatment of WT MGCs with IFN-α for 4 h significantly increased the expression of 268 genes (Fig. 2A). In comparison, the response to IFN-α was severely blunted with significantly fewer genes up-regulated in the absence of STAT1 (17 genes), STAT2 (8 genes), or IRF9 (38 genes). All of the genes up-regulated in the STAT1- and STAT2-deficient cells as well as 28 genes in the IRF9 KO MGCs were also increased in WT MGCs. Interestingly, the expression of 10 genes was increased in IRF9 KO MGCs only (see below for details). In WT MGCs after 12 h of treatment, the number of ISGs decreased to 137 (Fig. 2B), of which 123 were also increased at 4 h of treatment, whereas 14 ISGs were present at 12 h of treatment only (Fig. 2D). In contrast to WT MGCs, the number of ISGs after 12 h of IFN-α treatment increased in STAT1-deficient (33 genes), STAT2-deficient (21 genes), or IRF9-deficient (113 genes) MGCs. Of these genes, all in the STAT1 KO cells, 20 in the STAT2 KO cells, and 66 in the IRF9 KO cells were also up-regulated in WT MGCs (Fig. 2B). The expression of one gene was increased in both STAT2 KO and IRF9 KO MGCs, whereas the expression of 47 genes was increased in IRF9 KO MGCs only (Fig. 2B). Notably, in all three IFN-I signaling factor-deficient MGCs, there was a delayed response to IFN-α with increased expression of the majority of genes occurring after 12 h of treatment (Fig. 2, E–G). In summary, these results indicated that although considerably reduced compared with WT, IFN-α can mediate the increased expression of a number of genes with either prolonged or delayed kinetics in MGCs via ISGF3-independent signaling pathways. Finally, the number of ISGs was significantly less in STAT1 KO and STAT2 KO MGCs than in IRF9 KO MGCs, suggesting that the regulation of ISGF3-independent genes in response to IFN-α is mainly dependent on STAT1 and STAT2 signaling and to a lesser extent on IRF9 signaling.
FIGURE 2.

The distribution of IFN-α-stimulated genes in MGCs from WT, STAT1 KO, STAT2 KO, or IRF9 KO mice. MGCs were treated with IFN-α (1000 units/ml) for the times shown, and RNA was isolated as described under “Experimental Procedures.” Purified RNA was processed and interrogated with Affymetrix Mouse Genome 430 2.0 arrays, and data analysis was performed as described under “Experimental Procedures.” Venn diagrams were created for the comparison of gene expression profiles in response to IFN-α between the four genotypes studied (WT, STAT1 KO, STAT2 KO, and IRF9 KO) and between 4 and 12 h of IFN-α treatment for each genotype. The numbers in the brackets represent the total number of genes up-regulated in expression at least 2-fold in each genotype from two independent experimental array sets. A, comparison of gene expression profile between the four genotypes following 4 h of IFN-α treatment. B, comparison of gene expression profile between the four genotypes following 12 h of IFN-α treatment. C, comparison of gene expression profile between the four genotypes independent of time of treatment. Comparison of gene expression profiles between 4 and 12 h of IFN-α treatment for each of four genotypes: WT (D), STAT1 KO (E), STAT2 KO (F), and IRF9 KO (G).
To better understand the regulation of the ISGs in the context of dependence on STAT1, STAT2, or IRF9, we combined both time points, as shown in Fig. 2C. Of the 283 ISGs in WT, 50 ISGs were found to be shared with STAT1-, STAT2-, and IRF9-deficient MGCs, whereas 45 ISGs were common to IRF9-deficient MGCs, indicating that ISGF3 and non-ISGF3 IFN-I signaling pathways regulate a substantial number (i.e. 95) of the same target genes. Of these 95 genes, the expression of only 9 genes was increased in WT and in all three IFN-I signaling-deficient MGCs. This small subset of genes were classified as STAT1-, STAT2-, and IRF9-independent ISGs and indicated that there is only minor involvement of other signaling factors, such as STAT3 and ERK1/2, in IRG expression in MGCs. The expression of the remaining 86 ISGs required at least one of the remaining ISGF3 factors. More than 30% of ISGs regulated in WT MGCs were also found to be regulated in at least one of the IFN-I signaling factor-deficient MGCs, demonstrating the ISGF3-independent regulation of these genes by IFN-α in these cells (Fig. 3). It should be noted that the expression level of these 95 genes was higher in WT MGCs than in the signaling factor-deficient MGCs, showing that the optimal expression of these genes is dependent on ISGF3.
FIGURE 3.

Heat map for the expression of 95 ISGF3-independent genes in response to IFN-α. MGCs were treated with IFN-α (1000 units/ml) for the times shown, and RNA was isolated as described under “Experimental Procedures.” Purified RNA was processed and interrogated with Affymetrix Mouse Genome 430 2.0 arrays, and data analysis was performed as described under “Experimental Procedures.” Heat maps were generated by hierarchical gene clustering using Multi Experimental Viewer (32). Each individual gene expression level was normalized as described under “Experimental Procedures” and plotted on a log2 scale, with blue representing low expression and yellow representing high expression.
We next analyzed the IFN-α-regulated genes with decreased expression in the MGCs (Fig. 4). In WT MGCs, treatment with IFN-α for 4 and 12 h caused decreased expression of 12 genes (C5ar1, Gls, Hpgd, Iqub, Sesn1, Gprin2, Ablim1, Fbxo16, Dbndd1, Klhl24, and two ESTs) and two genes (Gls and one EST), respectively, with Gls being down-regulated at both time points (Fig. 4, A and B). Interestingly, no genes showed decreased expression in IFN-α-treated STAT1 KO MGCs at either treatment time. In STAT2 KO MGCs, the expression of eight genes (Arhgap5, Lpar4, Copg2as2, Tmed5, Atrx, Ccdc88a, Smc4, and Casp8ap2) was down-regulated at 4 h, but no genes were decreased in expression at 12 h. In IRF9 KO MGCs, the expression of five genes (Mtss1, Kcnq1ot, D17Ertd165e, Dzip1, and D2Ertd105e) and three genes (Hpgd, Cx3cr1, and Gls) was decreased at 4 and 12 h, respectively, with no genes down-regulated at both time points. The expression of two genes (Gls and Hpgd) was down-regulated in both WT and IRF9 KO MGCs following treatment with IFN-α, irrespective of the time (Fig. 3C). The expression of 27 transcripts that was down-regulated in WT MGCs and/or MGCs that lacked either STAT2 or IRF9 is shown in Fig. 3D. Overall, these findings indicated that in contrast to ISGs, the number of genes whose expression was down-regulated in MGCs in response to IFN-α was considerably less and was dependent on STAT1.
FIGURE 4.

Genes with decreased expression in MGCs from WT or STAT1, STAT2, or IRF9 KO mice following 4 and 12 h of treatment with IFN-α. MGCs were treated with IFN-α (1000 units/ml) for the times shown, and RNA was isolated as described under “Experimental Procedures.” Purified RNA was processed and interrogated with Affymetrix Mouse Genome 430 2.0 arrays, and data analysis was performed as described under “Experimental Procedures.” Venn diagrams were created for the comparison of gene expression profiles in response to IFN-α between the four genotypes studied (WT, STAT1 KO, STAT2 KO, and IRF9 KO MGCs). The numbers in the brackets represent the total number of genes down-regulated in expression by least 2-fold in each genotype from two independent experimental array sets. A, comparison of gene expression profile between the four genotypes following 4 h of IFN-α treatment. B, comparison of gene expression profile between the four genotypes following 12 h of IFN-α treatment. C, comparison of gene expression profile between the four genotypes independent of time of treatment. D, a heat map showing the expression of 27 genes whose expression was decreased in response to IFN-α. The expression of 27 genes whose expression was decreased in WT, STAT2 KO, and IRF9 KO MGCs in response to IFN-α is shown by a heat map generated by hierarchical gene clustering using Multi Experimental Viewer (32). Each individual gene expression level was normalized as indicated under “Experimental Procedures” and plotted on a log2 scale, with blue representing low expression and yellow representing high expression.
Functional annotation of ISGF3-independent ISGs in MGCs
The Ingenuity pathway analysis (IPA) tool (Ingenuity Systems, Redwood City, CA) was used to cluster genes according to their biological processes. The 95 IFN-α-stimulated, ISGF3-independent ISGs were clustered into a number of functional groups, including IFN signaling, antigen presentation, activation of IRFs by cytosolic pattern recognition receptors, retinoic acid-mediated apoptosis, protein ubiquitination, and pattern recognition receptor recognition of bacteria and viruses (Table 3). Similarly, the 188 ISGF3-dependent gene transcripts whose expression was increased only in WT cells also belonged to these functional groups. Hence, these results implied that ISGF3-independent IFN-I signaling pathways could generate, in part, the classical IFN-α response, especially related to antiviral actions.
TABLE 3.
Ingenuity pathway analysis of functional groups enriched in ISGF3-independent genes
| Ingenuity functional group | p | ISGF3-independent genes |
|---|---|---|
| Interferon signaling | 8.20E−12 | Ifi35, Ifit3, Irf9, Irf1, Oasl2, Psmb8, Stat1, Stat2, Tap1 |
| Antigen presentation | 1.60E−08 | HLA-B, HLA-E, Psmb8, Psmb9, Tap1, Tap2 |
| Activation of IRF by cytosolic pattern recognition receptors | 2.50E−08 | Ddx58, Ifih1, Irf7, Irf9, Stat1, Stat2, Zbp1 |
| Retinoic acid-mediated apoptosis signaling | 2.30E−07 | Irf1, Parp3, Parp9, Parp12, Parp14, Zc3hav1 |
| Protein ubiquitination | 3.80E−06 | HLA-B, Psmb8, Psmb9, Psmb10, Psme1, Psme2, Tap1, Tap2, Ube2l6, Usp18 |
| Role of pattern recognition receptors in recognition of bacteria and virus | 2.60E−05 | Casp1, Ddx58, Ifih1, Irf7, Myd88, Nod1, Oasl2 |
The IPA tool was also used to identify potential upstream regulators of these genes. Analysis of the ISGF3-independent ISGs indicated that besides STAT1, STAT2, and IRF9, other transcription factors, including IRF1, IRF2, IRF3, IRF7, STAT3, STAT4, STAT6, NFκB, and ERK1/2, might participate in the regulation of a subset of the 95 genes (Table 4). In addition, the type II IFN, IFN-γ, triggers the activation and formation of a STAT1 homodimer, called the IFN-γ-activated transcription factor (GAF), which recognizes the IFN-γ-activated sequence (GAS) element present in the promoter region of IFN-γ-regulated genes. The IPA analysis revealed that the expression of Gbp2, Gbp4, Gbp6, and Cd274 that were up-regulated in IFN-α-treated cells that lack STAT2 or IRF9 and of Casp1, Casp4, Ccl4, Cmpk2, and Cxcl10 that were increased in IFN-α-treated IRF9 KO cells can also be induced by IFN-γ. Thus, these results suggested a possible role for IFN-α-mediated STAT1 homodimer formation in the absence of STAT2 or IRF9. Taken together, IPA analysis suggested the possibility of other signaling molecules, such as IRFs and other STATs, in regulating the expression of ISGF3-independent genes; however, the microarray results indicated that functionally, STAT1, STAT2, or IRF9 are the major signaling factors involved in the non-canonical IFN-I signaling because only a small number of ISGs were induced in all three IFN-I signaling-deficient cells.
TABLE 4.
Transcription factors identified by Ingenuity pathway analysis that regulate IFN-α-stimulated genes in ISGF3-independent signaling
| Transcription factor | p | Genes |
|---|---|---|
| STAT1 | 1.10E−43 | Casp1, Casp4, Ccl4, Cd274, Cmpk2, Cxcl10, Gbp2, Gbp6, Herc6, Ifi204 |
| IRF3 | 4.10E−14 | Ccl13, Ccl4, Cxcl10, Ddx58, Ifih1, Ifit1b, Irf7, Rsad2, Zbp1 |
| STAT3 | 4.20E−13 | Casp1, Ccl4, Cxcl10, Gbp2, Ifi204, Ifi35, Ifit1b, Irf1, Psmb8, Psmb9 |
| STAT6 | 5.10E−11 | Ccl13, Cxcl10, Gbp2, Ifi204, Ifit3, Irf1, Isg20, Lgals3bp, Ly6a, Mov10 |
| STAT2 | 2.50E−09 | Ifit1b, Ifit3, Irf1, Irf7, Irf9 |
| IRF9 | 9.80E−07 | Irf1, Stat1, Stat2, Tgtp1 |
| NFκB (complex) | 2.10E−06 | Ccl4, Cxcl10, Ifit1b, Irf1, Nmi, Stat1 |
| STAT4 | 5.70E−06 | Cxcl10, Ifih1, Ifit1b, Isg20, Trim30 |
| IRF2 | 9.70E−05 | Cxcl10, Irf1, Irf7 |
| IRF7 | 8.90E−04 | Ifit1b, Zbp1 |
| IRF1 | 1.70E−03 | Casp1, Gbp2, Il18bp |
The induction of 37 ISGs was found only in the absence of IRF9, demonstrating a unique response to IFN-α in IRF9-deficient MGCs. According to the IPA analysis, 20 of these 37 genes (Arg1, Casp12, Ccl3, Cd83, Cdh1, Crem, Csf2rb, Ctsc, Erap1, Fcgr1a, Fcgr2b, Fcgr3, HLA-DMa, HLA-Ab1, Icam1, Irf8, Lcp2, Socs3, Tnfaip2, and Zfp36) were identified as being inducible by IFN-γ. Also, transcription factors, such as the NFκB complex, STAT1, STAT3, STAT5A, and STAT6, were identified by the IPA to potentially regulate the expression of some of these genes (Table 5). In addition, the Genomatix analysis showed that most of the remaining genes (Ggct, Gatm, Gpr84, Clec7a, G530611006Rik, Hk3, Nfil3, Osmr, Snx10, Tgm2, and Tmem173) that were not classified as IFN-γ-regulated genes by IPA had GAS elements in their promoters. Furthermore, this unique subset of genes whose expression was only increased in the absence of IRF9 in response to IFN-α could be classified in similar functional groups as 95 ISGF3-independent genes, including the immune response (Clec7a, Fcgr1a, Fcgr2a, Fcgr2b, Ccl3, Erap1, Irf8, Tmem137, HLA-DMa, HLA-Ab1, HLA-Aa, and Icam1), antigen presentation (Fcgr1a, Fcgr2a, Fcgr2b, HLA-DMa, HLA-Ab1, HLA-Aa, and Icam1), and apoptosis (Fcgr1a, Fcgr2b, Cdh1, Casp12, and Tgm2) as determined by DAVID bioinformatics analysis. Therefore, these results suggested that in the absence of IRF9, IFN-α induced a dominant IFN-γ-like response.
TABLE 5.
Transcription factors identified by Ingenuity pathway analysis that were involved in regulating the IFN-α stimulated genes in the absence of IRF9
| Transcription factor | p | Genes |
|---|---|---|
| NFκB (complex) | 1.51E−09 | Ccl3l1, Cd83, Crem, Erap1, Fcgr1a, Icam1, Socs3, Tgm2, Tnfaip2, Zfp36 |
| STAT1 | 1.67E−07 | Fcgr1a, Irf8, Ccl3l1, Icam1, Arg1, Socs3, Crem |
| STAT3 | 1.95E−07 | Arg1, Ccl3l1, Cd83, Cdh1, Fcgr1a, HLA-DMa, Icam1, Socs3 |
| STAT5A | 5.06E−06 | Ccl3l1, Icam1, Socs3, Zfp36, Cdh1 |
| STAT6 | 3.47E−05 | Arg1, Ccl3l1, Fcgra1, Fcgr2A, Zfp36 |
Confirmation of microarray findings in IFN-α-treated MGCs
To validate the microarray results, the expression of a subset of IFN-α-regulated ISGF3-independent genes in MGCs was analyzed further by an RNase protection assay (RPA) (Fig. 5). For this analysis, genes were selected from the DNA microarray data that showed the most robust changes in expression in the absence of STAT1, STAT2, or IRF9 following IFN-α treatment. In WT MGCs treated with IFN-α for 4 h, ISGs involved in transcription (Stat1, Stat2, Irf9, and Irf7), GTPase activity (Gbp6, Ifi47, and Iigp1), antiviral response (Oasl2 and Zbp1), negative regulation of IFN signaling (Socs1 and Socs3), and other functional gene groups (Rtp4 and Cd69) were increased significantly or induced (Fig. 5). The expression of all of these genes except Socs3 was sustained after 12 h of IFN-α treatment. In STAT1 KO cells, the expression of four genes (Stat2, Gbp6, Oasl2, and Rtp4) was significantly increased after 4 h of IFN-α treatment and increased further after 12 h of treatment, whereas the expression of an additional five genes (Irf7, Irf9, Ifi47, Zbp1, and Igp1) was significantly increased following 12 h of IFN-α treatment only (Fig. 5). In the STAT2 KO cells, the expression of Ifi47 and Socs3 was significantly increased at 4 h and further increased (Ifi47) or sustained (Socs3) after 12 h, whereas the expression of Stat1, Gbp6, Oasl2, Rtp4, Zbp1, Iigp, and Socs1 was increased significantly following 12 h of treatment only (Fig. 5). In the IRF9 KO cells, Stat1, Stat2, Gbp6, Ifi4, Zbp1, and Socs3 were significantly increased at 4 h, and this was sustained (Stat2 and Socs3) or further increased (Stat1, Gbp6, Ifi47, and Zbp1) with longer treatment (Fig. 5). All of the remaining genes (Cd69, Oasl2, Rtp4, Iigp1, and Socs1) that were increased in the WT cells were also significantly up-regulated in the IRF9 KO cells only after 12 h of treatment (Fig. 5). Of note, the tumor suppressor gene Cdh1 and the IFN-γ-regulated transcription factor, Irf8, were significantly induced in the absence of IRF9 only after exposure to IFN-α at 4 and 12 h. Overall, the changes in the mRNA levels for the ISGs determined by microarray analysis were paralleled by the RPA findings, thus validating the microarray data.
FIGURE 5.

Confirmation of microarray data for selected genes whose expression increased in MGCs from STAT1, STAT2, or IRF9 KO mice in response to IFN-α. MGCs were treated with IFN-α (1000 units/ml) for the times shown, and RNA was isolated as described under “Experimental Procedures.” Purified RNA (10 μg/sample) was analyzed by RPA. Quantification of the autoradiographs was performed by densitometry using NIH Image software (version 1.47). Values were normalized to the housekeeping gene L32 and shown as mean ± S.E., n = 3 biological replicates. *, p < 0.05, compared with untreated sample by Mann-Whitney U test.
New protein synthesis was required for ISG expression at 12 h in STAT1 KO MGCs
We asked next whether the delayed ISG response in the IFN-I signaling mutant MGCs reflected a requirement for the accumulation of active transcription factors. MGCs isolated from WT and STAT1 KO mice were treated with IFN-α for 4 and 12 h in the presence or absence of the protein translation inhibitor cycloheximide (CHX), and the expression of three STAT1-independent ISGs, Oasl2, Rtp4, and Iigp1, was examined. In WT MGCs, IFN-α stimulated the expression of these genes at 4 h, whereas the expression of the Rtp4 and Iigp1 genes was decreased, and the expression of Oasl2 was sustained at 12 h (Fig. 6). In the case of all three ISGs, in the presence of CHX, the level of expression was significantly higher at 4 h and further increased at 12 h after IFN-α treatment compared with non-CHX-treated WT MGCs. In STAT1-deficient MGCs, the expression of the Rtp4 and Oasl2 genes was induced at 4 h and further increased significantly at 12 h following IFN-α treatment, whereas expression of the Iigp gene was only induced at 12 h (Fig. 6). In these cells, treatment with CHX had little effect on the increased expression of the Rtp4 and Oasl2 genes at 4 h of treatment but blocked the further increase in expression at 12 h. In addition, CHX treatment abolished the induction of the Iigp gene at 12 h. These results suggested that the induction of Oasl2 and Rtp4 gene expression at 4 h in non-CHX-treated STAT1 KO cells is dependent on preexisting transcription factors, but the further increase in expression of Oasl2 and Rtp4 and the induction of Iigp1 at 12 h in these cells is dependent on new protein synthesis.
FIGURE 6.

Effect of cycloheximide on ISGs in WT and STAT1 KO MGCs. MGCs isolated from WT and STAT1 KO mice were treated with IFN-α (1000 units/ml) for 4 and 12 h in the presence or absence of CHX (10 μg/ml), and RNA was isolated as described under “Experimental Procedures.” The expression of three STAT1-independent ISGs, Oasl2, Rtp4, and Iigp1, was examined on purified RNA by RPA. Quantification of the autoradiographs was performed by densitometry. Values were normalized to the housekeeping gene L32 and shown as mean ± S.E., n = 3 biological replicates. *, p < 0.05; **, p < 0.01; ***, p < 0.001 compared with untreated sample by one-way analysis of variance.
Evidence of signal transduction molecule activation in IFN-α-treated MGCs
The microarray results indicated that ISGF3-independent ISG expression involved primarily STAT1, STAT2, and/or IRF9, whereas IPA analysis revealed the possibility that other transcription factors may also regulate ISGF3-independent gene expression in response to IFN-α. Therefore, we next investigated the activation of some candidate signal transduction pathway molecules in the IRG response at different times. Whereas the basal levels of STAT1 or STAT2 were lower in the absence of STAT2 and IRF9 or STAT1 and IRF9, respectively, STAT3 and ERK1/2 levels were comparable across all of the genotypes (Fig. 7). Following IFN-α treatment, WT MGCs responded with a transient increase in pY-STAT1, pY-STAT2, pY-STAT3, and pT/Y-ERK1/2 at 0.3 h that decreased to almost basal levels by 12 h, whereas pS-STAT1 was prolonged and increased to similar levels at 0.3 and 12 h. Total STAT1 and STAT2 but not STAT3 or ERK1/2 were increased at 12 h post-treatment. Compared with similarly treated WT, IFN-α-treated STAT1 KO MGCs responded with a progressive increase in pY-STAT2 and STAT2; however, the overall levels were lower (Fig. 7). The level of pY-STAT3 also increased and peaked at 0.3 h before declining slightly at 12 h in STAT1 KO MGCs, whereas activation of pT/Y-ERK1/2 was similar to that in WT MGCs. Following IFN-α treatment of STAT2 KO cells, pY-STAT1 and pS-STAT1 increased to similar levels at 0.3 and 12 h, whereas a more prolonged increase in pY-STAT3 and pT/Y-ERK1/2 was seen (Fig. 7). In IRF9 KO cells, IFN-α stimulated a prolonged increase in pY-STAT1, pS-STAT1, pY-STAT2, and pY-STAT3 from 0.3 to 12 h, whereas pT/Y-ERK1/2 increased at 0.3 h but decreased back to untreated levels by 12 h (Fig. 7). In addition, both STAT1 and STAT2 levels were increased at 12 h following treatment. In summary, these results indicated that, similar to WT MGCs, IFN-α treatment induced the phosphorylation of STAT1 (in STAT2- and IRF9-deficient MGCs), STAT2 (in STAT1- and IRF9-deficient MGCs), STAT3 (in STAT1-, STAT2-, and IRF9-deficient MGCs), and ERK1/2 (in STAT1-, STAT2-, and IRF9-deficient MGCs) in IFN-I-signaling mutant MGCs. However, with the exception of pS-STAT1 that showed kinetics similar to that of WT, the kinetics of this response was altered in the IFN-I signaling mutant MGCs, being more prolonged and increasing with time.
FIGURE 7.
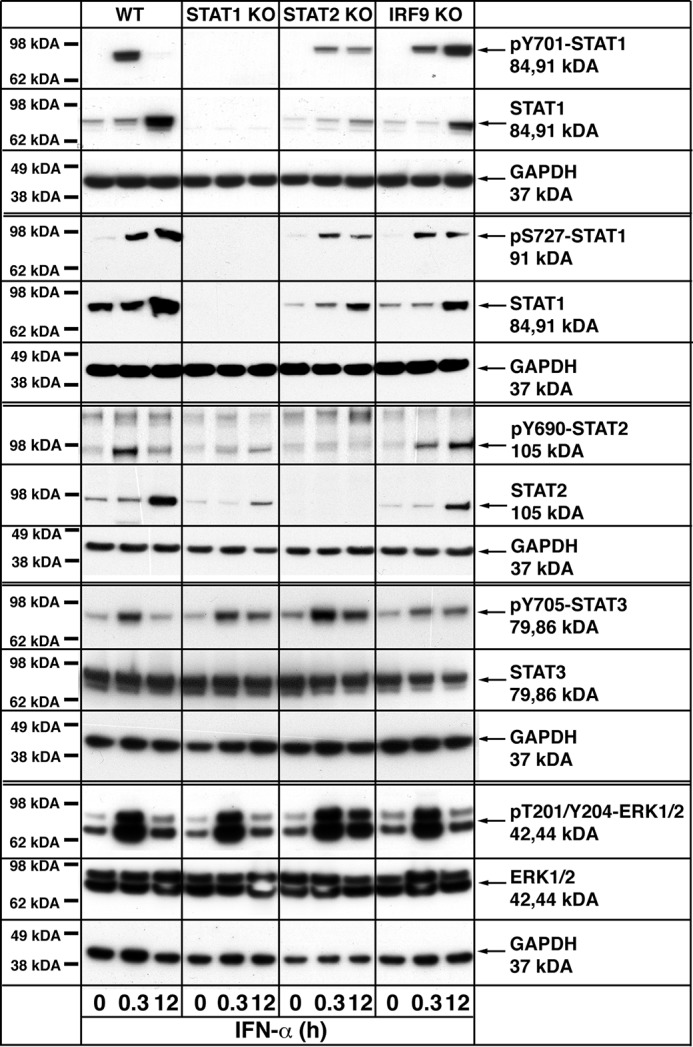
Signal transduction pathway activation in WT and IFN-I signaling factor-deficient mixed glial cells in response to IFN-α. MGCs were treated with IFN-α (1000 units/ml) for the times shown, and protein lysates were prepared as described under “Materials and Methods.” Immunoblot analysis (20 μg of protein/sample) was performed to examine the level of pY-STAT1, pS-STAT1, STAT1, pY-STAT2, STAT2, pY-STAT3, STAT3, pT/Y-ERK1/2, and ERK1/2. Immunoblots are representative of three independent experiments.
Confirmation of ISG expression in the brain of GFAP-IFNα mice
To investigate the significance of the microarray data further and the extent to which selected IRGs were regulated by IFN-α in vivo, RNA from the brain of GFAP-IFNα mice and of GFAP-IFNα mice that lacked either STAT1 or IRF9 was analyzed. Due to the early mortality and tumor phenotype of GFAP-IFNα × STAT2 KO mice (24), these animals were not included in this study. Similar to IFN-α-treated WT MGCs, Irf7, Irf9, Stat1, Stat2, Cd69, Gbp6, Ifi47, Oasl2, Rtp4, Zbp1, and Iigp1 mRNA levels were all increased significantly in the brain of GFAP-IFNα mice. Although Cdh1 mRNA was not increased in IFN-α-treated WT MGCs, the level of this transcript was increased significantly in the brain of GFAP-IFNα mice (Fig. 8). In the brain of GFAP-IFNα × STAT1 KO mice, Irf7, Gbp6, Ifi47, Oasl2, Rtp4, Zbp1, and Iigp1 mRNAs were increased significantly, whereas Stat2 mRNA, which was increased in IFN-α-treated STAT1-deficient MGCs, was not altered in the brain of GFAP-IFNα × STAT1 KO mice (Fig. 8). With the exception of Irf7 and Zbp1 mRNAs that were increased to similar or higher levels, the level of expression of the remaining ISGs was lower in GFAP-IFNα × STAT1 KO mice compared with GFAP-IFNα mice. Genes that were up-regulated in the IFN-α-treated IRF9 KO MGCs (Irf8, Stat1, Stat2, Cd69, Gbp6, Cdh1, Ifi47, Oasl2, Rtp4, Zbp1, and Iigp1) were also significantly up-regulated to high levels in the GFAP-IFNα mice that lacked IRF9 (Fig. 8). Moreover, Irf8 mRNA was significantly increased in the brain of GFAP-IFNα mice lacking IRF9 but was not increased in the brain of GFAP-IFNα or GFAP-IFNα × STAT1 KO mice. Conversely, Irf7 mRNA, which was significantly up-regulated in the brain of GFAP-IFNα mice and GFAP-IFNα × STAT1 KO mice, was not increased in the brain of GFAP-IFNα × IRF9 KO mice. Of note, Irf8, Cd69, Gbp6, Cdh1, Ifi47, Zbp1, and Iigp1 mRNAs were significantly higher in the GFAP-IFNα × IRF9 mice than in GFAP-IFNα mice. In summary, there was good concordance between the in vitro findings in the WT and mutant MGCs when compared with brain from the GFAP-IFNα mice and GFAP-IFNα mice lacking the canonical IFN-I-signaling factors STAT1 or IRF9.
FIGURE 8.

Selected ISG mRNA levels in the brain from GFAP-IFNα mice and GFAP-IFNα mice that lacked STAT1 or IRF9. The biological significance of selected IFN-α-stimulated STAT1-, STAT2-, or IRF9-independent genes obtained from microarray analysis was investigated in WT, GFAP-IFNα, STAT1 KO, GFAP-IFNα STAT1 KO, IRF9 KO, and GFAP-IFN-α IRF9 KO mice. Mice (2 months old) were anesthetized, the brains were immediately removed, and total RNA was isolated. Purified RNA (10 μg/sample) was analyzed by RPA. Quantification of the autoradiographs was performed by densitometry. Values were normalized to the housekeeping gene L32 and shown as mean ± S.E., n = 3 biological replicates. *, p < 0.05, compared with untreated sample by Mann-Whitney U test.
Discussion
Here we examined the role of ISGF3-independent IFN-I signaling in regulating the global transcriptional changes in MGCs missing each ISGF3 factor. Interestingly, the basal expression of a subset of genes in MGCs was regulated by STAT1, STAT2, and IRF9 in the absence of IFN-I treatment and without detectable phosphorylation of STAT1 and STAT2. These findings are in accordance with previous reports that unphosphorylated STAT1 (30–32) and STAT2 (11, 33) direct the constitutive expression of some genes in different cell types, which is probably driven by the constitutive nucleo-cytoplasmic shuttling of unphosphorylated STAT1 (34) and STAT2 in combination with IRF9 (35). In addition, a large number of putative STAT1 DNA binding regions were identified in unstimulated HeLa S3 cells (36), whereas a high number of ISG promoters were shown to be occupied by unphosphorylated STAT2 (37). Of the genes constitutively expressed in untreated MGCs, 43% were common to MGCs lacking each ISGF3 factor, and according to the INTERFEROME database (29), the majority of these genes were identified as ISGs. This suggests that under basal conditions, the expression of this subset of genes is controlled by tonic ISGF3/ISRE signaling. In addition to these changes in ISG transcripts, we observed that the levels of the STAT1 and STAT2 proteins were reduced in untreated IFN-I signaling-deficient MGCs compared with WT cells. These findings are congruent with those of a previous report that found that STAT1 levels are significantly reduced in primary MEFs lacking the IFNAR (38), whereas the absence of STAT2 in murine macrophages also is associated with reduced levels of STAT1 (33) and indicates that IFN-I-mediated, ISGF3-dependent signaling is required for homeostatic maintenance of basal levels of the canonical signaling molecules. In support of this conclusion, under basal conditions, extremely low levels of constitutively produced IFN-β maintain the optimum expression levels of the ISGF3 factors (39). Moreover, a recent study also showed that ISG promoters that are sensitive to tonic IFN-I signaling have high binding affinity for STAT1 and STAT2 (40). Nevertheless, whereas it is possible that such tonic signaling is regulated by constitutive low levels of IFN-I produced by MGCs, this remains to be confirmed in these cells.
Our studies also identified a second subset of genes that were down-regulated in untreated IFN-I signaling-deficient MGCs that, in contrast to those up-regulated and despite a number of these genes being categorized as classical IRGs, showed no dependence on all three ISGF3 factors. The majority of these down-regulated genes were dependent on STAT1 alone, highlighting an ISGF3-independent role for STAT1 in repressing specific genes under basal conditions in MGCs. Interestingly, three transcripts that were significantly up-regulated in untreated STAT1-deficient MGCs belonged to endogenous retroviruses, suggesting that STAT1 may have a unique role in repressing the expression of certain endogenous retroviral genes. Although a possible role for STAT1 in the cellular defense against activation of endogenous retroviral genes has not been reported previously, a strong association was reported between murine leukemia virus integration sites and STAT1 binding sites in IFN-γ-stimulated HeLa cells (41).
Whereas the expression of most IRGs in MGCs relied on the canonical ISGF3 signaling pathway, IFN-α regulated the expression of a subset of genes independently of STAT1, STAT2, or IRF9, indicating the involvement of non-canonical IFN-I signaling pathways in regulating gene transcriptional output in these cells. Overall, this response in WT and IFN-I signaling-deficient MGCs was overwhelmingly dominated by ISGs, with the expression of relatively few genes being down-regulated by IFN-α. However, the relative level of expression of many of these ISGs in the IFN-I signaling-deficient MGCs was significantly lower than in WT MGCs. This indicates that ISGF3-independent signaling could only partially compensate for the lack of these signaling factors and that the optimal expression of ISGs requires the canonical ISGF3 complex. Furthermore, both the number and level of expression of ISGs were significantly higher in IRF9-deficient MGCs than in cells that lacked STAT1 or STAT2. Therefore, the findings suggest that non-canonical IFN-I signaling was primarily dependent on STAT1 and STAT2 and, to a lesser extent, on IRF9.
In addition to the canonical JAK/STAT signaling pathway, there is evidence that various other signaling pathways, such as the MAPK pathway, can mediate some actions of IFN-I (7, 8). However, our findings point to a dominant role of STAT1, STAT2, and IRF9 in the non-canonical IFN-I signaling pathways in MGCs. Although we did not investigate directly the nature of the signaling complexes involved, this suggests that signaling in the IFN-I signaling-deficient MGCs in response to IFN-α is mediated predominantly by the remaining ISGF3 factors in these cells. STAT2 has a transactivation domain, but it binds DNA poorly (6, 42), whereas STAT1 and IRF9 appear to be critical for DNA binding and sequence recognition specificity of the ISGF3 complex (6, 43). Previous studies indicated that IFN-α can induce the formation of STAT1 homodimers (44, 45) and STAT1/STAT2 heterodimers (45–47). Our data suggested that STAT1 homodimers might regulate gene expression in the absence of STAT2 or IRF9, STAT1-STAT2 heterodimers in the absence of IRF9, and STAT2-IRF9 complexes in the absence of STAT1. A significant regulatory role of the STAT2-IRF9 complex in the absence of STAT1 has been demonstrated in responses to IFN-α in various cell types (14, 18–20). In addition, recent studies have demonstrated that STAT2-IRF9 complexes are able to modulate a subset of IRG expression in the absence of STAT1 (18, 19). Finally, STAT2 forms homodimers or heterodimers with STAT6 in response to IFN-α, and these dimers can bind with IRF9 (6, 20, 48, 49). Similar to STAT2, STAT1 homodimers are capable of interacting with IRF9, and this complex can bind to the ISRE in the promoter region of IRGs (43). Therefore, in the absence of one of the ISGF3 molecules, the remaining ISGF3 molecules can form non-canonical signaling complexes to regulate ISGF3-independent gene expression. However, in the context of the present study, the exact composition of these non-canonical complexes and the specific promoter sequences that these complexes bind requires further investigation.
The exceptional role of IRF9 in non-canonical IFN-I signaling was further highlighted by the fact that the expression of 37 ISGs occurred in IRF9-deficient MGCs only. Bioinformatics and promoter analysis categorized these ISGs as being induced by IFN-γ and with STAT1 homodimer and/or STAT1-STAT2 heterodimer binding GAS elements in their promoter regions, suggesting there is an IFN-γ-like response in IFN-α-treated, IRF9-deficient MGCs. Consistent with this, the activation of gene expression by IFN-α in MGCs lacking IRF9 correlated with the robust and prolonged phosphorylation of STAT1 and STAT2. Moreover, previous studies in human U2A fibrosarcoma cells deficient in IRF9 established that IFN-α can stimulate STAT1 homodimer and STAT1-STAT2 heterodimer formation, which can bind to the GAS element to activate transcription of genes such as IRF1 (45). It has previously been reported by us (25) that GFAP-IFNα mice deficient for IRF9 develop a severe neurological disease associated with a pronounced IFN-γ-like response. Our findings here further extend our understanding of the possible basis for this phenotype and suggest that in the absence of IRF9, STAT1 homodimers and/or STAT1-STAT2 heterodimers activate a subset of genes to drive an IFN-γ-like response in glial cells in the brain.
The dynamics of the ISG response to IFN-α in IFN-I signaling-deficient MGCs differed from that of WT MGCs, with the expression of a subset of ISGs being induced early and increased further with time, whereas the induction of a second subset of ISGs was identified that exhibited a late or delayed induction. Comparable delayed and/or prolonged kinetics of gene expression in response to IFN-I was observed in STAT1- and STAT2-deficient murine macrophages (18, 33) and in human U3A fibrosarcoma cells and MEFs lacking STAT1 ectopically expressing STAT2 (19). Our study now extends these previous findings in showing that MGCs lacking either STAT1, STAT2, or IRF9 respond to IFN-α with similar delayed and prolonged ISG expression. Further analysis of the regulation of the response to IFN-α in STAT1-deficient MGCs employing CHX revealed that the early induction of ISGs was dependent on preexisting endogenous factors, whereas the additional increase in the expression of these genes as well as the delayed induction of new ISGs was dependent on ongoing protein synthesis. One possible explanation for these observations is that the absence of a homeostatic positive feedback loop via ISGF3 signaling in STAT1 KO cells results in suboptimal production of STAT2 and IRF9. Following IFN-α treatment, activation of STAT2 and IRF9 induces a subset of sensitive early response ISGs and also increases feed-forward production of STAT2 and IRF9, which in turn further stimulates increased expression of these early response ISGs as well as reaching a threshold required for the induction of additional ISGs. In support of this idea, we noted that STAT2 mRNA and IRF9 mRNA as well as STAT2 protein were reduced in untreated STAT1-deficient MGCs but progressively increased to significantly higher levels following treatment with IFN-α. The forced overproduction of STAT2 in STAT1-deficient U3A fibrosarcoma cells greatly enhances the level and number of ISGs in response to IFN-I (19), providing additional evidence that complementation of the endogenous ISGF3 factor levels can augment the IFN-I response in IFN-I signaling-deficient cells. In addition to limiting levels of the individual ISGF3 factors in the IFN-I signaling-deficient MGCs, loss of negative feedback regulation via SOCS1 may also contribute to the prolonged and increased expression of ISGs in these cells in response to IFN-α (as discussed further below).
To explore further the possible mechanisms that might underlie the response of MGCs to IFN-I in the absence of canonical ISGF3 signaling, the level and activation of some key signal transduction proteins were investigated. WT MGCs showed transient STAT1 and STAT2 tyrosine phosphorylation in response to IFN-α, whereas this was increased progressively in the signaling-deficient cells. This pattern of STAT1 and STAT2 activation paralleled the kinetics of IRG gene expression in which the majority of IRGs were transiently altered in expression in WT cells but progressively increased or showed delayed expression in the IFN-I signaling-deficient cells. A similarly prolonged activation of STAT1 and STAT2 by IFN-α was seen in murine BMM cells lacking STAT1 or STAT2 (18, 33). This could be due to the loss of the SOCS1 negative regulatory response because there was a delayed and small increase in Socs1 gene expression in MGCs lacking STAT2 or IRF9 and no increase in Socs1 gene expression in STAT1-deficient MGCs. The importance of this SOCS1 negative regulatory loop was further highlighted by Zhao et al. (33), who reported that IFN-I-induced Socs1 gene expression is impaired in STAT2-deficient murine macrophages, which was associated with prolonged and increased activation of STAT1 that could be abrogated by ectopic expression of SOCS1 in these cells. Thus, the prolonged activation of STAT1 and STAT2 in signaling-deficient MGCs might be due, in part, to the lack of effective negative-feedback regulation by SOCS1. Interestingly, and in contrast to STAT1 tyrosine phosphorylation, the kinetics and level of activation of STAT1 serine phosphorylation in response to IFN-α was comparable in WT and the STAT2 and IRF9 signaling-deficient cells, suggesting that the positive regulatory pathway controlling this process is independent of ISGF3 signaling.
To investigate the relevance of the in vitro findings in vivo, the expression of selected IFN-I-regulated, ISGF3-independent genes was investigated in the brain of GFAP-IFNα transgenic mice lacking either STAT1 or IRF9. Overall, changes in ISG expression in the IFN-α-treated MGCs exhibited parallel changes in the brain of GFAP-IFNα mice and GFAP-IFNα mice that lacked STAT1 or IRF9 and were generally higher in the absence of IRF9 versus STAT1. Although we did not determine the identity of the responder cells in the brain of the GFAP-IFNα mice, the concordance of the ISG changes indicates that the findings obtained with the MGCs were not peculiar to the in vitro culture of these cells. Furthermore, these findings also strongly suggested that non-canonical IFN-I signaling and subsequent IFN-provoked responses by astrocytes and microglia may be a major contributing factor to the exacerbated disease phenotype observed in GFAP-IFNα mice that lack STAT1 or IRF9.
In addition to the biological significance of non-canonical IFN-I signaling in mediating the severe disease phenotypes in GFAP-IFNα transgenic mice (23–25), our findings provide further insights into the possible biological functions of the non-canonical IFN-I signaling pathways that will be of interest to elucidate further in future work. The in silico IPA analysis revealed that a large majority of ISGF3-independent ISGs are associated with antiviral functions, antigen presentation processes, apoptosis, and protein ubiquitination, suggesting an underlying mechanism for IFN-I-mediated biological responses, particularly in relation to host defense, independent of STAT1, STAT2, or IRF9. In line with this and despite the fact that when compared with WT mice, STAT1-deficient mice are more susceptible to virus infection, these mice show greater resistance to infection with some viruses than mice deficient for the IFNAR or lacking the combination of STAT1 and STAT2 (12, 14, 50). Both measles virus and lymphocytic choriomeningitis virus subvert the host antiviral response via STAT2-dependent, STAT1-independent IFN-I signaling to interfere with dendritic cell development and expansion (51). In addition to anti-viral processes, non-canonical IFN-I signaling can suppress the growth of intracellular bacteria in both STAT1- and STAT2-deficient murine macrophages but not in macrophages lacking both of these STATs (18). However, in contrast to rodents, STAT1 is obligatory for antiviral protection in humans, where its deficiency is associated with lethal virus infection in infants (52). Surprisingly, patients that are deficient for STAT2 (53) or the IFNAR (54) have very similar clinical phenotypes, being highly susceptible to systemic live attenuated virus vaccination but being able to manage the majority of common viral infections, having a relatively healthy life. These findings suggest that IFN-I have a much narrower role in antiviral defense in humans than was previously appreciated and that the more severe outcome in human STAT1 deficiency may result from compound impairment of the function of type I, II, and III IFNs, all of which signal via STAT1.
In summary, our findings demonstrate that IFN-α can regulate the expression of a subset of genes in MGCs in the absence of STAT1, STAT2, or IRF9 by activating ISGF3-independent signaling pathways. Our data indicate a more dominant requirement for STAT1 and STAT2 over IRF9 in non-canonical signaling elicited by IFN-α, whereas alternative signaling factors that are co-activated, such as STAT3 and ERK1/2, appear to have only a minor role. In the absence of IRF9, IFN-α induced a unique IFN-γ-like response that is dependent on STAT1 and STAT2. However, the exact mechanism of how STAT1, STAT2, and IRF9 mediate non-canonical IFN-I signaling remains to be determined; notably, the type of alternative signaling complexes involved and the nature of the target DNA response elements to which these complexes bind remain enigmatic. In any event, the findings presented in this study shed new light on the role of STAT1, STAT2, and IRF9 in mediating non-canonical IFN-I signaling and advance our understanding of non-canonical IFN-I signaling in mediating biological responses, such as the adverse effects of IFN-I in the CNS of GFAP-IFNα mice and the antiviral actions of IFN-I previously observed in STAT1 and STAT2 KO mice.
Experimental Procedures
Animals
STAT1 KO mice (9) were provided originally by Dr. Joan Durbin (Nationwide Children's Hospital, Columbus, OH). STAT2 KO mice (11) were provided by Dr. Christian Schindler (Columbia University, New York). The IRF9 KO mice (55) were obtained from Riken Bioresource Center (Tsukuba, Japan). GFAP-IFNα mice generated as described previously (21) were maintained by heterozygous breeding. GFAP-IFNα × STAT1 KO mice and GFAP-IFNα × IRF9 KO mice were produced by interbreeding, and all genotypes were verified by PCR analysis of tail DNA. All mice used in this study were on the C57BL/6 background and maintained under specific pathogen-free conditions in the animal facility of the School of Molecular Bioscience, University of Sydney. Ethical approval for the use of all mice in this study was obtained from the University of Sydney Animal Ethics Committee.
Mixed glial cell culture and RNA extraction
MGCs were prepared from 2–4-day-old mice. Brains were removed and placed in modified Eagle's medium (MEM) containing 25 mm HEPES (all from Life Technologies, Mulgrave, Australia). After removal of the meninges, cerebral cortices from 5–6 brains were combined, chopped using a sterile razor blade, and incubated with 1 ml of sterile-filtered papain solution (1 mg/ml papain suspension (Worthington), 240 μg/ml l-cysteine (Sigma-Aldrich, Castle Hill, Australia), and 1140 units of DNase I type IV (Sigma-Aldrich) in 1 ml of MEM-HEPES) at 37 °C for 1 h. Supernatant was removed, and the tissue was washed in 1 ml of DF medium consisting of Dulbecco's modified Eagle's medium high glucose with l-glutamine (Life Technologies), 10% (v/v) fetal bovine serum (Thermo Fisher Scientific, Scoresby, Australia), 100 units/ml penicillin (Life Technologies), and 10 μg/ml streptomycin (Life Technologies). Tissue was then triturated through a 1-ml pipette tip until a homogeneous suspension was obtained. Cells were pelleted by centrifugation at 120 × g for 5 min and resuspended in DF medium (0.5 ml/brain). The cell suspension was then added to poly-d-lysine (Sigma-Aldrich)-coated 75-cm2 cell culture flasks (BD, North Ryde, Australia) containing DF medium. Cells were maintained at 37 °C in an atmosphere of 5% CO2, with medium being changed every 3 days. Once confluent, cells were trypsinized and split at a ratio of 1:6 in poly-d-lysine-coated 75-cm2 flasks. These cultures consisted of ∼95–98% astrocytes and 2–5% microglia as determined by flow cytometry using antibodies to GLAST1 (astrocytes) or CD11b (microglia) as described previously (56). Although the percentage of microglia varied between individual cultures, we observed no significant differences in microglia yields between the various genotypes. Experiments were performed on cells after the first passage. For stimulation with IFN-α, cells (∼90% confluent) were washed with DF medium and incubated with murine recombinant interferon (IFN)-α1 (Sigma-Aldrich) at a final concentration of 1000 units/ml in DF medium at 37 °C in an atmosphere of 5% CO2 for 4 or 12 h, as indicated. Total RNA was extracted from MGCs using TRI reagent (Sigma-Aldrich) according to the manufacturer's instructions. The RNA was further purified using the RNeasy clean-up kit (Qiagen) according to the manufacturer's instructions.
Affymetrix GeneChip® analysis
Affymetrix Mouse Genome 430 2.0 arrays (Affymetrix Inc., Santa Clara, CA), which detect more than 34,000 mouse transcripts, were used for this study. The cRNA preparation, hybridization, and scanning of the arrays was performed by the Ramaciotti Centre for Gene Function Analysis (University of New South Wales, Sydney, Australia). The microarray data are available from ArrayExpress, accession code E-MTAB-5445.
The normalized data were analyzed using an in-house developed data management tool, which facilitated cluster formation based on signal intensity, and the -fold change between any two arrays (57). The background level of signal intensity (<50) was established through consideration of the mean fluorescence intensity levels of genes (Cd3d, Cd3e, Cd3g, Cd4, Cd8a, Cd8b1, Cd80, and Ifng) known not to be expressed in untreated MGCs. Expressed transcripts showing -fold changes of >2 were saved into clusters. The data management tool allowed the membership of any set of genes to be cross-compared by combining gene clusters with AND/OR/NOT style logic, illustrating the results through interactive Venn diagrams. The expression of selected genes was shown in a heat map that was generated by hierarchical gene clustering using Multi Experimental Viewer, which is part of the TM4 microarray software suite (Dana-Farber Cancer Institute, Boston, MA) (58).
In silico functional and pathway analysis was performed using IPA software (Ingenuity Systems). The significance of the association between canonical pathways and the data set was measured 1) by Fischer's exact test to calculate a p value determining the probability that each pathway assigned to the data set is due to chance alone and 2) by the ratio of the number of genes from the data set that were involved in the pathways divided by the total number of genes that map to the pathways. Furthermore, the potential upstream regulators of one data set, which includes different types of stimuli and transcription factors, was identified by IPA. In parallel with IPA, the Database for Annotation, Visualization, and Integrated Discovery (DAVID) bioinformatics online database (LIB & DAVID Bioinformatics, Frederick, MD) was also employed to perform in silico functional and biological analysis (59, 60).
The commercially available Genomatix software suite (Genomatix Co., Munich, Germany) was used to perform promoter analysis of the genes of interest. The tasks performed in this suite include the Gene2Promoter, for the extraction of the promoter sequence of the genes and the MatInspector, for identifying potential transcription factor binding sites in the promoter region. Furthermore, the INTERFEROME (version 1.01) online database was used to identify IRGs (29).
RPA
The RPA was performed, and RNA levels were quantified from autoradiographs by densitometry using NIH Image software (version 1.47) as described previously (61). The construction and characterization of the RPA probes for Irf7, Irf8, Stat1, and Stat2 were reported previously (28, 62). The new RPA probes for Cdh1, Oasl2, Ifi47, Rtp4, Cd69, Gbp6, Zbp1, Trex1, Iigp1, and Mpa2l (Table 6) were synthesized by reverse transcription-PCR, cloned, and verified by sequencing analysis as described previously (63).
TABLE 6.
cDNA target sequences used to derive the RPA probe set
| Target | Sequence | Length | Accession no. |
|---|---|---|---|
| bp | |||
| Cdh1 | 2193–2447 | 255 | AW111920 |
| Oasl2 | 1852–2067 | 216 | NM011854 |
| Ifi47 | 825–1015 | 191 | NM008330 |
| Rtp4 | 440–604 | 165 | BC024872 |
| Cd69 | 307–528 | 222 | NM001033122 |
| Gbp6 | 1614–1723 | 110 | BC010229 |
| Zbp1 | 361–631 | 280 | AK008179 |
| Trex1 | 601–911 | 310 | NM011637 |
| Iigp1 | 62–213 | 150 | NM021792 |
| Mpa2l | 1762–1893 | 118 | NM194336 |
Immunoblot analysis
MGCs were homogenized in 50 mm Tris-HCl, pH 7.4, containing 1% Nonidet-P40, 10% (v/v) glycerol, 1 mm EDTA, 1 mm DTT, protease inhibitor mixture set III (1:200; Calbiochem), and phosphatase inhibitor mixture set II (1:200; Calbiochem). Protein lysates were fractioned by SDS-PAGE using precast gradient gels (Invitrogen) and transferred to polyvinylidene difluoride (PVDF) membranes. All primary antibodies (pY701-STAT1, pS727-STAT1, pY705-STAT3, pT202/Y204-ERK1/2, ERK1/2, STAT1, STAT2, and STAT3 (Cell Signaling Technology) and PY690-STAT2 (Millipore)) were diluted at 1:1000 with the exception of ERK1/2 and GAPDH (Sigma-Aldrich), which were diluted 1:20,000. The relative protein levels were quantified from autoradiographs by densitometry using NIH Image software (version 1.42).
Statistical analysis
Statistical analyses of the different data sets are outlined in the figure legends.
Author contributions
W. L., P. S., and S. R. J. performed experiments, analyzed the data, and co-wrote the manuscript. M. J. H. conceived experiments, contributed to the analysis and interpretation of the results, and assisted with the writing of the manuscript. D. H. and G. D. performed bioinformatic analysis of the microarray data and assisted with the writing of the manuscript. I. L. C. conceived the experiments, assisted with analysis and interpretation of the results, and co-wrote the manuscript.
Acknowledgments
We thank Sue Ling Lim and Laura Parker for technical assistance.
This work was supported in part by National Health and Medical Research Council of Australia Project Grant 512407 (to I. L. C.). The authors declare that they have no conflicts of interest with the contents of this article.
- IFN-I
- type I IFN(s)
- IFNAR
- interferon α receptor
- ISRE
- interferon-stimulated response element
- IRG
- interferon-regulated gene
- ISG
- interferon stimulated gene
- MGC
- mixed glial cell culture
- EST
- expressed sequence tag
- IPA
- Ingenuity pathway analysis
- GAF
- IFN-γ-activated transcription factor
- GAS
- IFN-γ-activated sequence
- RPA
- RNase protection assay
- CHX
- cycloheximide
- MEM
- modified Eagle's medium.
References
- 1. González-Navajas J. M., Lee J., David M., and Raz E. (2012) Immunomodulatory functions of type I interferons. Nat. Rev. Immunol. 12, 125–135 [DOI] [PMC free article] [PubMed] [Google Scholar]
- 2. Sadler A. J., and Williams B. R. (2008) Interferon-inducible antiviral effectors. Nat. Rev. Immunol. 8, 559–568 [DOI] [PMC free article] [PubMed] [Google Scholar]
- 3. Seo Y. J., and Hahm B. (2010) Type I interferon modulates the battle of host immune system against viruses. Adv. Appl. Microbiol. 73, 83–101 [DOI] [PMC free article] [PubMed] [Google Scholar]
- 4. Darnell J. E. Jr., Kerr I. M., and Stark G. R. (1994) Jak-STAT pathways and transcriptional activation in response to IFNs and other extracellular signaling proteins. Science 264, 1415–1421 [DOI] [PubMed] [Google Scholar]
- 5. Stark G. R., Kerr I. M., Williams B. R. G., Silverman R. H., and Schreiber R. D. (1998) How cells respond to interferons. Annu. Rev. Biochem. 67, 227–264 [DOI] [PubMed] [Google Scholar]
- 6. Bluyssen H. A., and Levy D. E. (1997) Stat2 is a transcriptional activator that requires sequence-specific contacts provided by stat1 and p48 for stable interaction with DNA. J. Biol. Chem. 272, 4600–4605 [DOI] [PubMed] [Google Scholar]
- 7. Platanias L. C. (2005) Mechanisms of type-I- and type-II-interferon-mediated signalling. Nat. Rev. Immunol. 5, 375–386 [DOI] [PubMed] [Google Scholar]
- 8. Rani M. R., and Ransohoff R. M. (2005) Alternative and accessory pathways in the regulation of IFN-β-mediated gene expression. J. Interferon Cytokine Res. 25, 788–798 [DOI] [PubMed] [Google Scholar]
- 9. Durbin J. E., Hackenmiller R., Simon M. C., and Levy D. E. (1996) Targeted disruption of the mouse Stat1 gene results in compromised innate immunity to viral disease. Cell 84, 443–450 [DOI] [PubMed] [Google Scholar]
- 10. Meraz M. A., White J. M., Sheehan K. C. F., Bach E. A., Rodig S. J., Dighe A. S., Kaplan D. H., Riley J. K., Greenlund A. C., Campbell D., Carver-Moore K., DuBois R. N., Clark R., Aguet M., and Schreiber R. D. (1996) Targeted disruption of the Stat1 gene in mice reveals unexpected physiologic specificity in the JAK-STAT signaling pathway. Cell 84, 431–442 [DOI] [PubMed] [Google Scholar]
- 11. Park C., Li S., Cha E., and Schindler C. (2000) Immune response in Stat2 knockout mice. Immunity 13, 795–804 [DOI] [PubMed] [Google Scholar]
- 12. Gil M. P., Bohn E., O'Guin A. K., Ramana C. V., Levine B., Stark G. R., Virgin H. W., and Schreiber R. D. (2001) Biologic consequences of Stat1-independent IFN signaling. Proc. Natl. Acad. Sci. U.S.A. 98, 6680–6685 [DOI] [PMC free article] [PubMed] [Google Scholar]
- 13. Ou R., Zhou S., Huang L., and Moskophidis D. (2001) Critical role for α/β and γ interferons in persistence of lymphocytic choriomeningitis virus by clonal expansion. J. Virol. 75, 8407–8423 [DOI] [PMC free article] [PubMed] [Google Scholar]
- 14. Perry S. T., Buck M. D., Lada S. M., Schindler C., and Shresta S. (2011) STAT2 mediates innate immunity to Dengue virus in the absence of STAT1 via the type I interferon receptor. PLoS Pathog. 7, e1001297. [DOI] [PMC free article] [PubMed] [Google Scholar]
- 15. Hofer M. J., Li W., Manders P., Terry R., Lim S. L., King N. J., and Campbell I. L. (2012) Mice deficient in STAT1 but not STAT2 or IRF9 develop a lethal CD4+ T-cell-mediated disease following infection with lymphocytic choriomeningitis virus. J. Virol. 86, 6932–6946 [DOI] [PMC free article] [PubMed] [Google Scholar]
- 16. Li W., Hofer M. J., Jung S. R., Lim S. L., and Campbell I. L. (2014) IRF7-dependent Type I interferon production induces lethal immune-mediated disease in STAT1 knockout mice infected with lymphocytic choriomeningitis virus. J. Virol. 88, 7578–7588 [DOI] [PMC free article] [PubMed] [Google Scholar]
- 17. Plumlee C. R., Lee C., Beg A. A., Decker T., Shuman H. A., and Schindler C. (2009) Interferons direct an effective innate response to Legionella pneumophila infection. J. Biol. Chem. 284, 30058–30066 [DOI] [PMC free article] [PubMed] [Google Scholar]
- 18. Abdul-Sater A. A., Majoros A., Plumlee C. R., Perry S., Gu A. D., Lee C., Shresta S., Decker T., and Schindler C. (2015) Different STAT transcription complexes drive early and delayed responses to type I IFNs. J. Immunol. 195, 210–216 [DOI] [PMC free article] [PubMed] [Google Scholar]
- 19. Blaszczyk K., Olejnik A., Nowicka H., Ozgyin L., Chen Y. L., Chmielewski S., Kostyrko K., Wesoly J., Balint B. L., Lee C. K., and Bluyssen H. A. (2015) STAT2/IRF9 directs a prolonged ISGF3-like transcriptional response and antiviral activity in the absence of STAT1. Biochem. J. 466, 511–524 [DOI] [PMC free article] [PubMed] [Google Scholar]
- 20. Lou Y. J., Pan X. R., Jia P. M., Li D., Xiao S., Zhang Z. L., Chen S. J., Chen Z., and Tong J. H. (2009) IRF-9/STAT2 [corrected] functional interaction drives retinoic acid-induced gene G expression independently of STAT1. Cancer Res. 69, 3673–3680 [DOI] [PubMed] [Google Scholar]
- 21. Akwa Y., Hassett D. E., Eloranta M. L., Sandberg K., Masliah E., Powell H., Whitton J. L., Bloom F. E., and Campbell I. L. (1998) Transgenic expression of IFN-α in the central nervous system of mice protects against lethal neurotropic viral infection but induces inflammation and neurodegeneration. J. Immunol. 161, 5016–5026 [PubMed] [Google Scholar]
- 22. Campbell I. L., Krucker T., Steffensen S., Akwa Y., Powell H. C., Lane T., Carr D. J., Gold L. H., Henriksen S. J., and Siggins G. R. (1999) Structural and functional neuropathology in transgenic mice with CNS expression of IFN-α. Brain Res. 835, 46–61 [DOI] [PubMed] [Google Scholar]
- 23. Wang J., Schreiber R. D., and Campbell I. L. (2002) STAT1 deficiency unexpectedly and markedly exacerbates the pathophysiological actions of IFN-α in the central nervous system. Proc. Natl. Acad. Sci. U.S.A. 99, 16209–16214 [DOI] [PMC free article] [PubMed] [Google Scholar]
- 24. Wang J., Pham-Mitchell N., Schindler C., and Campbell I. L. (2003) Dysregulated sonic hedgehog signaling and medulloblastoma consequent to IFN-α-stimulated STAT2-independent production of IFN-γ in the brain. J. Clin. Invest. 112, 535–543 [DOI] [PMC free article] [PubMed] [Google Scholar]
- 25. Hofer M. J., Li W., Lim S. L., and Campbell I. L. (2010) The type I interferon-α mediates a more severe neurological disease in the absence of the canonical signaling molecule interferon regulatory factor 9. J. Neurosci. 30, 1149–1157 [DOI] [PMC free article] [PubMed] [Google Scholar]
- 26. Campbell I. L. (2005) Cytokine-mediated inflammation, tumorigenesis, and disease-associated JAK/STAT/SOCS signaling circuits in the CNS. Brain Res. Brain Res. Rev. 48, 166–177 [DOI] [PubMed] [Google Scholar]
- 27. Wang J., and Campbell I. L. (2005) Innate STAT1-dependent genomic response of neurons to the antiviral cytokine α interferon. J. Virol. 79, 8295–8302 [DOI] [PMC free article] [PubMed] [Google Scholar]
- 28. Ousman S. S., Wang J., and Campbell I. L. (2005) Differential regulation of interferon regulatory factor (IRF)-7 and IRF-9 gene expression in the central nervous system during viral infection. J. Virol. 79, 7514–7527 [DOI] [PMC free article] [PubMed] [Google Scholar]
- 29. Samarajiwa S. A., Forster S., Auchettl K., and Hertzog P. J. (2009) INTERFEROME: the database of interferon regulated genes. Nucleic Acids Res. 37, D852–D857 [DOI] [PMC free article] [PubMed] [Google Scholar]
- 30. Chatterjee-Kishore M., Wright K. L., Ting J. P., and Stark G. R. (2000) How Stat1 mediates constitutive gene expression: a complex of unphosphorylated Stat1 and IRF1 supports transcription of the LMP2 gene. EMBO J. 19, 4111–4122 [DOI] [PMC free article] [PubMed] [Google Scholar]
- 31. Cheon H., and Stark G. R. (2009) Unphosphorylated STAT1 prolongs the expression of interferon-induced immune regulatory genes. Proc. Natl. Acad. Sci. U.S.A. 106, 9373–9378 [DOI] [PMC free article] [PubMed] [Google Scholar]
- 32. Zimmerman M. A., Rahman N. T., Yang D., Lahat G., Lazar A. J., Pollock R. E., Lev D., and Liu K. (2012) Unphosphorylated STAT1 promotes sarcoma development through repressing expression of Fas and bad and conferring apoptotic resistance. Cancer Res. 72, 4724–4732 [DOI] [PMC free article] [PubMed] [Google Scholar]
- 33. Zhao W., Cha E. N., Lee C., Park C. Y., and Schindler C. (2007) Stat2-dependent regulation of MHC class II expression. J. Immunol. 179, 463–471 [DOI] [PubMed] [Google Scholar]
- 34. Meyer T., Begitt A., Lödige I., van Rossum M., and Vinkemeier U. (2002) Constitutive and IFN-γ-induced nuclear import of STAT1 proceed through independent pathways. EMBO J. 21, 344–354 [DOI] [PMC free article] [PubMed] [Google Scholar]
- 35. Banninger G., and Reich N. C. (2004) STAT2 nuclear trafficking. J. Biol. Chem. 279, 39199–39206 [DOI] [PubMed] [Google Scholar]
- 36. Robertson G., Hirst M., Bainbridge M., Bilenky M., Zhao Y., Zeng T., Euskirchen G., Bernier B., Varhol R., Delaney A., Thiessen N., Griffith O. L., He A., Marra M., Snyder M., and Jones S. (2007) Genome-wide profiles of STAT1 DNA association using chromatin immunoprecipitation and massively parallel sequencing. Nat. Methods 4, 651–657 [DOI] [PubMed] [Google Scholar]
- 37. Testoni B., Völlenkle C., Guerrieri F., Gerbal-Chaloin S., Blandino G., and Levrero M. (2011) Chromatin dynamics of gene activation and repression in response to interferon alpha (IFNα) reveal new roles for phosphorylated and unphosphorylated forms of the transcription factor STAT2. J. Biol. Chem. 286, 20217–20227 [DOI] [PMC free article] [PubMed] [Google Scholar]
- 38. Gough D. J., Messina N. L., Hii L., Gould J. A., Sabapathy K., Robertson A. P., Trapani J. A., Levy D. E., Hertzog P. J., Clarke C. J., and Johnstone R. W. (2010) Functional crosstalk between type I and II interferon through the regulated expression of STAT1. PLoS Biol. 8, e1000361. [DOI] [PMC free article] [PubMed] [Google Scholar]
- 39. Gough D. J., Messina N. L., Clarke C. J., Johnstone R. W., and Levy D. E. (2012) Constitutive type I interferon modulates homeostatic balance through tonic signaling. Immunity 36, 166–174 [DOI] [PMC free article] [PubMed] [Google Scholar]
- 40. Mostafavi S., Yoshida H., Moodley D., LeBoité H., Rothamel K., Raj T., Ye C. J., Chevrier N., Zhang S. Y., Feng T., Lee M., Casanova J. L., Clark J. D., Hegen M., Telliez J. B., et al. (2016) Parsing the interferon transcriptional network and its disease associations. Cell 164, 564–578 [DOI] [PMC free article] [PubMed] [Google Scholar]
- 41. Santoni F. A., Hartley O., and Luban J. (2010) Deciphering the code for retroviral integration target site selection. PLoS Comput. Biol. 6, e1001008. [DOI] [PMC free article] [PubMed] [Google Scholar]
- 42. Ghislain J. J., and Fish E. N. (1996) Application of genomic DNA affinity chromatography identifies multiple interferon-α-regulated Stat2 complexes. J. Biol. Chem. 271, 12408–12413 [DOI] [PubMed] [Google Scholar]
- 43. Bluyssen H. A., Muzaffar R., Vlieststra R. J., van der Made A. C. J., Leung S., Stark G. R., Kerr I. M., Trapman J., and Levy D. E. (1995) Combinatorial association and abundance of components of interferon-stimulated gene factor 3 dictate the selectivity of interferon responses. Proc. Natl. Acad. Sci. U.S.A. 92, 5645–5649 [DOI] [PMC free article] [PubMed] [Google Scholar]
- 44. Decker T., Lew D. J., and Darnell J. E. Jr. (1991) Two distinct α-interferon-dependent signal transduction pathways may contribute to activation of transcription of the guanylate-binding protein gene. Mol. Cell Biol. 11, 5147–5153 [DOI] [PMC free article] [PubMed] [Google Scholar]
- 45. Li X., Leung S., Qureshi S., Darnell J. E. Jr., and Stark G. R. (1996) Formation of STAT1-STAT2 heterodimers and their role in the activation of IRF-1 gene transcription by interferon-α. J. Biol. Chem. 271, 5790–5794 [DOI] [PubMed] [Google Scholar]
- 46. Brierley M. M., and Fish E. N. (2005) Functional relevance of the conserved DNA-binding domain of STAT2. J. Biol. Chem. 280, 13029–13036 [DOI] [PubMed] [Google Scholar]
- 47. Ghislain J. J., Wong T., Nguyen M., and Fish E. N. (2001) The interferon-inducible Stat2:Stat1 heterodimer preferentially binds in vitro to a consensus element found in the promoters of a subset of interferon-stimulated genes. J. Interferon Cytokine Res. 21, 379–388 [DOI] [PubMed] [Google Scholar]
- 48. Gupta S., Jiang M., and Pernis A. B. (1999) IFN-α activates Stat6 and leads to the formation of Stat2:Stat6 complexes in B cells. J. Immunol. 163, 3834–3841 [PubMed] [Google Scholar]
- 49. Martinez-Moczygemba M., Gutch M. J., French D. L., and Reich N. C. (1997) Distinct STAT structure promotes interaction of STAT2 with the p48 subunit of the interferon-α-stimulated transcription factor ISGF3. J. Biol. Chem. 272, 20070–20076 [DOI] [PubMed] [Google Scholar]
- 50. Shresta S., Sharar K. L., Prigozhin D. M., Snider H. M., Beatty P. R., and Harris E. (2005) Critical roles for both STAT1-dependent and STAT1-independent pathways in the control of primary dengue virus infection in mice. J. Immunol. 175, 3946–3954 [DOI] [PubMed] [Google Scholar]
- 51. Hahm B., Trifilo M. J., Zuniga E. I., and Oldstone M. B. (2005) Viruses evade the immune system through type I interferon-mediated STAT2-dependent, but STAT1-independent, signaling. Immunity 22, 247–257 [DOI] [PubMed] [Google Scholar]
- 52. Dupuis S., Jouanguy E., Al-Hajjar S., Fieschi C., Al-Mohsen I. Z., Al-Jumaah S., Yang K., Chapgier A., Eidenschenk C., Eid P., Al Ghonaium A., Tufenkeji H., Frayha H., Al-Gazlan S., Al-Rayes H., et al. (2003) Impaired response to interferon-α/β and lethal viral disease in human STAT1 deficiency. Nat. Genet. 33, 388–391 [DOI] [PubMed] [Google Scholar]
- 53. Hambleton S., Goodbourn S., Young D. F., Dickinson P., Mohamad S. M., Valappil M., McGovern N., Cant A. J., Hackett S. J., Ghazal P., Morgan N. V., and Randall R. E. (2013) STAT2 deficiency and susceptibility to viral illness in humans. Proc. Natl. Acad. Sci. U.S.A. 110, 3053–3058 [DOI] [PMC free article] [PubMed] [Google Scholar]
- 54. Duncan C. J., Mohamad S. M., Young D. F., Skelton A. J., Leahy T. R., Munday D. C., Butler K. M., Morfopoulou S., Brown J. R., Hubank M., Connell J., Gavin P. J., McMahon C., Dempsey E., Lynch N. E., Jacques T. S., Valappil M., Cant A. J., Breuer J., Engelhardt K. R., Randall R. E., and Hambleton S. (2015) Human IFNAR2 deficiency: lessons for antiviral immunity. Sci. Transl. Med. 7, 307ra154. [DOI] [PMC free article] [PubMed] [Google Scholar]
- 55. Kimura T., Kadokawa Y., Harada H., Matsumoto M., Sato M., Kashiwazaki Y., Tarutani M., Tan R. S., Takasugi T., Matsuyama T., Mak T. W., Noguchi S., and Taniguchi T. (1996) Essential and non-redundant roles of p48 (ISGF3 γ) and IRF-1 in both type I and type II interferon responses, as revealed by gene targeting studies. Genes Cells 1, 115–124 [DOI] [PubMed] [Google Scholar]
- 56. Carter S. L., Müller M., Manders P. M., and Campbell I. L. (2007) Induction of the genes for Cxcl9 and Cxcl10 is dependent on IFN-γ but shows differential cellular expression in experimental autoimmune encephalomyelitis and by astrocytes and microglia in vitro. Glia 55, 1728–1739 [DOI] [PubMed] [Google Scholar]
- 57. Mulligan C., Rochford J., Denyer G., Stephens R., Yeo G., Freeman T., Siddle K., and O'Rahilly S. (2002) Microarray analysis of insulin and insulin-like growth factor-1 (IGF-1) receptor signaling reveals the selective up-regulation of the mitogen heparin-binding EGF-like growth factor by IGF-1. J. Biol. Chem. 277, 42480–42487 [DOI] [PubMed] [Google Scholar]
- 58. Saeed A. I., Sharov V., White J., Li J., Liang W., Bhagabati N., Braisted J., Klapa M., Currier T., Thiagarajan M., Sturn A., Snuffin M., Rezantsev A., Popov D., Ryltsov A., et al. (2003) TM4: a free, open-source system for microarray data management and analysis. BioTechniques 34, 374–378 [DOI] [PubMed] [Google Scholar]
- 59. Huang da W., Sherman B. T., and Lempicki R. A. (2009) Systematic and integrative analysis of large gene lists using DAVID bioinformatics resources. Nat. Protoc. 4, 44–57 [DOI] [PubMed] [Google Scholar]
- 60. Huang da W., Sherman B. T., Zheng X., Yang J., Imamichi T., Stephens R., and Lempicki R. A. (2009) Extracting biological meaning from large gene lists with DAVID. Curr. Protoc. Bioinformatics 10.1002/0471250953.bi1311s27 [DOI] [PubMed] [Google Scholar]
- 61. Asensio V. C., and Campbell I. L. (1997) Chemokine gene expression in the brain of mice with lymphocytic choriomeningitis. J. Virol. 71, 7832–7840 [DOI] [PMC free article] [PubMed] [Google Scholar]
- 62. Maier J., Kincaid C., Pagenstecher A., and Campbell I. L. (2002) Regulation of signal transducer and activator of transcription and suppressor of cytokine signaling gene expression in the brain of mice with astrocyte-targeted production of IL-12 and experimental autoimmune encephalomyelitis. Am. J. Pathol. 160, 271–288 [DOI] [PMC free article] [PubMed] [Google Scholar]
- 63. Ousman S. S., and Campbell I. L. (2005) Regulation of murine interferon regulatory factor (IRF) gene expression in the central nervous system determined by multiprobe RNase protection assay. Methods Mol. Med. 116, 115–134 [DOI] [PubMed] [Google Scholar]