

Abstract
Here, we report the design and use of G protein-coupled receptor-based biosensors to monitor ligand-mediated conformational changes in receptors in intact cells. These biosensors use bioluminescence resonance energy transfer with Renilla luciferase (RlucII) as an energy donor, placed at the distal end of the receptor C-tail, and the small fluorescent molecule FlAsH as an energy acceptor, its binding site inserted at different positions throughout the intracellular loops and C-terminal tail of the angiotensin II type I receptor. We verified that the modifications did not compromise receptor localization or function before proceeding further. Our biosensors were able to capture effects of both canonical and biased ligands, even to the extent of discriminating between different biased ligands. Using a combination of G protein inhibitors and HEK 293 cell lines that were CRISPR/Cas9-engineered to delete Gαq, Gα11, Gα12, and Gα13 or β-arrestins, we showed that Gαq and Gα11 are required for functional responses in conformational sensors in ICL3 but not ICL2. Loss of β-arrestin did not alter biased ligand effects on ICL2P2. We also demonstrate that such biosensors are portable between different cell types and yield context-dependent readouts of G protein-coupled receptor conformation. Our study provides mechanistic insights into signaling events that depend on either G proteins or β-arrestin.
Keywords: angiotensin II, cell signaling, G protein, G protein-coupled receptor (GPCR), signaling
Introduction
G protein-coupled receptors (GPCRs)3 constitute the largest class of membrane receptors. Encoded by >800 genes in the human genome, they represent targets of a variety of clinically used drugs. A single GPCR occupied by its cognate orthosteric or by allosteric ligands can trigger a complex array of signal transduction pathways, which can in some cases be selectively modulated through development and use of biased ligands (1). Such molecules can modulate a subset of the total signalosome, probably by inducing distinct conformational changes in GPCR structure, which translates into differential effector engagement. The development of such biased molecules, aside from creating powerful tools to study GPCR signaling, might also lead to clinically relevant compounds with better efficacy and side effect profiles.
To understand how pervasive functional selectivity is and how it might be exploited for therapeutic purposes, an increasing number of studies have focused on obtaining signaling signatures by measuring larger and larger numbers of signaling pathways potentially modulated by panels of receptor ligands (2–9). Such approaches are very useful because they can be used to identify novel pathways downstream of GPCRs and to capture the protean nature of receptor agonism (i.e. that in some cases antagonists act like agonists and vice versa) and can often link both therapeutic and adverse consequences to particular signaling pathways. However, when the relevant signaling pathways in a given cell type are incompletely understood, such profiles may be incomplete. Also, it is possible that the signalosome downstream of particular receptors may be different in distinct cells types, raising the issue of portability of signaling sensor platforms (10).
Structurally, GPCRs are characterized by an extracellular N-terminal tail, followed by seven transmembrane α-helices connected by three intracellular (ICL1–3) and three extracellular loops (ECL1–3), ending with an intracellular C-terminal tail (C-tail). GPCRs fold themselves into a barrel-like structure, with the seven transmembrane helices forming a cavity that serves in many cases as a ligand-binding domain. There are many optical approaches being used to understand GPCR signaling, interactions, and conformational dynamics (reviewed in Refs. 11 and 12). Previous studies have shown that engineering FlAsH-binding sequences into different positions in GPCRs with FRET or bioluminescence resonance energy transfer (BRET) partners, such as YFP or Renilla luciferase, can be used to produce biosensors that report on ligand-induced conformational changes in receptors (13–18) or downstream effectors (19–21). In this regard, we have engineered several GPCR-based biosensors to monitor ligand-mediated conformational changes in intact HEK 293 cells and in vascular smooth muscle cells from distinct vantage points. A set of biosensors was generated for the angiotensin II (Ang II) AT1 receptor (AT1R), a prototypical Gαq-coupled GPCR, where we examined responses to balanced and biased ligands (22) as well as the role of cell context in determining conformational outcomes. Combining such biosensor approaches with selective knock-out of G proteins or β-arrestin isoforms using CRISPR/Cas9 offers insights into the role of receptor/G protein or receptor/β-arrestin interactions in driving receptor conformational responses to ligands.
Results
Validating AT1R-based Conformational Biosensors
We began by engineering the FlAsH binding sequence into three positions in ICL2, five positions in ICL3, and one position in the C-tail of AT1R, which had also been tagged with Renilla luciferase in the distal C-tail (Fig. 1, A and C). The position of our insertions can also be seen in a 3D rendering based on the published structure of the AT1R (Fig. 1B), although C-tail constructs are not visible because they were not represented in the structure published (23). To determine whether such constructs act as viable biosensors of receptor conformation, we first tested whether they were localized to the cell surface in HEK 293 cells and whether they retained functionality when stimulated with Ang II. With no effort made to control receptor expression levels per se, we could detect similar total levels of receptor expression (supplemental Fig. 1B) and significant surface labeling of ICL2P2, ICL2P3, ICL3P2, ICL3P3, ICL3P4, ICL3P5, and C-tailP1 (supplemental Fig. 1, A and C). All of the tagged constructs showed Ang II-mediated activation of ERK1/2, although not as robustly compared with wild type or the C-tailP1 constructs (supplemental Fig. 1D). Constructs that did not show both cell surface labeling and Ang II-mediated signaling were excluded from subsequent analysis. Thus, ICL2P1 (supplemental Fig. 1D) and ICL3P1 (which did not express at the cell surface; data not shown) were excluded from subsequent analysis.
FIGURE 1.

Sensor design and location. A, schematic of all FlAsHwalk-tagged AT1R sensors that also carry an N-terminal FLAG epitope for immunodetection and a modified Renilla luciferase fused to the C terminus of the receptor. The red square defines regions of the receptor containing the FlAsH binding sequence. B, 3D view of biosensor location in AT1R. Shown is a ribbon representation of the human AT1 receptor structure generated using the web-based application I-TASSER (51) based on the recently acquired crystal structure of the human AT1R bound to the antagonist ZD7155 (Protein Data Bank code 4YAY). Corresponding intracellular loops are shown in yellow, and FlAsH insertion positions are in green. The FlAsH insertion at the C-tail is not shown because the structure of this receptor domain was not resolved. Positions marked in red show sensors that were defective in either surface trafficking or signaling. Left, ICL2 sensors; right, ICL3 sensors. C, amino acid sequence of the different intracellular receptor regions targeted by the FlAsHwalk strategy (black lettering) and their corresponding sites of FlAsH binding sequence (red).
Capturing Biased Signaling with Conformational Biosensors
Even in the absence of receptor stimulation, there were differences in basal levels of BRET when the different biosensors were compared (supplemental Fig. 1E). This could indicate real differences depending on the relative positions of donor and acceptor moieties or could simply reflect the differences in expression level, subcellular localization, or functionality because of the insertion. Thus, we compared agonist responses using a small panel of AT1R ligands across the different sensors. There were minimal responses to Ang II, Ang III, or any of several biased AT1R ligands at ICL2P3, ICL3P2, or ICL3P5 (supplemental Fig. 2, A–C). There were similar responses for all ligands except SBpA at ICL3P4 (supplemental Fig. 2D). However, significant differences could be detected between Ang II and Ang III, ligands that activate all downstream signaling pathways, compared with the β-arrestin-biased ligands SI, SII, and SBpA with the other biosensors. For ICL2P2, there was almost no response to Ang II or Ang III but robust responses to all of the biased ligands except DVG (Fig. 2A). Conversely, there were robust responses to the balanced ligands for ICL3P3 and C-tailP1 and much smaller responses to any of the biased ligands again with the exception of DVG at ICL3P3 or SBpA at C-tailP1 (Fig. 2, B and C). As a control, no agonist responses were detected when cells expressing WT (untagged) receptors were labeled with the FlAsH reagent (supplemental Fig. 2A, inset). The responses detected by these three biosensors could be seen in real time, were dose-dependent (Fig. 3 (A–C), left and right panels), and were blocked in the presence of the AT1R antagonist losartan (Fig. 3A, right, inset). Thus, with a small number of conformational biosensors, we can capture different ligand-specific patterns of bias in a simple and robust way (summarized in Fig. 2D).
FIGURE 2.
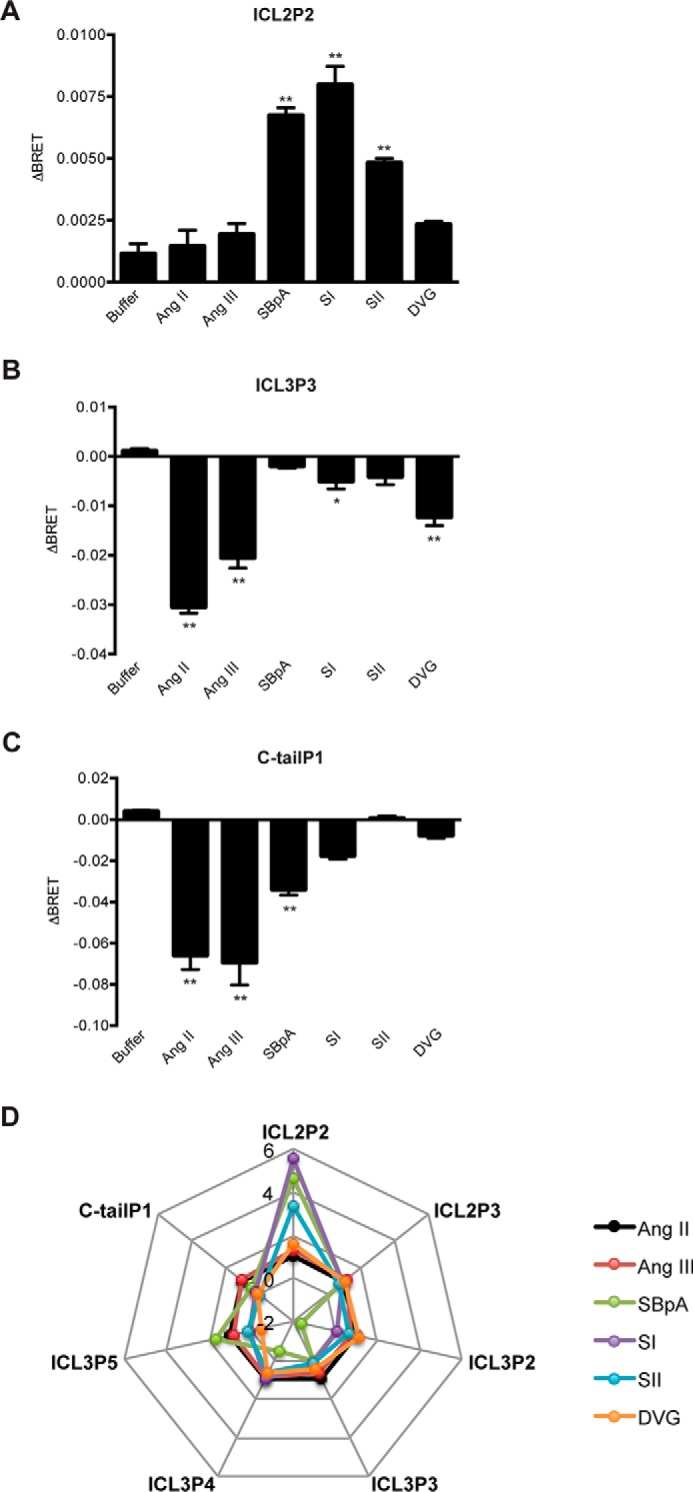
Agonist-induced BRET changes. The sensor panel was transiently expressed in HEK 293 cells, and FlAsH-labeled and agonist-induced BRET was measured and calculated as described under “Experimental Procedures”; ICL2P2 (A), ICL3P3 (B), and C-tailP1 (C). Bars, mean ± S.E. (error bars) of ΔBRET of 3–6 replicates from three independent experiments. Statistical analysis was performed as described under “Experimental Procedures.” *, p < 0.05; **, p < 0.01. D, radar plot representation to capture ligand bias using conformational profiling. Ligand responses (i.e. the agonist-induced BRET) shown above were normalized to those of Ang II, which was set to 1 for all biosensors tested.
FIGURE 3.

Kinetics (left) and dose-response curves (right) for the different conformational biosensors. Shown are ICL3P3 (A), ICL2P2 (B), and C-tailP1 (C) with Ang II (A and C) or SI (B) in HEK 293 cells. Data represent averages ± S.E. (error bars) of three experiments. Arrow, time of injection. Inset, effect of 10 μm losartan or vehicle pretreatment on Ang II-induced BRET changes in the ICL3P3 sensor (A) (n = 3, mean ± S.E.). Statistical analysis was performed as described under “Experimental Procedures.” *, p < 0.05.
Exploring the Role of G Proteins and β-Arrestin in Driving Receptor Conformations
Many studies have suggested that biased responses to AT1R ligands like SII are G protein-independent and simply require agonist-dependent recruitment of β-arrestin (24, 25). We next wanted to determine how the biosensors responded to the different ligands when we modulated G protein function either pharmacologically or via CRISPR-mediated gene deletion. We began with a HEK 293 cell line gene deleted for Gαq, Gα11, Gα12, and Gα13 using CRISPR (ΔGαq/11/12/13 line). Data shown in Fig. 4 indicate that signaling responses to the G proteins are compromised when they are absent. We first examined ICL3P3 and C-tailP1 in the ΔGαq/11/12/13line. In the absence of the G proteins, the response to Ang II was essentially lost but could be restored when either Gαq or Gα11 was returned to these cells (Fig. 5, A and B). Although it has been shown that the AT1R can couple to Gα12 (reviewed in Ref. 26), the replacement of either Gα12 or Gα13 in the CRISPR line did not rescue the conformational responses detected in ICL3 or the C-tail.
FIGURE 4.

Characterization of the CRISPR-generated quadruple Gαq/11/12/13-knock-out HEK 293 cells. A, Western blotting (IB) analysis of Gα expression. Note that there is a faint band for Gαq, which corresponds to an in-frame, loss-of-function mutant protein. Anti-Gα12 antibodies work poorly, and there were nonspecific bands (open arrowheads) near the faint endogenous Gα12 band (closed arrowhead). Similar results were obtained with two different commercially available antibodies (sc-409 (Santa Cruz Biotechnology) and 26026 (New East Biosciences)). B, Ca2+ influx assays using a FLIPR Calcium 5 kit to detect intracellular Ca2+ signal. Parental cells and the Gαq/11/12/13-knock-out line were transfected with a plasmid encoding the histamine H1 receptor and loaded with the Calcium 5 dye. The cells were treated with histamine or vehicle. C, SRF-RE reporter assays. We showed that the SRF-RE promoter assays (Promega) detect both Gαq and Gα12 responses. Parental cells and the Gαq/11/12/13-knock-out cells transiently expressing histamine H1 receptor, AT1R, or lysophosphatidylserine GPR174 (all in combination with the SRF-RE firefly luciferase plus CMV-driven Renilla luciferase) were treated with corresponding ligands. Fluc and Rluc signals were detected by dual measurement of both luciferases. Error bars, S.E.
FIGURE 5.

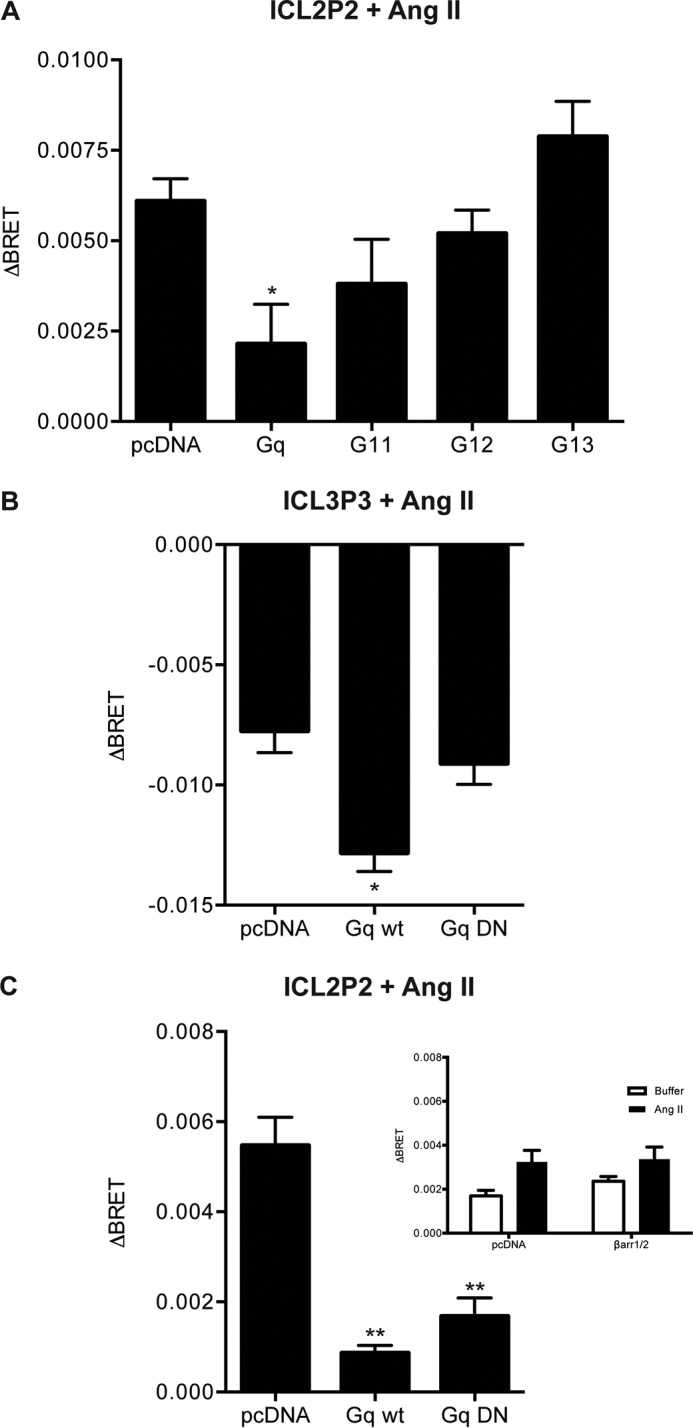
Effect of Gα gene deletion on agonist-induced BRET changes in conformational biosensors. The ICL3P3 (A), C-tailP1 (B), and ICL2P2 sensors (C–E) were transiently expressed in the ΔGαq/11/12/13 line (A–C) in the absence (pcDNA) or presence of either Gαq, Gα11, Gα12, or Gα13, and BRET was measured in response to 1 μm Ang II (A and B) or 10 μm SI (C). In D, a CRISPR line with β-arrestin 1/2 deleted was tested with ICL2P2 in response to 10 μm SI when expression of either β-arrestin 1, β-arrestin 2, or both was restored or not. Bars, averages of ΔBRET ± S.E. (error bars) of 3–6 replicates from three or four independent experiments. Statistical analysis was performed as described under “Experimental Procedures.” *, p < 0.05; **, p < 0.01. E, HEK 293 cells were transfected with control or β-arrestin 1/2 siRNA as well as the ICL2P2 sensor and stimulated with 10 μm SI. Data are shown as individual experiments performed in triplicate, and the lines represent the average.
However, we could still detect a robust response to SI at ICL2P2, and returning each of the Gα subunits individually in turn had no effect on the response, suggesting that, in fact, this conformational change in response to SI was independent of the G proteins deleted (Fig. 5C). Next, we assessed whether ICL2P2 responses might be affected when β-arrestin 1/2 were removed. First, we used an HEK 293 CRISPR line gene deleted for β-arrestin 1 and 2 (27) (also see supplemental Fig. 3A). Surprisingly, no effect was detected in the ICL2P2 responses to SI, suggesting that conformations driven by the biased ligand do not require either G protein or β-arrestin (Fig. 5D, compare first and last bars). No differences were detected when β-arrestin 1/2 were restored to the CRISPR cell line (Fig. 5D, middle bars; also see supplemental Fig. 3A). A similar result was obtained using transfected β-arrestin siRNA (Fig. 5E and supplemental Fig. 3B). Thus, SI can drive the conformational change whether or not β-arrestin is present, and recruitment of β-arrestin may follow the conformation induced by the biased ligand.
We still wanted to examine whether the G protein partner constrained receptor conformation. We noted that in the absence of G proteins, Ang II could produce a response at ICL2P2 (Fig. 6A, first column), whereas there was no response in HEK 293 cells with the native complement of G proteins (Fig. 2A). When we restored expression of Gαq or, to a lesser extent, Gα11 in the ΔGαq/11/12/13 line, we noted that the response to Ang II was dampened to the level seen in native HEK 293 cells (Fig. 6A). These results suggest that the Gαq or Gα11 protein partner constrains responses to Ang II in a manner distinct from SI. Although this does not settle the question of G protein independence of biased signaling, it does argue that the G protein alters the conformational responses to Ang II.
FIGURE 6.
The presence of Gαq/11 alters conformational responses to Ang II. ICL2P2 (A and C) or ICL3P3 (B) sensors were transiently expressed in the ΔGαq/11/12/13 line, with or without restoration of different Gα subunits, and stimulated as before with 1 μm Ang II. In B and C, either wild type or a dominant negative version of Gαq was used. Inset to C, a similar experiment conducted in the β-arrestin CRISPR, where β-arrestin expression was restored or not. Bars, mean ± S.E. (error bars) of ΔBRET of 3–6 replicates from three independent experiments. For each sensor, statistical analysis was performed as described under “Experimental Procedures.” *, p < 0.05; **, p < 0.01.
Previous studies have also shown that AT1R is coupled to Gαi/o as well (reviewed in Ref. 26). Interestingly, other differences were revealed when cells were pretreated with PTX to inhibit Gαi/o. In native HEK 293 cells, PTX pretreatment had no effect on responses in C-tailP1 to Ang II (Table 1, top). However, both ICL2P2 and ICL3P3 had responses reduced by ∼25% in response to SI and Ang II, respectively. This suggests that our sensors can also detect conformational changes in AT1R/Gαi/o interactions. However, a slightly different picture emerges in the CRISPR line (Table 1, bottom). Again, there was little change in the response measured to the C-tailP1 sensor, but there was a significant loss of signal from ICL3P3, suggesting that these two sensors report conformation in a distinct manner when the receptor is coupled to either Gαi/o or Gαq/11. However, the ICL2P2 response to PTX in the ΔGαq/11/12/13 line was the same as in native HEK 293 cells, again highlighting the insensitivity of ICL2P2 to the presence or absence of the G proteins we examined.
TABLE 1.
Effect of PTX on agonist-induced BRET changes
ΔBRET in different conformational biosensors was measured in HEK 293 (top) or the ΔGαq/11/12/13 line (bottom) pretreated with 100 ng/ml PTX or vehicle for 16 h before FlAsH labeling and BRET assessment. Results of PTX effect on each sensor tested and their corresponding agonists are expressed as percentage of ΔBRET in relation to the value from vehicle-pretreated cells fixed at 100%. Values are averages ± S.E. of three independent experiments.
| Sensor/Agonist | Average effect ± S.E. | n |
|---|---|---|
| % of vehicle-treated cells | ||
| HEK 293 cells | ||
| ICL2P2/SI | 76.9 ± 1.2 | 3 |
| ICL3P3/Ang II | 76.1 ± 7.3 | 3 |
| C-tailP1/Ang II | 94.9 ± 18.1 | 3 |
| ΔGq,11,12,13 cells | ||
| ICL2P2/SI | 83.9 ± 3.4 | 3 |
| ICL3P3/Ang II | 59.2 ± 6.9 | 3 |
| C-tailP1/Ang II | 95.4 ± 9.6 | 3 |
To explore the role of the “activatibility” of Gαq in altering the responses detected in ICL2P2 or ICL3P3, we used the ΔGαq/11/12/13 line and transfected these cells with either wild type or a dominant negative version of Gαq (28, 29). The effect of Gαq on Ang II responses in ICL2P2 could be mediated by either version of Gαq (Fig. 6B), suggesting that in this case, the G protein serves a structural role in constraining Ang II-induced conformational change. However, for ICL3P3, only the functional, wild type Gαq was able to rescue the loss of agonist-induced signal in the ΔGαq/11/12/13 line, showing that, in this case, receptor conformation is altered by the G protein as it also becomes activated (Fig. 6C). For the ICL2P2 sensor, the response to Ang II in the β-arrestin CRISPR line was similar to the parental cells, whether or not β-arrestin 1/2 expression was restored (Fig. 6C, inset). These results again highlight differences between conformations induced by Ang II versus biased ligands with respect to dependence on the G protein partner.
Conformational Biosensors Are Portable and Report Cellular Context
Finally, we wanted to assess whether the conformational biosensors were portable from one cell type to another, and also, we wanted to establish their value in a more physiologically relevant context. Thus, we engineered lentiviral versions of our biosensors and transduced rat vascular smooth muscle cells (VSMCs). As in the HEK 293 cells, basal BRET in ICL2P2 was lower than in ICL3P3 or C-tailP1 biosensors in VSMCs (Fig. 7A). However, our observations revealed an interesting pattern of changes in basal BRET, depending on whether the biosensors were expressed in HEK 293 cells, the ΔGαq/11/12/13 line, or VSMCs. Thus, we examined whether the environment in the cell could affect the conformation of AT1R and whether this could be detected by our biosensors when expression levels were controlled for. Returning the Gαq to the CRISPR line resulted in no change in total expression levels of the different sensors (supplemental Fig. 4A). We noted that basal BRET from ICL2P2, ICL3P3, or C-tailP1 did not depend directly on the co-expression of Gαq per se. However, it was clear that basal BRET in ICL3P3, in C-tailP1, and, most strikingly, in ICL2P2 were different, depending on the cell line or type examined (supplemental Fig. 4, B and C). This suggested that cellular context was a key determinant of basal BRET for the different biosensors.
FIGURE 7.
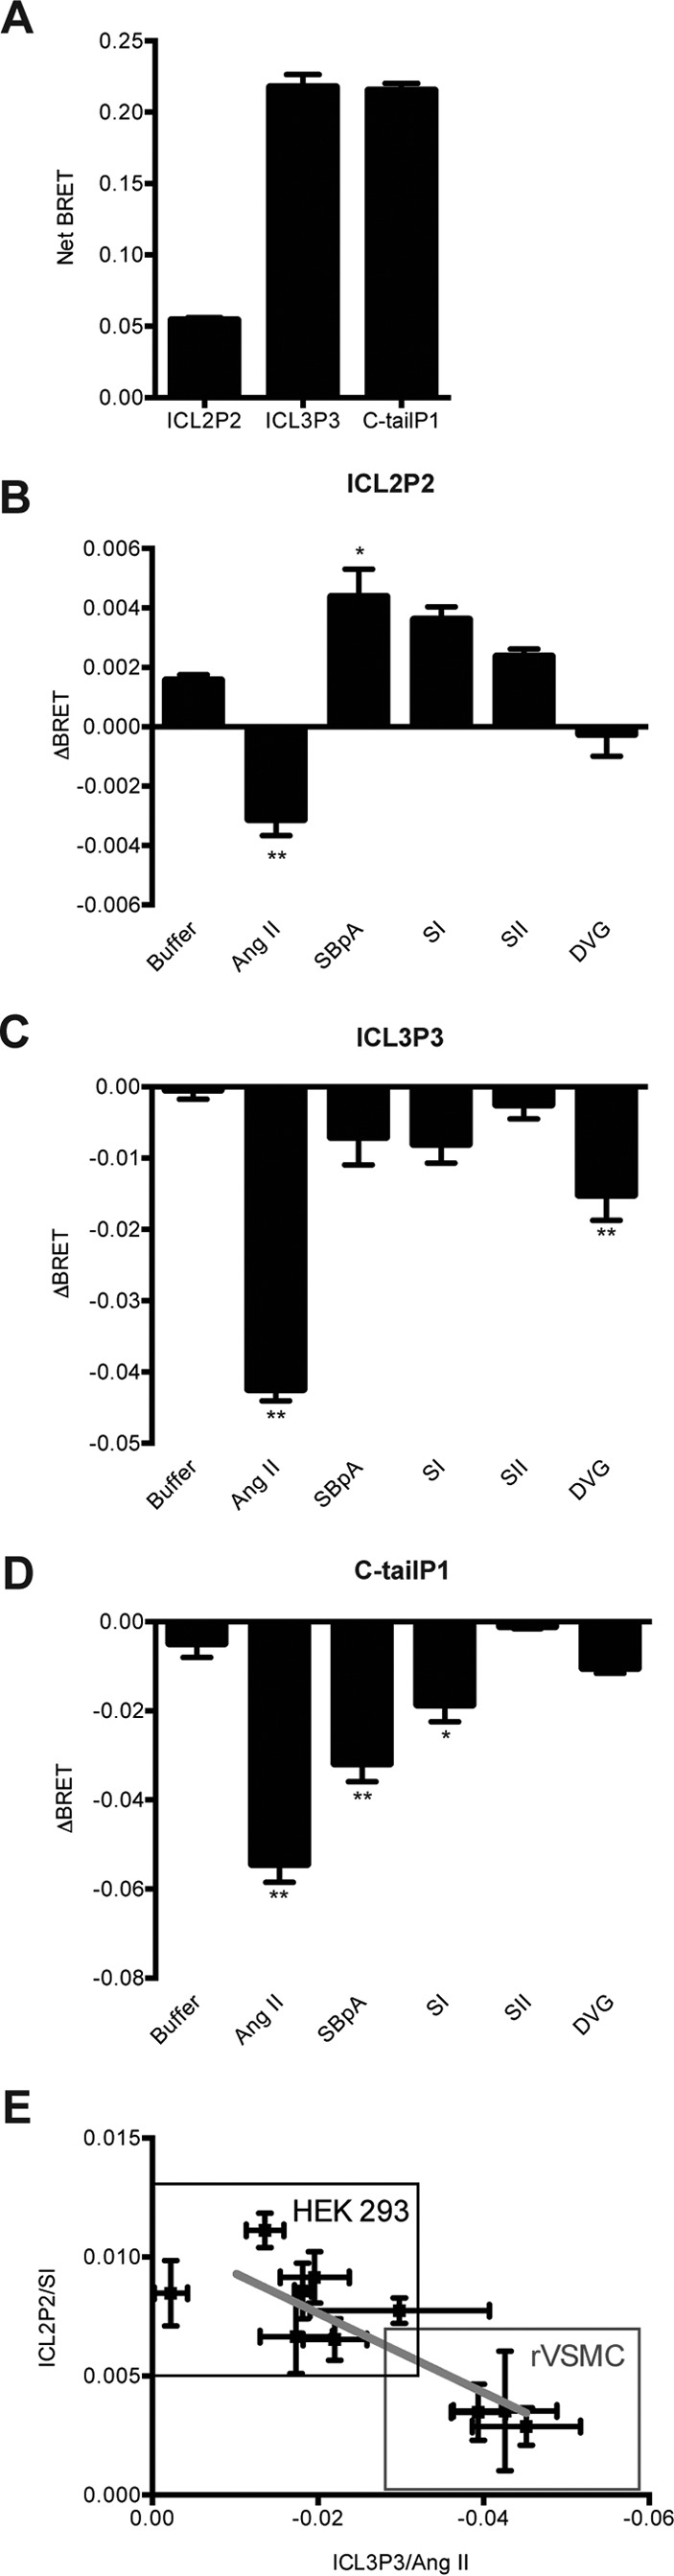
Monitoring conformational changes in AT1R in VSMCs. Shown are basal net BRET (A) and agonist-induced BRET changes (B) for the ICL2P2, ICL3P3 (C), and C-tailP1 (D) expressed in rat VSMCs; bars represent mean ± S.E. (error bars) of triplicate values from 3–5 independent experiments. For agonist, biosensors transiently expressed in rat VSMCs were measured and calculated as previously described. Statistical analysis for each analogue versus buffer treatment was performed as described under “Experimental Procedures.” *, p < 0.05; **, p < 0.01. E, correlation plot between responses in HEK 293 cells and VSMCs. Points represent ΔBRET values of SI-induced ICL2P2 and Ang II-induced ICL3P3 drawn from independent experiments done in both cell types. The plotted line shows linear regression for all experiments conducted (R2 = 0.7102, p < 0.05).
We next examined the effects of ligands on the biosensors expressed in VSMCs. Grossly, the responses measured in ICL3P3 or C-tailP1 were similar between VSMCs and HEK 293 cells (compare Figs. 2 (B and C) and 7 (C and D)). There were some small differences in responses measured for the four biased agonists (i.e. the loss of a response to DVG in VSMCs when measuring ICL2P2, although a similar trend was seen in HEK 293 cells), but the response to Ang II, not detected in HEK 293 cells, was not only detectable in VSMCs but in the opposite direction to the biased ligands (Fig. 7B). This again highlights the importance of cell context in the reports detected from these conformational biosensors. The effect of cell context could be seen more clearly when we plotted the net agonist responses from ICL2P2 and ICL3P3 for both HEK 293 cells and VSMCs. In the former, the reports at ICL2P2 were higher than for ICL3P3, whereas this was inverted in VSMCs (Fig. 7E). The difference in biosensor responses in both cell types tested was unlikely to be the result of either absolute or relative expression levels because total luminescence levels produced by both sensors were roughly similar between cells (supplemental Fig. 4D).
Effects of Modulating G Protein Function in VSMCs
Last, given our results in the ΔGαq/11/12/13 line, we wanted to examine the effects of G protein inhibition on the responses measured in VSMCs. In HEK 293 cells, the effect of the selective Gαq/11 inhibitor FR900359 showed that a functional Gαq was required for responses at both ICL3P3 and C-tailP1 with only a limited effect on ICL2P2, consistent with our results in the CRISPR cell line (Table 2, top). A similar effect for FR900359 was detected for ICL3P3 and C-tailP1 in VSMCs (Table 2, bottom). However, inhibition of Gαq also dampened the effect of Ang II on ICL2P2 in VSMCs (Table 2, bottom).
TABLE 2.
Effect of Gαq/11 inhibition on biosensor responses: effect of FR900359 on agonist-induced BRET changes
ΔBRET was measured from HEK 293 cells (top) or VSMCs (bottom) pretreated with 100 nm FR900359 or vehicle for 1–3 h before BRET assessment. Results of FR900359 effect on each sensor tested and their corresponding agonists are expressed as percentage of ΔBRET in relation to the value from vehicle-pretreated cells fixed at 100%. Values are averages ± S.E. of 3–4 independent experiments. The minus sign indicates a change in the polarity of the BRET signal.
| Sensor/Agonist | Average effect ± S.E. | n |
|---|---|---|
| % of vehicle-treated cells | ||
| HEK 293 cells | ||
| ICL2P2/SI | 91.7 ± 2.9 | 3 |
| ICL3P3/Ang II | 63.1 ± 4.3 | 4 |
| C-tailP1/Ang II | 67.4 ± 6.1 | 4 |
| VSMCs | ||
| ICL2P2/Ang II | −63.6 ± 49.7 | 3 |
| ICL3P3/Ang II | 73.4 ± 10.2 | 3 |
| C-tailP1/Ang II | 70.4 ± 2.1 | 3 |
Taken together, our results highlight the value of conformational biosensors in both capturing ligand bias in a simple and robust manner and also in capturing aspects of the receptor interactions with signaling partners and their mutual effects on receptor conformation in different cellular contexts.
Discussion
Here, we show that intramolecular conformational biosensors can capture important functional aspects of GPCRs. We also show that receptor conformation correlates to patterns established in a study of signaling outcomes for AT1R (9). Further, conformational changes were contingent on ligand structure, effector coupling, and cellular environment. We generated multiple biosensors engineered into the AT1R that showed rapid, sustained, and significant changes in BRET following treatment with both Ang II and Ang III as well as biased AT1R agonists. Further, these responses varied according to the position of the FlAsH binding site. Moreover, the biased agonists tested promoted distinct patterns of conformational changes compared with canonical ligands, such as Ang II or Ang III, which both showed similar profiles regardless of the biosensor used. Likewise, SI and SII, two biased ligands, also showed similar patterns. However, both SBpA and DVG had unique profiles (Fig. 2D), demonstrating the ability of a limited number of conformational biosensors to capture discrete aspects of signal bias. As mentioned above, such results are well correlated with previous studies of AT1R signaling (9) as well as a more recent study using FlAsH/BRET to study AT1R-induced conformational changes in β-arrestin (19). Other approaches have also yielded high quality information about the conformational dynamics of GPCRs but rely heavily on purified receptors and low throughput. For example, solution state NMR approaches have identified multiple conformations of the β2-adrenergic receptor (30), the A2-adenosine receptor (31), and the leukotriene B4 receptor (32) that are regulated by ligand occupancy on a millisecond time scale. Single molecule approaches also capture a similar conformational dynamism (33). Here, we show that different balanced (Ang II and Ang III), biased (SI, SII, DVG, and SBpA), or partial (SBpA) agonists select for distinct conformational states that also depend on cell context, including the complement of signaling partners for a given GPCR in a given cell. Our data also show that there are basal receptor conformations affected by cell context independently of G proteins that they normally couple to and that agonist-mediated responses are different, depending on the presence and type of G protein partners. Such considerations may reflect system bias as a possible explanation for different responses in different cell types. In such cases, bias depends on tissue context (34), and we have noted that with our biosensors as well. Such considerations might also be relevant when comparing where the receptor is in a given cell (35–39).
Our results also suggest that positioning conformational biosensors into ICL3 and the C-tail effectively reports canonical G protein-mediated signaling downstream of the AT1R. In fact, reports from the ICL3P3 sensor require the presence of Gαq/11, which seems to stabilize such conformational changes. Interestingly, neither Gα12 nor Gα13 was able to rescue Ang II-dependent changes at ICL3P3, highlighting the notion that different effectors must organize with receptors in distinct ways, distinct enough that our sensors could not detect the presence of Gα12/13 complexes. In contrast, the ICL2P2 sensor could capture the response to biased agonists, which did not depend on the direct presence of G proteins or β-arrestin, because they were similar in the CRISPR gene deletion lines. Curiously, our results also suggest that the ICL2P2 biosensor does become responsive to Ang II in the absence of Gαq/11 and that the presence of the G protein constrains such effects normally. Further, our study points to distinct structural versus functional roles in AT1R signaling complexes because, in some cases, a dominant negative G protein can have the same effect as the wild type Gαq (on ICL2P2), and sometimes only the wild type Gαq suffices (ICL3P3). Structural studies show that the G protein partner stabilizes receptor conformation (40–43), but our data suggest that both the nature and activatibility of the G protein may serve to further constrain such confirmations. Using tools such as RNA aptamers (44) or nanobodies (45), it is also possible to constrain GPCR conformation in a way that toggles receptors toward particular signaling phenotypes. It will be important to profile the CRISPR deletion line more carefully with respect to signaling in future.
Taken together, our results suggest that, in stages of receptor activation that occur before recruitment of β-arrestin, binding of canonical and biased AT1R agonists leads to distinct alterations in the relative orientation between the ICLs and the C-tail that are unique for different analogues tested. These tools may help to stratify biased orthosteric or allosteric ligand candidates and elucidate GPCR activation mechanisms. Our results are consistent with broader approaches to capture signal bias that depend on profiling signaling events but, in this case, rely on a much smaller group of biosensors that are completely portable from cell type to cell type and require no information a priori about the signaling partners (or their stoichiometry) in a novel cell environment. Such sensors can certainly complement or precede studies of receptor signaling. In conclusion, knowledge of conformation complements signaling signatures and offers more information for enhancing our understanding of receptor conformational dynamics, which will better inform the drug discovery process.
Experimental Procedures
Materials
All tissue culture reagents, media, Hanks' balanced salt solution (HBSS) buffer, and antibiotics came from Wisent (St. Bruno, Québec, Canada). Chemicals used, including angiotensin II and III and PTX, were from Sigma-Aldrich unless otherwise stated. FlAsH-EDT2 was custom made by Molecular Probes/Life Technologies (T34561). 1,2-Ethanedithiol (EDT) was from Aldrich, and 2,3-dimercapto-1-propanol (BAL) was from Fluka. Biased angiotensin II analogues were custom made at >98% purity (Lifetein, Hillsborough, NJ). The Gαq/11-specific inhibitor FR900359 (46) was purchased from the Institute of Pharmaceutical Biology (University of Bonn, Germany). DNA primers for mutagenesis were custom made by Integrated DNA Technologies (Coralville, IA). PvuII and TaqI restriction enzymes were from Takara Bio (Tokyo, Japan). Control (AllStars negative control, 1027281), β-arrestin 1 (SI02776921), and β-arrestin 2 siRNA (SI02776928) were from Qiagen (Toronto, Canada).
Antibodies used for Gαq/11/12/13-knock-out Cell Line Validation
Anti-Gαq antibody (catalog no. ab128060, goat polyclonal) and anti-Gα13 antibody (catalog no. ab128900, rabbit monoclonal, clone EPR5436) were from Abcam; anti-Gα11 antibody (catalog no. sc-390382, mouse monoclonal, clone D-6), anti-Gα12 antibody (catalog no. sc-409, rabbit polyclonal), and anti-α-tubulin antibody (catalog no. sc-32293, mouse monoclonal, clone DM1A) were from Santa Cruz Biotechnology, Inc.; anti-goat IgG secondary antibody conjugated with horseradish peroxidase (HRP) (catalog no. A201PS) was from American Qualex; anti-mouse IgG (catalog no. NA9310) and anti-rabbit IgG (catalog no. NA9340) secondary antibodies conjugated with HRP were from GE Healthcare. For immunoblotting analysis, the concentration and dilution of primary antibodies and secondary antibodies were 1 μg ml−1 and 1:2000, respectively.
Antibodies Used for Western Blotting, ERK1/2 MAPK Assay, and Immunofluorescence
The rabbit polyclonal antibody against the C-terminal domain of β-arrestins (antibody 3978) was a generous gift from Dr. S. Laporte (McGill University, Montréal, Canada). The mouse anti-GAPDH (AM4300) was obtained from ThermoFisher Scientific (Waltham, MA). Rabbit anti-p44/42 antibody (catalog no. 9101) was obtained from Cell Signaling Technology (Danvers, MA). The rabbit anti-ERK 1 (sc-94) that cross-reacts with ERK2 was from Santa Cruz Biotechnology, Inc. (Dallas, TX). The rabbit anti-FLAG antibody (F7425) and the secondary anti-rabbit (A0545) and anti-mouse (A9917) antibodies conjugated to horseradish peroxidase were from Sigma-Aldrich. Finally, the Alexa Fluor 488-conjugated secondary anti-rabbit antibody (A11034) was from Life Technologies, Inc. (Eugene, OR).
Cloning and Mutagenesis
Internally EE-tagged Gαq and Gα12 and untagged Gαq Q209L/D277N mutant, Gα11, and Gα13 were from the cDNA Resource Center (Bloomsburg University, Bloomsburg, PA). The insertion of 18 nucleotides (5′-tgctgccccggctgctgc-3′) coding for the minimal tetracysteine tag (CCPGCC) into different intracellular domain of AT1R was done by overlapping PCR (17). The template used to generate FlAsH mutants originates from the construct pcDNA3-SP-FLAG-hAT1R (47). All five FlAsH tag insertions into ICL3 were generated as described previously. Briefly, to generate five number 1 DNA fragments for the five different constructs, the forward common primer 5′-cctagctagctcgaggccaccatgaacacgatcatcg-3′ was used in conjunction with one of the following reverse primers: 5′-gcagcagccggggcagcacttccaaataagagtataac-3′ for position 1, 5′-gcagcagccggggcagcacttctttagggccttcca-3′ for position 2, 5′-gcagcagccggggcagcaaatttcataagccttctttag-3′ for position 3, 5′-gcagcagccggggcagcatttgttcttctgaatttc-3′ for position 4, or 5′-gcagcagccggggcagcaatcatttcttggtttgttc-3′ for position 5.
To generate five number 2 DNA fragments for the five different constructs, the following forward primers were used along with the common reverse primer, 5′-gatatcggatcctcactc-3′, 5′-tgctgccccggctgctgcgccctaaagaaggcttatg-3′ for position 1, 5′-tgctgccccggctgctgcgcttatgaaattcagaag-3′ for position 2, 5′-tgctgccccggctgctgccagaagaacaaaccaagaaatg-3′ for position 3, 5′-tgctgccccggctgctgccagaagaacaaaccaagaaatg-3′ for position 4, or 5′-tgctgccccggctgctgcgatatttttaagataattatgg-3′ for position 5.
Second round reactions using combined fragments 1 and 2 as templates were done using the main common forward and reverse primers detailed above (NheI is underlined, XhoI, is in italic type, BamHI is in underlined italic type, and ATG or the stop codon is in boldface type). The full receptor fragments obtained were digested with NheI and BamHI and inserted into pIRES puro3 (Clontech). Intramolecular FlAsH sensors (i.e. sensors containing both FlAsH tag and RlucII) were generated by first eliminating the stop codon by PCR using the common forward primer along with a reverse primer abolishing the stop codon 5′-ccgcggatccctcaacctcaaaacatggtg-3′ and cloning in pIRES-hyg3-cMyc-FP-RLuc (47) after extracting Myc-FP insert using BamHI and partially digested with NheI (there is one NheI site in Rluc). Finally, Rluc was replaced by RlucII (to increase sensitivity) by first amplifying RlucII by PCR to introduce the restriction sites AfeI and BstXI and then exchanging Rluc for RlucII using same restriction sites. The FlAsH tag insertion in ICL2 and in the C-tail was done the same way as described previously, and PCR products were cloned directly into pIRES-hyg3-RlucII vector using same common forward and reverse primers and these specific oligonucleotides (forward followed by reverse): 5′-tgctgccccggctgctgcattgttcacccaatgaag-3′ and 5′-gcagcagccggggcagcaagccaggtatcgatcaatg-3′ for ICL2 position 1; 5′-tgctgccccggctgctgctcccgccttcgacgcacaatg-3′ and 5′-gcagcagccggggcagcacttcattgggtgaacaatag-3′ for ICL2 position 2; 5′-tgctgccccggctgctgcatgcttgtagccaaagtc-3′ and 5′-gcagcagccggggcagcatgtgcgtcgaaggcgggac-3′ for ICL2 position 3; and 5′-tgctgccccggctgctgcatgagcacgctttcctac-3′ and 5′-gcagcagccggggcagcattttgttgaaaggtttgag-3′ for C-tail position 1.
ICL2P2, ICL3P3, and C-tailP1 intramolecular sensors were subcloned into the lentivirus vector pLVXi2H (48) using XhoI and BstXI. All constructs were verified by bidirectional DNA sequencing.
Cell Culture
HEK 293 cells (WT and CRISPR knock-out) were grown in 75-cm2 plastic flasks containing culture medium (DMEM high glucose supplemented with 5% (v/v) FBS). Cells were incubated at 37 °C in a tissue culture incubator providing a 5% CO2 atmosphere. Periodically, mycoplasma testing was performed on all cell lines using the MycoAlertTM kit (Lonza, Rockland, MD).
Generation of CRISPR Gene Deletion Lines
Gαq/11/12/13 gene-deleted HEK 293 cells were generated by simultaneously targeting the GNA12 and the GNA13 genes of previously established Gαq/11-KO HEK 293 cells (46), using a CRISPR/Cas9 system as described previously (49) with minor modifications. The sgRNA-encoding sequence targeting the GNA12 gene (5′-gttgatgcacgagataagct-3′) was inserted into the BbsI site of the pX330-U6-Chimeric_BB-CBh-hSpCas9 vector (a gift from Dr. Feng Zhang, Broad Institute; Addgene plasmid 42230) using two synthesized oligonucleotides (5′-caccgttgatgcacgagataagct-3′ and 5′-aaacagcttatctcgtgcatcaac-3′; FASMAC, Atsugi, Japan). Similarly, sgRNA sequence that targets the GNA13 gene (5′-ccagttgaaattctcgacgc-3′) was inserted using a pair of oligonucleotides (5′-caccgccagttgaaattctcgacgc-3′ and 5′-aaacgcgtcgagaatttcaactggc-3′; a guanine nucleotide was introduced at the −21 position of the sgRNA (underlined), which enhances transcription of the sgRNA). Correctly inserted sgRNA-encoding sequences were verified by sequencing using the Sanger method (FASMAC).
The Gαq/11 KO HEK 293 cells were seeded into 12-well plates and incubated for 24 h before transfection. A mixture of the GNA12-targeting vector (0.25 μg), the GNA13-targeting vector (0.25 μg), and a GFP-encoding plasmid vector (pGreenLantern-1; Gibco; 0.1 μg) was transfected into the Gαq/11 KO cells using Lipofectamine 2000 (Invitrogen). 24 h later, cells were harvested, and GFP-positive cells were isolated using a cell sorter (SH800, Sony). GFP-positive cells were diluted with DMEM supplemented with FBS and penicillin/streptomycin and subjected to a limiting dilution method to select clones. The cells were seeded in 96-well plates and incubated for approximately 2 weeks with the routine addition of fresh medium. After growing clonal cells, clones were analyzed for mutations in the targeted sites using PCR and restriction enzyme digestion, using the following primers and restriction enzymes: 5′-agcttctctagcgtggtttagtc-3′ and 5′-actatcaggtgcccagcaag-3′ with HindIII (for the GNA12 gene) and 5′-gcccaaggaatggtggaaac-3′ and 5′-aggacacattaggtctgtgcc-3′ with TaqI (for the GNA13 gene). PCR was performed with an initial denaturation cycle of 95 °C for 2 min, followed by 35 cycles of 95 °C for 15 s, 64 °C for 30 s, and 72 °C for 30 s. The resulting PCR product (5 μl) was digested with a corresponding restriction enzyme (0.5 μl) in a reaction buffer (10 μl) and incubated at 37 °C for 1 h. The digests were loaded in an agarose gel containing ethidium bromide and subjected to electrophoresis. The DNA fragments of the resulting agarose gel were visualized on a UV lamp. Candidate clones that harbored restriction enzyme-resistant PCR fragments were analyzed for genomic DNA sequencing by TA cloning. The lack of functional Gα12/13 was also confirmed by Western blotting and functional analyses, including an SRF-RE reporter assay (Promega). After functional characterization, stable ΔGαq/11/12/13 lines were established. Using a similar approach, an HEK 293 cell line that lacks both arrestin 2 and 3 (β-arrestin 1 and 2) was generated and validated; the knock-out of the two genes did not affect expression of either Gαq/11 or Gαi1/2 and did not impede ATP-induced Ca2+ responses (27).
Lentivirus Production and VSMC Transduction
10 million HEK 293T cells in suspension in complete medium were transfected with a mixture of 10 μg of sensor cloned in pLVXi2H, 9 μg of psPAX2, and 1 μg pMD2.G (both from Addgene, Cambridge, MA) and Lipofectamine 2000 (Invitrogen) according to the manufacturers' recommendations; plated into 75-cm2 plastic flasks; and left to grow for 24 h. The next day, medium was changed, and cells were left for another 24 h. 48 h post-transfection, the cell medium containing virus was harvested, passed through a 0.45-μm sterile filter, and frozen in aliquots at −80 °C. Rat vascular smooth muscle cells (VSMCs, a generous gift of Dr. Marc Servant, Faculty of Pharmacy, Université de Montréal, Canada) grown in DMEM (high glucose) supplemented with 10% FBS until ∼80% confluence were trypsinized, and 10,000 cells/well were plated into a polyornithine-coated white 96-well plate (see below for details) in the same medium and left to grow for 24 h. The culture medium was then aspirated, and 100 μl of the viral preparation supplemented with 10 μg/ml Polybrene was added and left for 24 h for the transduction to occur. The transduced VSMCs were washed three times with the culture medium and left for another 24 h. At that stage, cells were ready to be FlAsH-labeled and BRET-monitored as described below.
Cell Transfection
When cell confluence reached ∼80-100%, cells were trypsinized and seeded to 6-well plates for transfection and left overnight in the tissue culture incubator. On the next day, medium from the plate was replaced by 2 ml of transfection medium (DMEM high glucose supplemented with 2.5% (v/v) FBS). Cells were then transfected using Lipofectamine 2000 following the manufacturer's recommendations. 24 h post-transfection, transfected cells were detached using trypsin, and 30,000–50,000 cells were transferred to wells of a white 96-well plate (Costar catalog no. 3917, Corning) coated with poly-l-ornithine hydrobromide (Sigma-Aldrich). The 96-well plate was placed in the tissue culture incubator for another 24 h and then subjected to FlAsH labeling.
siRNA Knockdown of β-Arrestin 1/2
HEK293 cells were co-transfected with either the control or an equal amount of β-arrestin 1 and 2 siRNAs to a final concentration of 50 nm along with the FlAsH sensor using Lipofectamine 2000 as described above. 48 h post-transfection, cells were replated and left to grow for another 24 h in both a white 96-well plate for FlAsH labeling and the BRET assay and into 12-well plates for Western blotting analysis to monitor knockdown efficiency.
FlAsH Labeling
FlAsH labeling was performed as described elsewhere (17). Briefly, 3.73 μl of a 25 mm EDT solution in DMSO was mixed with 1.87 μl of FlAsH-EDT2 stock reagent and left to rest for 10 min at room temperature. Then 100 μl of HBSS was added to the mix and left for 5 min, and volume was completed to 5 ml with HBSS; this constituted the labeling solution. Transfected HEK 293 cells and virally transduced VSMCs from the 96-well plate were first washed once with HBSS, and then 50 μl of labeling solution was added per well. The plate was incubated for 1 h at 37 °C. At the end of the incubation period, the labeling solution was removed, and cells were washed twice with 100 μm BAL in HBSS as follows. For the first wash, cells were left in BAL washing buffer for 10 min at 37 °C, followed by a second rapid washing step. Then cells were washed with Krebs/HEPES buffer (146 mm NaCl, 4.2 mm KCl, 0.5 mm MgCl2, 1 mm CaCl2, 5.9 mm glucose, and 10 mm HEPES buffer, pH 7.4). Finally, 80 μl of Krebs/HEPES buffer was added per well, and the plate was left to rest at room temperature for at least 2 h before BRET assessment.
BRET
At the end of the settling time in plates, 10 μl of a 20 μm coelenterazine-h (NanoLight Technologies, Pinetop, AZ) solution in Krebs/HEPES buffer was added to each well and left to rest for 5 min at room temperature. BRET was measured using plate readers equipped with in-line injectors (Synergy 2 from Bio Tek or Victor-X-light from PerkinElmer Life Sciences) that can measure light emission at both 485- and 528-nm wavelengths for 200 ms/filter alternatively and repeatedly for 30 s at room temperature. To investigate the effect of AT1R analogues on BRET signals, 10 μl of a 10× concentrated solution in Krebs/HEPES buffer was added directly to wells using the injector, and BRET reading was continued for another 60 s. BRET was calculated as the emission at 528 nm/emission at 485 nm. For calculating agonist-induced BRET changes, ΔBRET = BRET after agonist treatment (averaged data of the last 30 s of measurement) − BRET before treatment (averaged data of all 30 s of measurement). For net BRET calculation, net BRET = BRET (from transfected and labeled cells) − BRET (from transfected but unlabeled cells). Data were plotted and analyzed using GraphPad Prism version 6 (GraphPad Software, La Jolla, CA).
ERK1/2 MAPK Assay
24 h post-transfection, HEK 293 cells were replated in 12-well plates in complete medium and left to grow for another 24 h. Cells were serum-starved for 2–3 h and then stimulated with 1 μm Ang II for 5 min at 37 °C. At the end of the incubation time, wells were rinsed once with ice-cold PBS, and cells were lysed directly in Laemmli buffer (2% SDS, 10% glycerol, 60 mm Tris, pH 6.8, 0.02% bromphenol blue, 5% β-mercaptoethanol). Samples were sonicated for 10 s, heated to 65 °C for 15 min, and analyzed by Western blotting following SDS-PAGE. An anti-p44/42 antibody was used to detect phospho-ERK (1:1000 dilution). A secondary anti-rabbit antibody conjugated to horseradish peroxidase was used to visualize the bands on film by chemiluminescence (1:40,000 dilution). Membranes were stripped and probed with an anti-ERK1/2 antibody to control for loading. Films were scanned, and images were processed using ImageJ to obtain band intensity. Data for receptor biosensor constructs were normalized by dividing the intensity of phospho-ERK1/2 by ERK1/2 and expressed as relative values to the untagged receptor.
Immunodetection of β-Arrestin
Detection of β-arrestin was done essentially as described above using an anti-β-arrestin rabbit polyclonal antibody (1:5000 dilution), and the same secondary antibody was used as above at 1:40,000 dilution. Membrane was then stripped and reprobed with a mouse anti-GAPDH antibody (1:30,000 dilution, primary; 1:40,000 dilution, secondary) to control for loading.
Immunodetection of G Protein
The parental HEK 293 cells and the ΔGαq/11/12/13 line-in growth phase were harvested, and ∼1 × 10⁶ cells were lysed in 500 μl of SDS-PAGE sample buffer (62.5 mm Tris-HCl (pH 6.8), 50 mm dithiothreitol, 2% SDS, 10% glycerol, and 4 m urea) containing 1 mm EDTA and 1 mm phenylmethylsulfonyl fluoride. Cell lysates were homogenized with a hand-held ultrasonic homogenizer (Microtech) and heated to 95 °C for 5 min. Protein extracts were loaded and separated on SDS-containing 12.5% acrylamide gel. After electrophoresis, the gel was blotted to a nitrocellulose membrane. The blotted membrane was blocked with 5% skim milk-containing blotting buffer (10 mm Tris-HCl (pH 7.4), 190 mm NaCl, and 0.05% Tween 20), immunoblotting with primary and secondary antibodies as indicated under “Materials.” Chemiluminescent reagent (ImmunoStar® Zeta, Wako Pure Chemical Industries, Tokyo, Japan) was added on the membrane, and the chemiluminescence signals were detected using LAS-4000 (FujiFilm) and visualized with Multi Gauge version 3.0 (FujiFilm).
Dual-Luciferase Assay to Measure SRF-RE Promoter Activity
Dual-Luciferase assays measuring SRF-RE promoter activity (Promega) were performed according to the manufacturer's instructions with minor modifications. Briefly, parental HEK 293 cells and the ΔGαq/11/12/13 line were harvested, suspended in Opti-MEM (ThermoFisher Scientific) at 2.5 × 10⁵ cells/ml, and seeded in a 96-well white plate (80 μl/well; CELLSTAR Advanced TCTM, μclear®; Greiner Bio-One). After brief incubation, cells were transfected with a mixture of plasmids (for each well, 50 ng of pGL4.34 encoding SRF-RE-driven reporter luciferase (luc2P), 2 ng of pGL4.75 encoding CMV-driven internal control Renilla luciferase, and 8 ng of GPCR-encoding plasmid) using a Lipofectamine® 2000 transfection reagent (0.1 μl). The pGL4.34 and the pRL-CMV were from Promega, and GPCR-encoding plasmids (human-derived H1 histamine receptors, AT1R and GPR174, which coupled with Gαq, Gαq/G12, and G12, respectively) were described previously (50). After a 1-day incubation, the transfected cells were stimulated with 5× GPCR ligands (100 nm histamine dihydrochloride, 100 nm Ang II, and 1 μm 1-oleoyl lysophosphatidylserine for H1 histamine receptors, AT1R, and GPR174, respectively) diluted with Opti-MEM for 6 h at 37 °C in a CO2 incubator. The conditioned medium was removed, and the cells were rinsed with Dulbecco's PBS. The cells were lysed with a passive lysis buffer (20 μl/well) for a 15-min incubation. The clear bottom of the 96-well plate was sealed with an adhesive seal (PerkinElmer Life Sciences). The lysate was mixed with Luciferase Assay Reagent II (20 μl/well; Promega), and firefly luciferase activity derived from the SRF-RE reporter was measured by a microplate reader (FlexStation 3, Molecular Devices) with an integration time of 1 s/well. The lysate was further mixed with Stop and Glo® reagent (20 μl per well; Promega), and Renilla luciferase activity derived from the internal control reporter was measured with an integration time of 1 s/well. Firefly luciferase signals were normalized to Renilla luciferase signal, and vehicle-treated units were set at 1 (50).
Measurement of Intracellular Ca2+ Mobilization
Parental cells and the ΔGαq/11/12/13 line were seeded in a 10-cm dish at a concentration of 2 × 10⁵ cells/ml (10 ml/dish) and cultured for 1 day. The cells were transfected with human histamine H1 receptor-encoding expression plasmid (50) (2.5 μg) using Lipofectamine® 2000 transfection reagent (12.5 μl; ThermoFisher Scientific). After 1 day of incubation, the cells were detached with 0.05% (w/v) trypsin containing 0.52 mm EDTA and mixed with DMEM supplemented with 10% FBS. After centrifugation and rinse with Dulbecco's PBS, cells were suspended in HBSS containing 5 mm HEPES (pH 7.4) at a concentration of 6 × 10⁵ cells/ml and seeded in a 96-well half-area black plate (80 μl/well; CELLSTAR Advanced TCTM half-area, μclear®; Greiner Bio-One). Cells were loaded with a FLIPR Calcium 5 Ca2+ indicator (20 μl/well; Molecular Devices) supplemented with probenecid (Wako Pure Chemicals) and bovine serum albumin (BSA; SERVA Electrophoreses, Heidelberg, Germany) at final concentrations of 2.5 mm and 0.01% (w/v), respectively. After a 1-h incubation at 37 °C, the cell plate and a compound source plate containing 5× histamine dihydrochloride (a final concentration of 10 μm) diluted in vehicle (HBSS with 5 mm HEPES (pH 7.4), 2.5 mm probenecid, and 0.01% BSA) were positioned in a liquid-handling fluorescence microplate reader (FlexStation 3, Molecular Devices). After initial measurement, fluorescence signals were taken every 1.5 s with a Flex mode using automated pipetting (25 μl of compound/well). Data were expressed as relative fluorescence normalized to initial signal.
Immunofluorescence
24 h post-transfection, HEK 293 cells were replated, as described previously, into a black 96-well plate with a clear bottom (catalog no. 165305, Nunc) that was previously treated with polyornithine in complete medium and left to grow for another 24 h. The medium was aspirated, and cells were fixed in a solution of 2% (w/v) paraformaldehyde in PBS (137 mm NaCl, 2.7 mm KCl, 10.14 mm Na2HPO4, and 1.76 mm KH2PO4 at pH 7.4) for 10 min at room temperature, followed by two PBS washes. To decrease nonspecific antibody binding, a solution of 1% (w/v) BSA in PBS (blocking solution) was added to the well and left for 1 h at room temperature. FLAG-tagged WT AT1R and the FlAsH carrying receptor sensors were immunodetected using an anti-FLAG primary antibody (at 1:200 in blocking solution) followed, after two PBS washes, by an Alexa Fluor 488-conjugated secondary antibody (at 1:500). The immunostaining procedure was completed by a nucleus-staining step using a 1 μg/ml solution of Hoechst 33342 in blocking solution followed by three PBS washes. Stained cells were left in the same buffer until imaging. Images were captured using an Operetta High Content Imaging system with a 20× WD objective (PerkinElmer Life Sciences) equipped with a compatible filter set for Alexa Fluor 488 detection (475/15-nm excitation filter and 525/25-nm emission filter) and for Hoechst (380/20-nm excitation filter and 445/35-nm emission filter).
Receptor Quantification by Immunofluorescence
24 h post-transfection, HEK 293 cells were replated as described previously into a black 96-well plate (Costar catalog no. 3916, Corning) precoated with polyornithine in complete medium in 5 wells/condition (1 well for background and 4 wells to measure fluorophore-originated fluorescence). The medium was aspirated, and cells were fixed in a solution of 2% (w/v) paraformaldehyde in PBS for 10 min at room temperature, followed by three Krebs/HEPES buffer washes. To quantify total receptor level (i.e. surface and intracellular), fixed cells were permeabilized by treating with a solution of 0.1% (v/v) Triton X-100 in Krebs/HEPES for 10 min at room temperature followed by three buffer washes. Unpermeabilized cells will allow cell surface receptor quantification. Nonspecific site blockage was done by leaving the cells for 1 h at room temperature in a 1% (w/v) BSA solution diluted in Krebs/HEPES (blocking solution). FLAG-tagged receptor was detected by first exposing cells to the same anti-FLAG antibody (at 1:200 for non-permeabilized and at 1:500 in permeabilized cells in blocking solution) as described above except that the FLAG antibody was left overnight at 4 °C, followed by three Krebs/HEPES buffer washes. Finally, cells were incubated with a solution of Alexa Fluor 488-conjugated anti-rabbit antibody (at 1:500 in blocking solution) and 1 μg/ml Hoechst for 1 h at room temperature, followed by three Krebs/HEPES washes, and 100 μl of the same buffer was added to each well. To establish background signal level, some wells of each condition were not exposed to any antibody or fluorescent dyes. Fluorescence was recorded using a Synergy 2 plate reader (BioTek) with a 485/20-nm excitation filter and 528/20-nm emission filter for Alexa Fluor 488 and a 360/40-nm excitation filter and 460/40-nm emission filter for Hoechst. To calculate net fluorescence, we used the fluorescence signal from cells incubated with both Alexa Fluor 488 and Hoechst − background fluorescence values from cells not exposed to any fluorophore. Net fluorescence level was then normalized to cell contain by dividing the net Alexa Fluor 488 fluorescence by net Hoechst fluorescence. Finally, the calculated values of each experimental replicate were averaged. Data are presented as normalized fluorescence levels as 0% for pcDNA-only-transfected cells and 100% for WT receptor.
Data Analysis
All data represent the means ± S.E. of at least three independent experiments. Statistical analysis and curve fitting were carried out using GraphPad Prism version 6.0. Dose-response curves were fitted using the following three-parameter equation,
| (Eq. 1) |
where Top and Bottom represent the maximal and minimal asymptote of the curve, [A] is the agonist concentration expressed in m, and EC50 is the agonist concentration (m) that generated a response halfway between top and bottom. Statistical analyses on ΔBRET data were performed using Dunnett's test when comparing vehicle (buffer) versus agonist treatment data, and differences are considered significant with p < 0.05.
Author Contributions
T. E. H., D. D., and R. S. designed the study and D. D., R. S., D. P., A. Z., Y. S., and R. O. performed experiments. D. D. and R. S. analyzed the data. D. D., R. S., Y. S., A. I. and D. P. generated figures. D. D., R. S., A. I., J. A., and T. E. H. wrote and edited the paper.
Supplementary Material
Acknowledgments
We thank Dr. Wolfgang Reintsch (Green Chemistry CFI Imaging and Molecular Biology Platform, Montreal, Canada) for assistance with high content microscopy. We thank Dr. Kumiko Makide, Akiharu Umiwazu, and Fumie Morikawa (Tohoku University) for technical assistance with FACS isolation, CRISPR/Cas9 techniques, and cell maintenance, respectively. We also thank Marc-André Bourassa (McGill University) for assistance in cloning biosensors and Dr. Nicolas Audet (McGill University) for discussions regarding statistical analysis. This work was initiated out of long discussions with Dr. Vic Rebois over many years, and we acknowledge his wisdom with great gratitude.
This work was supported by a grant from the Consortium Québécois sur la Découverte du Médicament and Canadian Institutes of Health Research (CIHR) Grant MOP-130309 (to T. E. H.) as well as grants from PRESTO, JST (to A. I.) and AMED-CREST (to J. A.). The authors declare that they have no conflicts of interest with the contents of this article.

This article contains supplemental Figs. 1–4.
- GPCR
- G protein-coupled receptor
- BRET
- bioluminescence resonance energy transfer
- Ang
- angiotensin
- AT1R
- angiotensin II type I receptor
- FlAsH
- fluorescein arsenical hairpin binder
- RlucII
- Renilla luciferase II
- ICL
- intracellular loop
- ECL
- extracellular loop
- C-tail
- c-terminal tail
- C-tailP1
- C-tail position 1
- CRISPR
- clustered regularly interspaced short palindromic repeats
- PTX
- pertussis toxin
- VSMC
- vascular smooth muscle cell
- HBSS
- Hanks' balanced salt solution
- EDT
- 1,2-ethanedithiol
- BAL
- 2,3-dimercapto-1-propanol
- sgRNA
- single-guide RNA
- SRF-RE
- serum response factor-response element.
References
- 1. Kenakin T. (2015) The effective application of biased signaling to new drug discovery. Mol. Pharmacol. 88, 1055–1061 [DOI] [PubMed] [Google Scholar]
- 2. Masuho I., Ostrovskaya O., Kramer G. M., Jones C. D., Xie K., and Martemyanov K. A. (2015) Distinct profiles of functional discrimination among G proteins determine the actions of G protein-coupled receptors. Sci. Signal. 8, ra123. [DOI] [PMC free article] [PubMed] [Google Scholar]
- 3. Klein Herenbrink C., Sykes D. A., Donthamsetti P., Canals M., Coudrat T., Shonberg J., Scammells P. J., Capuano B., Sexton P. M., Charlton S. J., Javitch J. A., Christopoulos A., and Lane J. R. (2016) The role of kinetic context in apparent biased agonism at GPCRs. Nat. Commun. 7, 10842. [DOI] [PMC free article] [PubMed] [Google Scholar]
- 4. Ronan T., Macdonald-Obermann J. L., Huelsmann L., Bessman N. J., Naegle K. M., and Pike L. J. (2016) Different epidermal growth factor receptor (EGFR) agonists produce unique signatures for the recruitment of downstream signaling proteins. J. Biol. Chem. 291, 5528–5540 [DOI] [PMC free article] [PubMed] [Google Scholar]
- 5. Corbisier J., Galès C., Huszagh A., Parmentier M., and Springael J.-Y. (2015) Biased signaling at chemokine receptors. J. Biol. Chem. 290, 9542–9554 [DOI] [PMC free article] [PubMed] [Google Scholar]
- 6. Domazet I., Holleran B. J., Richard A., Vandenberghe C., Lavigne P., Escher E., Leduc R., and Guillemette G. (2015) Characterization of angiotensin II molecular determinants involved in AT1 receptor functional selectivity. Mol. Pharmacol. 87, 982–995 [DOI] [PubMed] [Google Scholar]
- 7. Saulière A., Bellot M., Paris H., Denis C., Finana F., Hansen J. T., Altié M. F., Seguelas M. H., Pathak A., Hansen J. L., Sénard J. M., and Galés C. (2012) Deciphering biased-agonism complexity reveals a new active AT1 receptor entity. Nat. Chem. Biol. 8, 622–630 [DOI] [PubMed] [Google Scholar]
- 8. Midde K. K., Aznar N., Laederich M. B., Ma G. S., Kunkel M. T., Newton A. C., and Ghosh P. (2015) Multimodular biosensors reveal a novel platform for activation of G proteins by growth factor receptors. Proc. Natl. Acad. Sci. U.S.A. 112, E937–E946 [DOI] [PMC free article] [PubMed] [Google Scholar]
- 9. Zimmerman B., Beautrait A., Aguila B., Charles R., Escher E., Claing A., Bouvier M., and Laporte S. A. (2012) Differential β-arrestin-dependent conformational signaling and cellular responses revealed by angiotensin analogs. Sci. Signal. 5, ra33. [DOI] [PubMed] [Google Scholar]
- 10. Hao Y., and Tatonetti N. P. (2016) Predicting G protein-coupled receptor downstream signaling by tissue expression. Bioinformatics 32, 3435–3443 [DOI] [PMC free article] [PubMed] [Google Scholar]
- 11. Tian H., Fürstenberg A., and Huber T. (2017) Labeling and single-molecule methods to monitor G protein-coupled receptor dynamics. Chem. Rev. 117, 186–245 [DOI] [PubMed] [Google Scholar]
- 12. Stumpf A. D., and Hoffmann C. (2016) Optical probes based on G protein-coupled receptors: added work or added value? Br. J. Pharmacol. 173, 255–266 [DOI] [PMC free article] [PubMed] [Google Scholar]
- 13. Lohse M. J., Nuber S., and Hoffmann C. (2012) Fluorescence/bioluminescence resonance energy transfer techniques to study G-protein-coupled receptor activation and signaling. Pharmacol. Rev. 64, 299–336 [DOI] [PubMed] [Google Scholar]
- 14. Spille J. H., Zürn A., Hoffmann C., Lohse M. J., and Harms G. S. (2011) Rotational diffusion of the α2a-adrenergic receptor revealed by FlAsH labeling in living cells. Biophys. J. 100, 1139–1148 [DOI] [PMC free article] [PubMed] [Google Scholar]
- 15. Maier-Peuschel M., Frölich N., Dees C., Hommers L. G., Hoffmann C., Nikolaev V. O., and Lohse M. J. (2010) A fluorescence resonance energy transfer-based M2 muscarinic receptor sensor reveals rapid kinetics of allosteric modulation. J. Biol. Chem. 285, 8793–8800 [DOI] [PMC free article] [PubMed] [Google Scholar]
- 16. Zürn A., Zabel U., Vilardaga J. P., Schindelin H., Lohse M. J., and Hoffmann C. (2009) Fluorescence resonance energy transfer analysis of α2a-adrenergic receptor activation reveals distinct agonist-specific conformational changes. Mol. Pharmacol. 75, 534–541 [DOI] [PubMed] [Google Scholar]
- 17. Sleno R., Pétrin D., Devost D., Goupil E., Zhang A., and Hébert T. E. (2016) Designing BRET-based conformational biosensors for G protein-coupled receptors. Methods 92, 11–18 [DOI] [PubMed] [Google Scholar]
- 18. Rebois R. V., Maki K., Meeks J. A., Fishman P. H., Hébert T. E., and Northup J. K. (2012) D2-like dopamine and β-adrenergic receptors form a signaling complex that integrates Gs- and Gi-mediated regulation of adenylyl cyclase. Cell. Signal. 24, 2051–2060 [DOI] [PMC free article] [PubMed] [Google Scholar]
- 19. Lee M. H., Appleton K. M., Strungs E. G., Kwon J. Y., Morinelli T. A., Peterson Y. K., Laporte S. A., and Luttrell L. M. (2016) The conformational signature of β-arrestin2 predicts its trafficking and signalling functions. Nature 531, 665–668 [DOI] [PMC free article] [PubMed] [Google Scholar]
- 20. Nuber S., Zabel U., Lorenz K., Nuber A., Milligan G., Tobin A. B., Lohse M. J., and Hoffmann C. (2016) β-Arrestin biosensors reveal a rapid, receptor-dependent activation/deactivation cycle. Nature 531, 661–664 [DOI] [PMC free article] [PubMed] [Google Scholar]
- 21. Robertson D. N., Sleno R., Nagi K., Pétrin D., Hébert T. E., and Pineyro G. (2016) Design and construction of conformational biosensors to monitor ion channel activation: a prototype FlAsH/BRET-approach to Kir3 channels. Methods 92, 19–35 [DOI] [PubMed] [Google Scholar]
- 22. Balakumar P., and Jagadeesh G. (2014) Structural determinants for binding, activation, and functional selectivity of the angiotensin AT1 receptor. J. Mol. Endocrinol. 53, R71–R92 [DOI] [PubMed] [Google Scholar]
- 23. Zhang H., Unal H., Gati C., Han G. W., Liu W., Zatsepin N. A., James D., Wang D., Nelson G., Weierstall U., Sawaya M. R., Xu Q., Messerschmidt M., Williams G. J., Boutet S., et al. (2015) Structure of the angiotensin receptor revealed by serial femtosecond crystallography. Cell 161, 833–844 [DOI] [PMC free article] [PubMed] [Google Scholar]
- 24. Tohgo A., Pierce K. L., Choy E. W., Lefkowitz R. J., and Luttrell L. M. (2002) β-Arrestin scaffolding of the ERK cascade enhances cytosolic ERK activity but inhibits ERK-mediated transcription following angiotensin AT1a receptor stimulation. J. Biol. Chem. 277, 9429–9436 [DOI] [PubMed] [Google Scholar]
- 25. Wei H., Ahn S., Shenoy S. K., Karnik S. S., Hunyady L., Luttrell L. M., and Lefkowitz R. J. (2003) Independent β-arrestin 2 and G protein-mediated pathways for angiotensin II activation of extracellular signal-regulated kinases 1 and 2. Proc. Natl. Acad. Sci. U.S.A. 100, 10782–10787 [DOI] [PMC free article] [PubMed] [Google Scholar]
- 26. Hunyady L., and Catt K. J. (2006) Pleiotropic AT1 receptor signaling pathways mediating physiological and pathogenic actions of angiotensin II. Mol. Endocrinol. 20, 953–970 [DOI] [PubMed] [Google Scholar]
- 27. Alvarez-Curto E., Inoue A., Jenkins L., Raihan S. Z., Prihandoko R., Tobin A. B., and Milligan G. (2016) Targeted elimination of G proteins and arrestins defines their specific contributions to both intensity and duration of G protein-coupled receptor signalling. J. Biol. Chem. 291, 27147–27159 [DOI] [PMC free article] [PubMed] [Google Scholar]
- 28. Yu B., Gu L., and Simon M. I. (2000) Inhibition of subsets of G protein-coupled receptors by empty mutants of G protein α subunits in Go, G11, and G16. J. Biol. Chem. 275, 71–76 [DOI] [PubMed] [Google Scholar]
- 29. Svensson L., Stanley P., Willenbrock F., and Hogg N. (2012) The Gαq/11 proteins contribute to T lymphocyte migration by promoting turnover of integrin LFA-1 through recycling. PLoS One 7, e38517. [DOI] [PMC free article] [PubMed] [Google Scholar]
- 30. Liu J. J., Horst R., Katritch V., Stevens R. C., and Wüthrich K. (2012) Biased signaling pathways in β2-adrenergic receptor characterized by 19F-NMR. Science 335, 1106–1110 [DOI] [PMC free article] [PubMed] [Google Scholar]
- 31. Ye L., Van Eps N., Zimmer M., Ernst O. P., and Prosser R. S. (2016) Activation of the A2A adenosine G-protein-coupled receptor by conformational selection. Nature 533, 265–268 [DOI] [PubMed] [Google Scholar]
- 32. Casiraghi M., Damian M., Lescop E., Point E., Moncoq K., Morellet N., Levy D., Marie J., Guittet E., Banères J. L., and Catoire L. J. (2016) Functional modulation of a GPCR conformational landscape in a lipid bilayer. J. Am. Chem. Soc. 138, 11170–11175 [DOI] [PubMed] [Google Scholar]
- 33. Lamichhane R., Liu J. J., Pljevaljcic G., White K. L., van der Schans E., Katritch V., Stevens R. C., Wüthrich K., and Millar D. P. (2015) Single-molecule view of basal activity and activation mechanisms of the G protein-coupled receptor β2AR. Proc. Natl. Acad. Sci. U.S.A. 112, 14254–14259 [DOI] [PMC free article] [PubMed] [Google Scholar]
- 34. Kenakin T., and Christopoulos A. (2013) Signalling bias in new drug discovery: detection, quantification and therapeutic impact. Nat. Rev. Drug Discov. 12, 205–216 [DOI] [PubMed] [Google Scholar]
- 35. Tsvetanova N. G., and von Zastrow M. (2014) Spatial encoding of cyclic AMP signaling specificity by GPCR endocytosis. Nat. Chem. Biol. 10, 1061–1065 [DOI] [PMC free article] [PubMed] [Google Scholar]
- 36. Irannejad R., Tomshine J. C., Tomshine J. R., Chevalier M., Mahoney J. P., Steyaert J., Rasmussen S. G., Sunahara R. K., El-Samad H., Huang B., and von Zastrow M. (2013) Conformational biosensors reveal GPCR signalling from endosomes. Nature 495, 534–538 [DOI] [PMC free article] [PubMed] [Google Scholar]
- 37. Gidon A., Al-Bataineh M. M., Jean-Alphonse F. G., Stevenson H. P., Watanabe T., Louet C., Khatri A., Calero G., Pastor-Soler N. M., Gardella T. J., and Vilardaga J. P. (2014) Endosomal GPCR signaling turned off by negative feedback actions of PKA and v-ATPase. Nat. Chem. Biol. 10, 707–709 [DOI] [PMC free article] [PubMed] [Google Scholar]
- 38. Devost D., Audet N., Zhou C., Kobayashi H., Bonin H., Lukashova V., Le Gouill C., Bouvier M., and Hébert T. E. (2016) Cellular and subcellular context determine outputs from signaling biosensors. Methods Cell Biol. 132, 319–337 [DOI] [PubMed] [Google Scholar]
- 39. Vaniotis G., Allen B. G., and Hébert T. E. (2011) Nuclear GPCRs in cardiomyocytes: an insider's view of β-adrenergic receptor signaling. Am. J. Physiol. Heart Circ. Physiol. 301, H1754–H1764 [DOI] [PMC free article] [PubMed] [Google Scholar]
- 40. Carpenter B., Nehmé R., Warne T., Leslie A. G., and Tate C. G. (2016) Structure of the adenosine A2A receptor bound to an engineered G protein. Nature 536, 104–107 [DOI] [PMC free article] [PubMed] [Google Scholar]
- 41. Manglik A., Kim T. H., Masureel M., Altenbach C., Yang Z., Hilger D., Lerch M. T., Kobilka T. S., Thian F. S., Hubbell W. L., Prosser R. S., and Kobilka B. K. (2015) Structural insights into the dynamic process of β2-adrenergic receptor signaling. Cell 161, 1101–1111 [DOI] [PMC free article] [PubMed] [Google Scholar]
- 42. DeVree B. T., Mahoney J. P., Vélez-Ruiz G. A., Rasmussen S. G., Kuszak A. J., Edwald E., Fung J. J., Manglik A., Masureel M., Du Y., Matt R. A., Pardon E., Steyaert J., Kobilka B. K., and Sunahara R. K. (2016) Allosteric coupling from G protein to the agonist-binding pocket in GPCRs. Nature 535, 182–186 [DOI] [PMC free article] [PubMed] [Google Scholar]
- 43. Damian M., Mary S., Maingot M., M'Kadmi C., Gagne D., Leyris J. P., Denoyelle S., Gaibelet G., Gavara L., Garcia de Souza Costa M., Perahia D., Trinquet E., Mouillac B., Galandrin S., Galès C., et al. (2015) Ghrelin receptor conformational dynamics regulate the transition from a preassembled to an active receptor:Gq complex. Proc. Natl. Acad. Sci. U.S.A. 112, 1601–1606 [DOI] [PMC free article] [PubMed] [Google Scholar]
- 44. Kahsai A. W., Wisler J. W., Lee J., Ahn S., Cahill Iii T. J., Dennison S. M., Staus D. P., Thomsen A. R., Anasti K. M., Pani B., Wingler L. M., Desai H., Bompiani K. M., Strachan R. T., Qin X., et al. (2016) Conformationally selective RNA aptamers allosterically modulate the β2-adrenoceptor. Nat. Chem. Biol. 12, 709–716 [DOI] [PMC free article] [PubMed] [Google Scholar]
- 45. Staus D. P., Strachan R. T., Manglik A., Pani B., Kahsai A. W., Kim T. H., Wingler L. M., Ahn S., Chatterjee A., Masoudi A., Kruse A. C., Pardon E., Steyaert J., Weis W. I., Prosser R. S., et al. (2016) Allosteric nanobodies reveal the dynamic range and diverse mechanisms of G-protein-coupled receptor activation. Nature 535, 448–452 [DOI] [PMC free article] [PubMed] [Google Scholar]
- 46. Schrage R., Schmitz A. L., Gaffal E., Annala S., Kehraus S., Wenzel D., Büllesbach K. M., Bald T., Inoue A., Shinjo Y., Galandrin S., Shridhar N., Hesse M., Grundmann M., Merten N., et al. (2015) The experimental power of FR900359 to study Gq-regulated biological processes. Nature communications 6, 10156. [DOI] [PMC free article] [PubMed] [Google Scholar]
- 47. Goupil E., Fillion D., Clément S., Luo X., Devost D., Sleno R., Pétrin D., Saragovi H. U., Thorin É., Laporte S. A., and Hébert T. E. (2015) Angiotensin II type I and prostaglandin F2α receptors cooperatively modulate signaling in vascular smooth muscle cells. J. Biol. Chem. 290, 3137–3148 [DOI] [PMC free article] [PubMed] [Google Scholar]
- 48. Namkung Y., Radresa O., Armando S., Devost D., Beautrait A., Le Gouill C., and Laporte S. A. (2016) Quantifying biased signaling in GPCRs using BRET-based biosensors. Methods 92, 5–10 [DOI] [PubMed] [Google Scholar]
- 49. Ran F. A., Hsu P. D., Wright J., Agarwala V., Scott D. A., and Zhang F. (2013) Genome engineering using the CRISPR-Cas9 system. Nat. Protoc. 8, 2281–2308 [DOI] [PMC free article] [PubMed] [Google Scholar]
- 50. Inoue A., Ishiguro J., Kitamura H., Arima N., Okutani M., Shuto A., Higashiyama S., Ohwada T., Arai H., Makide K., and Aoki J. (2012) TGFα shedding assay: an accurate and versatile method for detecting GPCR activation. Nat. Methods 9, 1021–1029 [DOI] [PubMed] [Google Scholar]
- 51. Yang J., Yan R., Roy A., Xu D., Poisson J., and Zhang Y. (2015) The I-TASSER suite: protein structure and function prediction. Nat. Methods 12, 7–8 [DOI] [PMC free article] [PubMed] [Google Scholar]
Associated Data
This section collects any data citations, data availability statements, or supplementary materials included in this article.