

In this study, Timashev et al. investigated the mechanism by which shelterin protects telomeres and performed superresolution imaging of telomeres in mouse cells after conditional deletion of TRF1, TRF2, or both, the latter of which results in the complete loss of shelterin. Their results indicate that the DNA damage response induced by shelterin removal does not require substantial telomere decompaction.
Keywords: shelterin, telomere, chromatin, DNA damage response, STORM imaging, t loop
Abstract
Telomeres are protected by shelterin, a six-subunit protein complex that represses the DNA damage response (DDR) at chromosome ends. Extensive data suggest that TRF2 in shelterin remodels telomeres into the t-loop structure, thereby hiding telomere ends from double-stranded break repair and ATM signaling, whereas POT1 represses ATR signaling by excluding RPA. An alternative protection mechanism was suggested recently by which shelterin subunits TRF1, TRF2, and TIN2 mediate telomeric chromatin compaction, which was proposed to minimize access of DDR factors. We performed superresolution imaging of telomeres in mouse cells after conditional deletion of TRF1, TRF2, or both, the latter of which results in the complete loss of shelterin. Upon removal of TRF1 or TRF2, we observed only minor changes in the telomere volume in most of our experiments. Upon codeletion of TRF1 and TRF2, the telomere volume increased by varying amounts, but even those samples exhibiting small changes in telomere volume showed DDR at nearly all telomeres. Upon shelterin removal, telomeres underwent 53BP1-dependent clustering, potentially explaining at least in part the apparent increase in telomere volume. Furthermore, chromatin accessibility, as determined by ATAC-seq (assay for transposase-accessible chromatin [ATAC] with high-throughput sequencing), was not substantially altered by shelterin removal. These results suggest that the DDR induced by shelterin removal does not require substantial telomere decompaction.
The essential function of telomeres is to protect chromosome ends from being recognized as damaged DNA by the cellular DNA damage response (DDR) machinery (de Lange 2009). The mechanism by which telomeres solve this end protection problem is of interest because loss of telomere protection plays an important role in cancer development and can lead to a myriad of human diseases (Armanios 2009; Artandi and DePinho 2010; Maciejowski and de Lange 2017). Human and mouse telomeres are comprised of a double-stranded telomeric TTAGGG repeat array that extends over many kilobases and terminates in a 3′ protrusion of single-stranded TTAGGG repeats. These sequences can be maintained by telomerase, the reverse transcriptase that counteracts terminal sequence loss during DNA replication (Greider and Blackburn 1985). The telomeric DNA protects chromosome ends through its interaction with the six-subunit shelterin complex (de Lange 2005).
Shelterin is bound to telomeres through the interaction of TRF1 and TRF2 with the double-stranded telomeric DNA. TRF1 and TRF2 are linked by the central shelterin subunit TIN2, which stabilizes TRF1 and TRF2 on the DNA and also recruits the POT1/TPP1 heterodimer. POT1 is the ssDNA-binding protein in shelterin that recognizes TTAGGG repeats. Shelterin is compartmentalized with different subunits dedicated to distinct DDR pathways (Palm and de Lange 2008). TRF2 represses ATM kinase signaling and nonhomologous end-joining (NHEJ) at telomeres, whereas POT1 prevents the activation of the ATR kinase. TRF1 does not contribute to the protection of telomere ends per se but is important for the efficient replication of the double-stranded telomeric DNA (Martinez et al. 2009; Sfeir et al. 2009).
Shelterin has been proposed to solve the telomere end protection problem through distinct mechanisms involving primarily TRF2 and POT1. TRF2 has been proposed to protect telomeres by changing the structure of the telomeric DNA into the t-loop configuration, a lariat structure that results from strand invasion of the telomeric 3′ overhang into the double-stranded telomeric DNA (Griffith et al. 1999; Doksani et al. 2013). TRF2 can promote t-loop formation in vitro (Griffith et al. 1999; Stansel et al. 2001), probably due to its ability to wrap DNA (Benarroch-Popivker et al. 2016). T loops have been proposed to represent an architectural solution to the end protection problem by sequestering the telomere end from proteins that load onto double-stranded breaks (DSBs) in DNA. The two main pathways that are repressed by TRF2, ATM kinase signaling and classical NHEJ (c-NHEJ), are initiated by end-loading factors, the Mre11–Rad50–Nbs1 (MRN) complex and Ku70/80, respectively. Thus, by hiding the chromosome end from the MRN complex and Ku70/80, t-loop formation by TRF2 could prevent ATM kinase signaling and c-NHEJ. In contrast to the architectural mechanism by which TRF2 is proposed to act, POT1 (POT1a and POT1b in mouse shelterin) has been proposed to repress ATR signaling by rendering the single-stranded telomeric DNA inaccessible to RPA, the ssDNA sensor in the ATR pathway (Denchi and de Lange 2007; Gong and de Lange 2010; Flynn et al. 2011).
Recently, an alternative model was proposed for the protection of telomeres from all aspects of the DDR, including ATM and ATR kinase signaling (Bandaria et al. 2016). This model, referred to as the compaction model, is based on the observation that the telomere volume of human telomeric chromatin is increased upon knockdown or inhibition of shelterin subunits. Specifically, siRNA-induced knockdown of TRF1 and TIN1 resulted in an eightfold and a sixfold increase in telomere volume, respectively. Similarly, fivefold greater telomeric volume was reported upon expression of a dominant-negative allele of TRF2, while siRNAs to POT1 or TPP1 had a modest (twofold) effect. The expansion of the telomeric chromatin was proposed to facilitate entry of DDR factors into the telomeric domain, thus allowing the DDR machinery to detect and respond to the telomere end, whereas, at functional telomeres, the shelterin-dependent compaction of the chromatin is proposed to block DDR factors from accessing the telomere terminus (Bandaria et al. 2016).
The chromatin state of genomic DNA and its compaction affect many nuclear processes, including transcription and replication (Bickmore and van Steensel 2013). However, the role of chromatin compaction in the DDR is complex. Whereas the rate of DNA repair is slower in heterochromatin than in euchromatin (Murga et al. 2007), DDR signaling is not inhibited by the greater compaction of heterochromatin (Ziv et al. 2006; Goodarzi et al. 2008). In fact, decompaction of chromatin can diminish ATM kinase signaling, and, conversely, the induction of chromatin condensation can lead to activation of the ATM kinase in the absence of DNA damage (Burgess et al. 2014). These data make it difficult to predict a priori whether chromatin compaction could have a protective role at telomeres.
TRF1 and TRF2 exhibit a number of properties in vitro that could potentially allow shelterin to compact the telomeric chromatin. TRF1 can bend telomeric DNA, pair two stretches of telomeric DNA, and form loops by binding to two distant half-sites using the two Myb domains in the TRF1 dimer (Bianchi et al. 1997; Griffith et al. 1998; Bianchi et al. 1999). Furthermore, the N-terminal basic domain of TRF2 interacts with core histones (Konishi et al. 2016) and facilitates the condensation of naked telomeric DNA in vitro (Poulet et al. 2009). In addition, TRF2 can wrap DNA and thus change the topology of telomeric DNA in vitro (Benarroch-Popivker et al. 2016; Kaur et al. 2016). It is not known whether these attributes of TRF1 and TRF2 affect the compaction of the telomeric chromatin in vivo.
Here, we used superresolution stochastic optical reconstruction microscopy (STORM) to determine whether shelterin removal caused decompaction of mouse telomeres by measuring their radius of gyration (Rg) or volume. We used conditional knockouts to remove shelterin subunits TRF1 or TRF2 or the whole shelterin complex by codeletion of both TRF1 and TRF2 from mouse embryonic fibroblast (MEF) cells. Upon deletion of TRF1 or TRF2, we observed relatively small changes in the telomere Rg or volume in the majority of our experiments, although these conditions induced DDR at most telomeres in all of our experiments. Upon deletion of both TRF1 and TRF2, the telomere Rg/volume increased by varying amounts from experiment to experiment, but even samples with relatively small changes in telomere Rg/volume showed activation of the DDR at nearly all telomeres. The apparent increase in telomere Rg/volume could be explained at least in part by the clustering of dysfunctional telomeres, which we documented and showed to occur in a 53BP1-dependent manner. Moreover, the chromatin accessibility, as measured by ATAC-seq (assay for transposase-accessible chromatin [ATAC] with high-throughput sequencing), was not altered substantially by shelterin removal. Taken together, these data suggest that removal of TRF1 and/or TRF2 does not necessarily cause substantial chromatin decompaction. Since all of these conditions reliably cause a DDR at most telomeres, our results suggest that chromatin compaction is not a primary mechanism by which shelterin protects telomeres from the DDR.
Results
The effect of TRF1 deletion on telomere volume
To probe the role of TRF1 in chromatin compaction at telomeres, we used SV40 large T (SV40LT) immortalized MEFs with floxed TRF1 alleles (SV40LT TRF1F/F Cre-ERT2) in which Cre-mediated deletion of TRF1 can be induced with tamoxifen. In this and all experiments described below, the Cre-mediated deletion of shelterin components was verified by immunoblotting (Fig. 1A). Cells lacking TRF1 exhibit telomere dysfunction due to difficulties in replicating the telomeric sequence (Martinez et al. 2009; Sfeir et al. 2009; Zimmermann and de Lange 2014). This defect leads to the activation of the ATR kinase and telomere dysfunction-induced foci (TIFs), which represent the accumulation of DDR factors at telomeres (Takai et al. 2003). As expected, after induction of Cre, the vast majority of telomeres showed TIFs containing 53BP1 (Fig. 1B). To detect changes in telomere compaction, we imaged cells with and without TRF1 using telomeric fluorescence in situ hybridization (FISH) and two-dimensional (2D) STORM imaging with ∼25-nm resolution (Fig. 1C; Rust et al. 2006; Bates et al. 2007; Huang et al. 2010).
Figure 1.

The effect of TRF1 deletion on telomere volume. (A) Representative immunoblot showing deletion of TRF1 at 120 h after induction of Cre with tamoxifen in SV40LT immortalized TRF1F/F Rosa-CreERT2 MEFs. (Ctrl) Nonspecific band used as loading control. (B) Projected z-stack immunofluorescence (IF) images showing the presence of TIFs in the cells shown in A. (Green) Telomeric FISH with TelG-A647; (red) IF for 53BP1; (merge) green and red channels merged with DAPI DNA stain (blue). The percentage of telomeres with a 53BP1-positive TIF is shown below (average and SD from six experiments analyzed at 96 or 120 h). (C) Representative STORM images showing telomeric foci in cells with and without TRF1 (at 96 h after tamoxifen). Enlarged images of selected foci are shown below, and two of the enlarged images are accompanied by a localization presentation at the left that displays individual signal localizations as dots. (D–F, top) Graphs showing the natural log of Rg plotted versus the natural log of the number of telomere signal localizations obtained as in C from the indicated cells with and without Cre and processed in parallel. n ≥ 10 cells for each condition in each independent experiment. (Bottom) Accompanying histograms of the distribution of Rg values with the means ± SDs and median values given. Cells were treated with Cre for 96 or 120 h. D–F represent three independent experiments. (G) Summary of data obtained as in D–F (and Supplemental Fig. S1) and the measured changes in average Rg values and average convex hull volumes from seven independent TRF1 deletion experiments. The mean Rg values are presented in nanometers.
To quantitatively evaluate changes in compaction, the telomeric signal localizations detected by STORM imaging, each corresponding to a detected activation event of the photo-switchable dye molecules labeling the telomere, were clustered using DBSCAN to segment individual telomeric foci (Ester et al. 1996). The Rg values of individual telomeres were then calculated based on the localizations in each telomeric focus. The Rg was plotted against the number of signal localizations per telomeric focus (Fig. 1D–F; Supplemental Fig. S1), and, in such plots, a decrease in compaction was expected to result in a positive vertical translocation of the plotted line (see Supplemental Fig. S2). In addition to the plots of Rg values versus number of localizations, we also displayed the overall Rg distributions under each condition for each independent experiment (Fig. 1D–F; Supplemental Fig. S1).
The average Rg can be influenced by the length of the telomeres (which, in the MEFs used here, ranged from 20 to 50 kb) and is expected to be altered when telomeres fuse and thus double in size. However, in the case of TRF1 deletion, telomere fusions are not frequent, and we do not expect substantial changes in the length of mouse telomeres within the time frame studied here (Sfeir et al. 2009).
We performed seven independent Cre-mediated deletion experiments to analyze the effect of TRF1 loss. In each experiment, we measured the Rg distributions of telomeres in ≥10 cells for the plus and minus Cre conditions, with the plus Cre samples and the corresponding control minus Cre samples always prepared in parallel on the same day. The measured changes in average Rg values upon Cre-induced deletion of TRF1 were −6%, 8%, 8%, 8%, 31%, 5%, and 2% (average +8%) for the seven independent experiments (Fig. 1D–G; Supplemental Fig. S1). Similar results were observed for the median Rg values (Fig. 1D–F; Supplemental Fig. S1). Although the measured Rg values can vary by a small amount among different batches of samples, results from the biological replicates (samples treated under the same condition on the same day) (Fig. 1G) and technical replicates (the same batch of cells plated on multiple coverslips) (data not shown) were nearly identical.
We considered the possibility that experimental noise may affect the measured extent of decompaction. To assess such effects, we simulated STORM images of telomeres in the predecompaction state using experimentally measured Rg values and number of FISH signal localizations in the telomeric foci and the measured background localization density under the minus Cre condition (Supplemental Fig. S2). In the post-decompaction simulations, the same values were applied except that the Rg values were changed based on the specified extent of decompaction. We considered various levels of decompaction; i.e., 20%, 40%, 70%, and 100% increases in Rg values, which correspond to 1.7-fold, 2.7-fold, fivefold, and eightfold increase in volume. Our simulations showed that the measured extent of decompaction in Rg is ∼60% of the originally specified value (Supplemental Fig. S2). Based on these results, the measured changes in Rg values in most of our experiments (six out of seven) are consistent with a real Rg change of <14%, whereas one of the seven experiment is consistent with a real Rg change of ∼50%.
We also quantified the experiments using an alternative measure: the convex hull volume. We note that the convex hull analysis is more sensitive to the edge points of a cluster and hence to the chromatin segments located at the three-dimensional (3D) boundary of the telomere foci, whereas Rg measures the overall compaction state of the entire telomere. For the seven independent experiments described above, the changes in the convex hull volume upon deletion of TRF1 were −36%, 7%, 30%, 34%, 144%, 16%, and −19% (average +25%) (Fig. 1G). Considering the effect of the experimental background noise as described above, this measured average change is consistent with a real convex hull volume change of ∼50%.
Despite the relatively small changes in the 3D size of telomeres, we observed a strong DDR in all of these experiments: Approximately 80% of the telomeres exhibited TIF signals in all experiments (e.g., Fig. 1B), including the six experiments that exhibited minimal change in telomere Rg or convex hull volume. Hence, DDR at telomeres upon removal of TRF1 does not appear to require substantial chromatin decompaction.
The effect of TRF2 deletion on telomere volume
Next, we investigated the role of TRF2 in chromatin compaction at telomeres. As deletion of TRF2 leads to telomere fusions, which will confound compaction measurements, we performed TRF2 deletion experiments in DNA ligase IV-negative MEFs (SV40LT TRF2F/FLig4−/−), in which telomere fusions are repressed (Celli and de Lange 2005). The deletion of TRF2 was confirmed by immunoblotting, and TIF analysis revealed the expected telomere dysfunction following induction of Cre (Fig. 2A,B). STORM imaging and Rg analysis of telomeres with and without TRF2 was performed as described above (Fig. 2C–F). In the three sets of independent experiments conducted with −Cre and +Cre done in parallel, the average Rg values changed by +10%, +12%, and +37% upon Cre-induced deletion of TRF2, respectively (Fig. 2D–F). The measured convex hull volume changed by +9%, +31% and +142%, respectively. Based on our simulation results (Supplemental Fig. S2), the measured changes in the majority of our experiments (two out of three) are consistent with a real Rg change of ≤20% and a real convex hull volume change of ≤60%, whereas the third experiment showed a much larger increase in Rg and convex hull volume. We note that, in the last experiment, the large increase in Rg and volume was influenced by a small fraction (∼20%) of telomeric foci that exhibited both large localization numbers and large Rg/volume values. This fraction could potentially be caused by close apposition of dysfunctional telomeres, which occurs in cells that have undergone endoreduplication in response to DNA damage signaling (Davoli et al. 2010), a low frequency of telomere fusions mediated by Lig4-independent (alternative) NHEJ, or the 53BP1-dependent clustering of dysfunctional telomeres as described below. However, it is also possible that this small fraction of telomeres underwent decompaction and became more accessible to FISH probes, hence exhibiting larger numbers of FISH signal localizations. In any case, the majority of telomeres lacking TRF2 did not exhibit substantial decompaction in these experiments, and yet we reliably observed DDR signaling at ∼80% of telomeres in TRF2-deleted Lig4−/− MEF cells.
Figure 2.

The effect of TRF2 deletion on telomere volume. (A) Representative immunoblot showing deletion of TRF2 120 h after tamoxifen treatment of SV40LT immortalized TRF2F/F Lig4−/− Rosa-CreERT2 MEFs to induce Cre. (Ctrl) Nonspecific band used as loading control. (B) Projected z-stack IF images showing the induction of TIFs in the Cre-treated cells shown in A. (Green) Telomeric FISH with TelG-A647; (red) IF for 53BP1; (merge) green and red channels merged with DAPI DNA stain (blue). The percentage of cells with >15 TIFs is shown as well as the percentage of telomeres containing TIFs. n = 20 nuclei. (C) Representative STORM images showing telomeric foci in cells with and without TRF2 as in A. Enlarged images of selected foci are shown below. (D–F, top) Graphs showing the natural log of Rg plotted versus the natural log of the number of telomere signal localizations in the indicated cells with and without Cre obtained as in C and processed in parallel. n ≥ 10 cells for each condition in each independent experiment. (Bottom) Accompanying histograms of the distribution of Rg values with the means ± SDs and median values given. Cells were treated with Cre for 120 h. D–F represent three independent experiments.
We also examined the effect of TRF2 deletion in NHEJ-proficient (DNA ligase IV-positive) MEFs (Supplemental Fig. S3A–C), expecting a change in telomere size due to telomere fusions. At the time point analyzed, ∼50% of the telomeres were fused. Indeed, in both sets of independent experiments (Supplemental Fig. S3D,E), we observed telomeric foci with greater numbers of FISH signal localizations and larger Rg values (Rg increased by 33% and 46%), consistent with the expectation that fused telomeres give rise to larger telomeric foci.
The effect of shelterin removal on telomere volume
Next, we examined the effect of dual deletion of TRF1 and TRF2, which results in removal of all shelterin subunits from telomeres (“shelterin-free” telomeres) (Sfeir and de Lange 2012). TRF1 and TRF2 were deleted from Lig4-deficient TRF1F/FTRF2F/FLig4−/−p53−/− MEFs, in which telomere fusions are rare (Sfeir and de Lange 2012). The Cre-mediated deletion of TRF1 and TRF2 was confirmed by immunoblotting, and the resulting telomere dysfunction was evident from TIF analysis (Fig. 3A,B; Supplemental Fig. S4A,B). We performed five independent experiments, each with −Cre and +Cre samples done in parallel. STORM imaging (Fig. 3C) showed varying amounts of Rg change upon Cre-induced deletion of TRF1 and TRF2: The average Rg values increased by 14%, 67%, 6%, 22%, and 36% in these five experiments (average 29%) (Fig. 3D–G; Supplemental Fig. S5), which is consistent with an average of ∼50% real Rg change when background is considered (Supplemental Fig. S2). The measured convex hull volumes changed by 63%, 436%, 11%, 90%, and 187% (average 157%). The substantial changes in the complex hull volume observed in some of these experiments are consistent with the previous observation that TRF1/TRF2 double knockdown induces a substantial increase in telomere volume in human cells (Bandaria et al. 2016). However, it is worth noting that, regardless of whether a small or large change was measured in telomere Rg/volume, maximal DDR is reliably detected upon codeletion of TRF1 and TRF2, with TIF signal being present at nearly all telomeres (Fig. 3B; Supplemental Fig. S4B); for example, the experiment with only 14% increase in average Rg showed TIFs at 96% of the telomeres, and the experiment with a greater change in average Rg (36%) showed TIFs at 87% of the telomeres (Supplemental Fig. S4B).
Figure 3.

The effect of shelterin removal on telomere volume. (A) Representative immunoblot showing deletion of both TRF1 and TRF2 120 h after treatment of TRF1F/F TRF2F/F Lig4−/− p53−/− Rosa-Cre-ERT2 MEFs with tamoxifen to induce removal of shelterin. (Ctrl) Nonspecific band used as loading control; (*) nonspecific band. (B) Projected z-stack IF images showing the induction of TIFs in the Cre-treated cells shown in A. (Green) Telomeric FISH with TelG-A647; (red) IF for 53BP1; (merge) green and red channels merged with DAPI DNA stain (blue). The percentage of cells with >15 TIFs is shown as well as the percentage of telomeres containing TIFs. n = 20 nuclei. (C) Representative STORM images showing telomeric foci in cells with and without shelterin at their telomeres. Enlarged images of selected foci are shown below. (D–F) Graphs showing the natural log of Rg plotted versus the natural log of the number of signal localizations per telomeric focus in the indicated cells with and without Cre as in A, imaged as in C, and processed in parallel. n ∼ 10 or more cells for each condition in each independent experiment. Each graph is paired with the accompanying histogram of distribution of Rg values, with the means ± SDs and median values given. Cells were treated with Cre for 96 or 120 h. D–F represent three independent experiments. (G) Summary of data obtained as in D–F (and Supplemental Fig. S5) and the measured changes in average Rg values and average convex hull volumes from five independent TRF1/TRF2 codeletion experiments. The mean Rg values are presented in nanometers.
In most of these experiments, the increase in the average Rg value was substantially influenced by a subset of telomeric foci that exhibited both a greater number of FISH signal localizations and larger Rg/volume values, which could potentially be caused by telomere fusion, apposition of telomeres in cells undergoing endoreduplication, and/or clustering of dysfunctional telomeres (see below), although we cannot exclude the possibility that chromatin decompaction may have also contributed to the observed increase in Rg/volume.
53BP1-dependent clustering of dysfunctional telomeres
To investigate the potential cause of the larger telomeric foci in the Cre-treated TRF1F/F TRF2F/F Lig4−/− MEFs described above, we first determined the extent of telomere fusion in these experiments (Supplemental Fig. S4C). Analysis of metaphase spreads showed that ∼5% of the telomeres had undergone fusion at the later (120-h) time point, which could contribute, but only in a small part, to the observed increase in telomere size. We also considered endoreduplication as a potential source of apparently larger telomeres. Endoreduplication takes place in cells with persistent dysfunctional telomeres and leads to close apposition of telomeric signals (Hockemeyer et al. 2006; Davoli et al. 2010). FACS analysis showed that endoreduplication occurred in the experiment, potentially leading to telomere apposition in up to ∼15% of the cells, but the difference between +Cre and −Cre samples was relatively small (Supplemental Fig. S4D); hence, endoreduplication is unlikely to be a major contributing factor to the observed increase in telomere size.
We next considered the clustering of dysfunctional telomeres as a source of the phenomenon observed. DSBs induced by a variety of treatments have been shown to undergo clustering (Aten et al. 2004; Krawczyk et al. 2006; Neumaier et al. 2012; Cho et al. 2014; Mao et al. 2016), but the mechanism underlying these associations has not been determined. We argued that if dysfunctional telomeres become clustered, the number of telomeres detected per nucleus should decrease after treatment of the TRF1F/F TRF2F/F Lig4−/− MEFs with Cre. Indeed, the number of telomeric loci detected by FISH showed a substantial reduction at 96 and 120 h after Cre-mediated removal of shelterin (Fig. 4A). Compared with nuclei in untreated cells, nuclei in cells at 96 and 120 h after Cre treatment contained 37% and 40% fewer telomeric foci, respectively (Fig. 4B), and the average FISH intensity per telomere increased after shelterin removal (Fig. 4C,D), consistent with clustering of dysfunctional telomeres.
Figure 4.
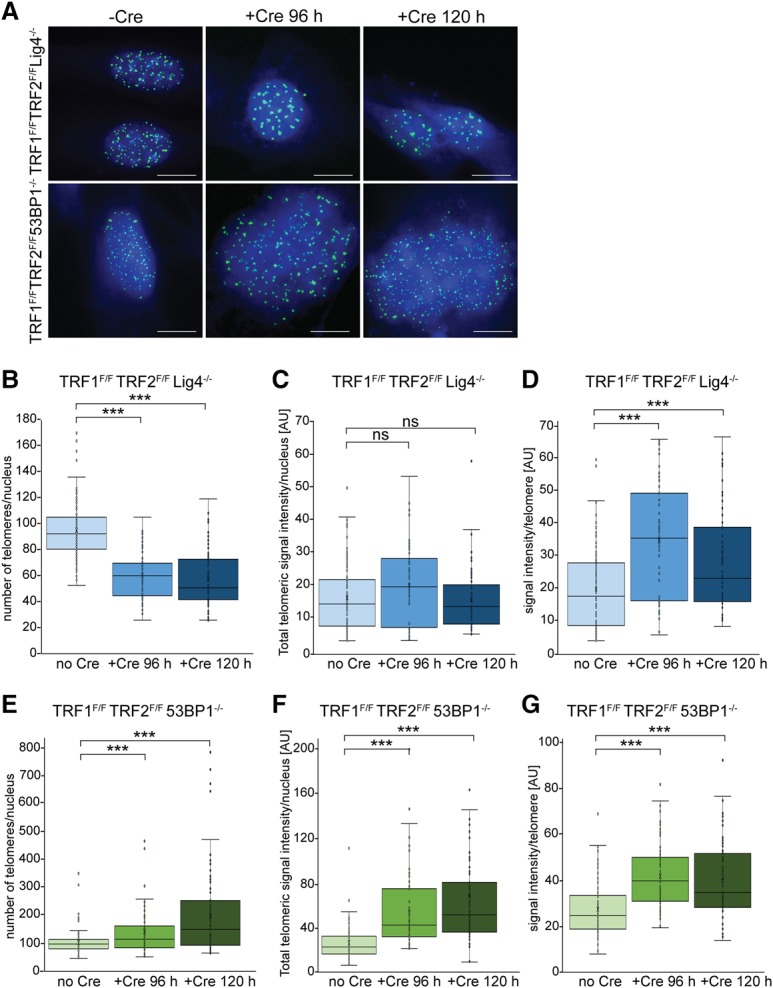
Clustering of dysfunctional telomeres. (A) Examples of telomeric FISH used to count the number of detectable telomeric foci in the indicated TRF1F/F TRF2F/F Lig4−/− p53−/− Rosa-Cre-ERT2 and TRF1F/F TRF2F/F53BP1−/− p53−/− Rosa-Cre-ERT2 MEFs with and without Cre treatment for the indicated times. Telomeric FISH was done as in Figure 1B. Note that the Cre-treated cells lacking 53BP1 show evidence of endoreduplication (larger nuclei and greater number of telomeres). (B) Box and whisker plots of the number of telomeric foci detected per nucleus for the TRF1F/F TRF2F/F Lig4−/− p53−/− Rosa-Cre-ERT2 MEFs before and after treatment with tamoxifen for the indicated times. Data were obtained from three independent experiments, with >50 nuclei scored in each experiment. Imaging was done with 20 0.2-µm z-stacks with settings that were identical for minus and plus Cre samples of the same genotype. Detectable telomeric foci were counted in deconvolved collapsed z-stacks. All minus and plus Cre samples were processed in parallel. (***) P < 0.0001, derived from a two-tailed Mann-Whitney U-test. (C) Box and whisker plots of the total telomere intensity per nucleus in TRF1F/F TRF2F/F Lig4−/− p53−/− Rosa-Cre-ERT2 cells before and after treatment with tamoxifen for the indicated times. Data were obtained on the data set as in B. The total FISH intensity was integrated over the whole nucleus as identified by DAPI. P-values are as in B. (D) Box and whisker plots of the FISH signal intensity per telomeric focus in TRF1F/F TRF2F/F Lig4−/− p53−/− Rosa-Cre-ERT2 cells. Data were obtained on the data set as in B. For each detectable telomeric focus, the total FISH intensity was determined. P-values are as in B. (E–G) Data are as in B–D but for TRF1F/F TRF2F/F53BP1−/− p53−/− Rosa-Cre-ERT2 MEFs.
As 53BP1 has been implicated in holding distant DSBs together within the context of immunoglobulin gene class switch recombination (Difilippantonio et al. 2008), we asked whether 53BP1 is involved in the clustering of dysfunctional telomeres. To this end, we used TRF1F/F TRF2F/F MEFs that lacked 53BP1 (Fig. 4A). As 53BP1 is required for the NHEJ of dysfunctional telomeres (Dimitrova et al. 2008; Sfeir and de Lange 2012), the TRF1F/F TRF2F/F 53BP1−/− MEFs do not develop confounding telomere fusions. The data on these 53BP1-deficient cells showed that after Cre-mediated removal of shelterin, the reduction in the number of telomeric loci did not occur (Fig. 4A, 4E–G). In fact, the number of telomeric loci detected increased, potentially due to endoreduplication, which appears to be frequent (∼30% of cells with 8N DNA content at 96 h) (data not shown) in the Cre-treaded TRF1F/F TRF2F/F 53BP1−/− MEFs (Sfeir and de Lange 2012). The appearance of some telomeric foci with larger sizes in the Cre-treated cells could be due to close apposition of telomeres, which tends to occur in cells undergoing endoreduplication. Overall, these results showed that dysfunctional telomeres lacking shelterin undergo considerable 53BP1-mediated clustering. This clustering can at least in part explain the occurrence of telomeric loci with a larger Rg/volume and a higher number of telomeric signal localizations after shelterin removal.
Removal of shelterin did not change telomeric chromatin accessibility significantly
The compaction state of chromatin has been studied with DNaseI and MNase, revealing a greater rate of digestion by these enzymes of DNA in “open” chromatin. Telomeric DNA in mammals is packaged in nucleosomes that appear to be present throughout the telomeric repeat array (Makarov et al. 1993; Tommerup et al. 1994). The MNase sensitivity of telomeric DNA was found to be unaltered upon removal of shelterin or shelterin subunits (Wu and de Lange 2008; Sfeir et al. 2010; Sfeir and de Lange 2012), potentially indicating that the chromatin compaction of telomeres is not altered. However, it could be argued that the small size of MNase (17 kDa) might allow the enzyme access to the telomeric DNA regardless of its compacted state. We therefore turned to ATAC-seq, which reveals the accessibility of chromatin to the much larger 100-kDa dimeric Tn5 transposase (Buenrostro et al. 2013).
We performed ATAC-seq on nuclei from TRF1F/F TRF2F/F Lig4−/− MEFs before and after Cre-mediated deletion of TRF1 and TRF2. The data obtained showed the expected preferential insertion of Tn5 into transcription start sites (TSSs) (Supplemental Fig. S6A), providing a control for the efficacy of the experiments. To evaluate the accessibility of telomeric chromatin, we determined the ratio of sequence reads with at least seven tandem TTAGGG (or CCCTAA) repeats to the total number of reads in each sample (Supplemental Fig. S6B). The percentage of telomeric reads in the (−Cre) control samples (0.07% and 0.11%) is consistent with the approximate abundance of telomeric DNA in these MEFs (∼0.05%–0.15% of the genome, depending on the length of the telomeres in the MEF line). In two independent ATAC-seq experiments, the Cre-induced deletion of TRF1 and TRF2 resulted in only a minor change (+14% and −8%) in the percentage of telomeric DNA reads (Supplemental Fig. S6B), whereas the Cre induction conditions used in both experiments reliably caused DDR signaling at most telomeres. Such minor changes in the ATAC-seq results are unlikely to be meaningful, since ATAC-seq of repressed versus active chromatin usually shows large (more than fourfold) differences (Buenrostro et al. 2013). Thus, based on Tn5 integration, the accessibility of the telomeric chromatin does not appear to be substantially altered upon shelterin removal.
Discussion
Here, we probed telomere decompaction in MEFs under three knockout conditions: TRF1 deletion, TRF2 deletion, and deletion of both TRF1 and TRF2, which removes the whole shelterin complex. These experiments were performed under conditions where confounding telomere–telomere fusions are minimized. In all cases, the complete loss of the specified proteins induced by Cre was reliably observed. In the experiments where TRF1 or TRF2 was deleted, the majority of our experiments showed only small changes in telomere volume, and, in the experiments where both TRF1 and TRF2 were deleted, we observed varying degrees of telomere volume increase from experiment to experiment, ranging from minimal to substantial, yet all of these knockout conditions reliably induced a DDR at most telomeres in all experiments.
In the experiments where a substantial increase in average telomere volume was observed, the changes were influenced by a subset of the telomeric foci detected by STORM imaging that showed both greater Rg/volume values and a greater number of FISH signal localizations. We provide evidence that such large telomeric foci are likely formed at least in part through 53BP1-dependent clustering of dysfunctional telomeres, although we cannot exclude the possibility that chromatin decompaction also contributed to the observed telomere volume increase.
Consistent with our results on mouse cells, an accompanying study by Vancevska et al. (2017) shows that the majority of deprotected telomeres (i.e., telomeres exhibiting TIF signals), upon shelterin inhibition in human cells, also did not show substantial decompaction. Taken together, these results suggest that DDR at telomeres caused by removal of shelterin subunits does not require substantial chromatin decompaction; hence, chromatin compaction is unlikely to be a primary mechanism used by shelterin to repress DNA repair or DNA damage signaling at telomeres.
Several additional observations support our notion above. First, in vitro studies with the six-subunit mouse shelterin complex have not revealed shelterin–shelterin or shelterin–DNA interactions that could mediate the proposed compaction (Erdel et al. 2017). Second, the DDR is activated when DSBs are made inside the telomeric repeat array (Tang et al. 2013; Doksani and de Lange 2016). According to the compaction model, the telomere compaction should also protect the DNA ends of the induced DSBs. To explain the activation of the DDR by DSBs inside the telomeric repeat array, the compaction model for protecting telomeres would require modification. For instance, a mechanism could be proposed that places the telomere terminus at an internal position in the compacted domain, thereby providing greater protection (Bandaria et al. 2016). Third, the compaction model does not readily explain how large protein complexes, such as the ∼600-kDa MRN complex, which acts as a shelterin-bound accessory factor at functional telomeres (Zhu et al. 2000), can enter the telomeric chromatin when shelterin is intact. Finally, when shelterin is removed, the telomeric chromatin does not display a greater sensitivity to MNase (Sfeir and de Lange 2012), and chromatin accessibility as measured by ATAC-seq is also not significantly changed (this study). However, our data do not exclude a role for chromatin compaction in slowing the DDR at telomeres. If such protective compaction occurs, it would likely be enforced primarily by factors other than shelterin and its associated proteins.
Materials and methods
Cell culture and gene deletion
TRF1F/F TRF2F/F Lig4−/− p53−/− RosaCre-ERT2 MEFs and SV40LT immortalized TRF1F/F TRF2F/F 53BP1−/−, TRF1F/F, TRF2F/F, and TRF2F/F Lig4−/− RosaCre-ERT2 MEFs (Celli and de Lange 2005; Sfeir et al. 2009; Sfeir and de Lange 2012; Doksani et al. 2013) were cultured in DMEM supplemented with 10% fetal bovine serum, 10 mM HEPES (pH 7.3), 1 mM sodium pyruvate, 100 U/mL penicillin, 1 µg/mL streptomycin, 0.2 mM glutamine, and 0.1 mM nonessential amino acids and used as described previously. All MEF lines contained Rosa-CreERT2, allowing induction of Cre with 0.5 µM tamoxifen for 12 h. Time 0 was set at the time the medium was replaced (12 h after addition of tamoxifen). Cells were harvested at 96 or 120 h after medium replacement. For all experiments, the +Cre and −Cre samples were generated and processed in parallel.
Immunoblotting
Cells (106) were lysed in 2× Laemmli buffer and treated for 5 min at 98°C, and the DNA was sheared using an insulin syringe. One-tenth was loaded on an SDS-PAGE gel and transferred for immunoblotting. Antibodies used were mTRF2 (no. 1254) and mTRF1 (no. 1249). The chemiluminescent signals were detected using ECL Western blotting detection reagents (GE Healthcare) and BioMax MR film or XAR film (Kodak) according to the manufacturer's protocol.
Immunofluorescence (IF) and FISH
IF-FISH was performed as described previously (Takai et al. 2003; Herbig et al. 2004). Briefly, cells were fixed on coverslips with 3% formaldehyde and subsequently permeabilized with 0.1% Triton and blocked with 3% goat serum and 1 mg/mL BSA. Primary antibodies were Abcam ab175933 for 53BP1 and Millipore 05-636 for γ-H2AX. Secondary antibodies were donkey anti-rabbit conjugated to FITC. For FISH, slides were dehydrated sequentially in 70%, 90%, and 100% ethanol and then air-dried. Slides were hybridized with a [TTAGGG]3-Alexa647 (TelG-A647) PNA probe for 10 min at 70°C–80°C before being placed in a humidity chamber overnight. Slides were then washed twice in 70% formamide with 10 mM Tris (pH 7.2) and twice in PBS-T before a second serial dehydration prior to mounting and imaging. Images were acquired on a Zeiss Axioplan II with a 63× objective lens and a Hamamatsu C4742-95 and processed with Volocity or on a GE DeltaVision with a 60× objective and processed with FIJI.
STORM imaging
2D STORM images were acquired on a custom setup based on a Nikon TiU inverted microscope similar to that used in a previous study (Doksani et al. 2013). The Alexa647 labels on the PNA probes were excited with a 647-nm laser (MPB Photonics) with a power of 60 mW at the back port of the microscope. In addition, a 405-nm coherent cube laser with a maximum power of 1 mW at the back port of the microscope was used, and the power of the 405-nm laser was ramped during the experiment to maintain an approximately constant density of activated dye molecules (Folling et al. 2008; Heilemann et al. 2008; Dempsey et al. 2011). To improve reproducibility, the same 405 laser power ramp was used for each pair of experiment and control (+Cre and −Cre, respectively) samples. The fluorescence from the activated Alexa647 dye molecules was imaged onto an Andor 897 EMCCD camera using a 100× 1.45 NA Nikon plan apo lambda objective. Using this objective, the image pixel size was 160 nm, and the field of view was 41 μm × 41 μm. The microscope was controlled with custom software written in Python (https://github.com/ZhuangLab/storm-control). Imaging was performed with an imaging buffer containing 100 mM mercaptoethylamine (MEA) as the thiol group to promote photo-switching. The imaging buffer also contained 100 mM Tris (pH 8) and 50 mM NaCl with an oxygen-scavenging system consisting of 5% (w/v) glucose, 300 μg/mL glucose oxidase, and 40 μg/mL catalase.
Localizations were identified in STORM movies with the 3D-DAOSTORM software package (“STORM analysis,” n.d.) (Babcock et al. 2012) and were rendered as Gaussian peaks with σ = 20 nm in the STORM images presented in the figures. We used image correlation between images taken at different times during STORM image acquisition to correct for sample drift (Bates et al. 2007). To test the drift correction quality by the image correlation approach, we also added fiducial markers (fluorescent beads) to the samples to correct for drift and found that the two drift correction approaches generated identical results (two example comparisons are shown in Supplemental Fig. S7).
Clusters of localizations that represent telomeres were identified using the DBSCAN algorithm (Ester et al. 1996). Eps values from 20 to 80 nm and a fixed Minpts of 10 were used for DBSCAN analysis. In addition, only clusters with the localization number above a threshold value was used for further analysis. The eps value and the localization number threshold value were adjusted based on the telomere label density and the density of background localizations to produce optimal cluster identification as judged by visual inspection, but the same settings for these two values were used for the paired experiment and control (+Cre and −Cre, respectively) samples. We obtained an accompanying conventional image for each STORM image, and the majority of the clusters identified in the STORM images using the above approach has a corresponding spot in the conventional image, and the majority of spots identified in the conventional image has a corresponding identified STORM cluster. For each localization cluster identified this way in the STORM image, we computed the Rg and convex hull volume values to quantify the size of the telomere in 3D. For convex hull volume calculation, we first determined the convex hull area of each telomere imaged in 2D and then determined the convex hull volume by raising the convex hull area to the 3/2 power.
As an alternative approach, we additionally screened the clusters of localizations identified in the STORM image using the accompanying conventional image by selecting only STORM clusters that had a corresponding spot in the conventional image identified by a spot-finding program. The results did not change substantially after such screening: The changes in the average Rg values upon TRF1 deletion measured for the seven independent experiments became −7%, 9%, 12%, 11%, 30%, 4%, and 1% after screening; the changes in the average Rg values upon TRF2 deletion (in Lig4-negative cells) measured for the three independent experiments became 14%, 18%, and 45% after screening; the changes in the average Rg values upon TRF1/TRF2 codeletion measured for the five independent experiments became 16%, 78%, 7%, 28%, and 47% after screening. We note that, although this alternative screening approach could help remove nontelomere clusters from the STORM images, it could also remove some real telomere foci that did not appear as sufficiently bright spots in the conventional image and hence may not necessarily provide a more accurate measurement compared with the approach of using STORM images alone to identify telomere clusters.
Simulations of telomeres with predefined volume expansion
Simulations were performed with the OpenMM library (Eastman et al. 2013). The DNA was modeled using freely jointed chains with a harmonic potential to maintain the segment length and a short-range repulsive force to prevent chain intersection. After initial energy minimization, each simulation was run for 20,000 steps to generate a random chain conformation. The simulations were repeated 1000 times for each chain length to generate a library of random chain conformations.
The above generated chain conformations were used to generate a simulated list of localizations similar to the output from the real STORM experiments. This was done by first placing the centroid positions of the chains at uniform random X, Y, and Z locations in a 41-μm × 41-μm × 2-μm box. Next, a list of localizations was created from these chains by using the position of each segment in the chain as the location of a localization. Localizations that had a Z-value that was too large (>500 nm) or too small (less than −500 nm) were discarded to roughly simulate the experimentally probed Z range. To simulate the effect of a change in polymer size arising from decompaction, the chain segment lengths were multiplied by a fixed value. For example, the chain segment lengths were multiplied by 1.2, 1.4, 1.7, and 2.0 to model the effect of a 20%, 40%, 70%, and 100% increase in Rg (representing a 1.7-fold, 2.7-fold, fivefold, and eightfold increase in volume, respectively). The predecompaction Rg was set to match the experimentally measured Rg values under the −Cre condition. An average of 180 chain segments (corresponding to 180 localizations per telomeric cluster) was used for the simulation. To simulate background localizations, 35,000 localizations were added at random uniformly distributed locations in the STORM image. This corresponds to an average density of background localizations of 21 per square micrometer. The average values of 180 localizations per cluster and 21 background localizations per square micrometer are comparable with the experimentally measured values in the vast majority of our experiments. The simulated STORM images were then processed with the same DBSCAN analysis pipeline that was used to analyze the experimental STORM data to determine telomeric signal clusters.
ATAC-seq
ATAC-seq (Buenrostro et al. 2013) was performed by the Memorial Sloan Kettering Cancer Center Epigenetics Center Facility using standard protocols.
Supplementary Material
Acknowledgments
We thank Alistair Boettiger for help with the OpenMM simulation, and members of the de Lange and Zhuang laboratories for helpful discussions and suggestions. We thank Joachim Lingner for communicating unpublished results and coordinating manuscript submission. We thank Ahmet Yildiz for discussion of our results and comments on an earlier version of this manuscript. We thank the Memorial Sloan Kettering Cancer Center Epigenetics Center facility, Richard Koche, John Maciejowski, and Francisca Lottersberger for help with the ATAC-seq experiments, and William Greenleaf for advice. This work is supported by grants from the National Institutes of Health to T.d.L. (AG016642) and X.Z. (GM105637). L.A.T. is an Anderson Center for Cancer Research Graduate Fellow, and research for this publication was conducted with government support under contract FA9550-11-C-0028 and awarded by the Department of Defense, Air Force Office of Scientific Research, National Defense Science and Engineering Graduate (NDSEG) Fellowship (32 CFR 168a). X.Z. is a Howard Hughes Medical Institute Investigator. T.d.L. is an American Cancer Society Rose Zarucki Trust Research Professor.
Footnotes
Supplemental material is available for this article.
Article published online ahead of print. Article and publication date are online at http://www.genesdev.org/cgi/doi/10.1101/gad.294108.116.
References
- Armanios M. 2009. Syndromes of telomere shortening. Annu Rev Genomics Hum Genet 10: 45–61. [DOI] [PMC free article] [PubMed] [Google Scholar]
- Artandi SE, DePinho RA. 2010. Telomeres and telomerase in cancer. Carcinogenesis 31: 9–18. [DOI] [PMC free article] [PubMed] [Google Scholar]
- Aten JA, Stap J, Krawczyk PM, van Oven CH, Hoebe RA, Essers J, Kanaar R. 2004. Dynamics of DNA double-strand breaks revealed by clustering of damaged chromosome domains. Science 303: 92–95. [DOI] [PubMed] [Google Scholar]
- Babcock H, Sigal YM, Zhuang X. 2012. A high-density 3D localization algorithm for stochastic optical reconstruction microscopy. Opt Nanoscopy 10.1186/2192-2853-1-6. [DOI] [PMC free article] [PubMed] [Google Scholar]
- Bandaria JN, Qin P, Berk V, Chu S, Yildiz A. 2016. Shelterin protects chromosome ends by compacting telomeric chromatin. Cell 164: 735–746. [DOI] [PMC free article] [PubMed] [Google Scholar]
- Bates M, Huang B, Dempsey GT, Zhuang X. 2007. Multicolor super-resolution imaging with photo-switchable fluorescent probes. Science 317: 1749–1753. [DOI] [PMC free article] [PubMed] [Google Scholar]
- Benarroch-Popivker D, Pisano S, Mendez-Bermudez A, Lototska L, Kaur P, Bauwens S, Djerbi N, Latrick CM, Fraisier V, Pei B, et al. 2016. TRF2-mediated control of telomere DNA topology as a mechanism for chromosome-end protection. Mol Cell 61: 274–286. [DOI] [PMC free article] [PubMed] [Google Scholar]
- Bianchi A, Smith S, Chong L, Elias P, de Lange T. 1997. TRF1 is a dimer and bends telomeric DNA. EMBO J 16: 1785–1794. [DOI] [PMC free article] [PubMed] [Google Scholar]
- Bianchi A, Stansel RM, Fairall L, Griffith JD, Rhodes D, de Lange T. 1999. TRF1 binds a bipartite telomeric site with extreme spatial flexibility. EMBO J 18: 5735–5744. [DOI] [PMC free article] [PubMed] [Google Scholar]
- Bickmore WA, van Steensel B. 2013. Genome architecture: domain organization of interphase chromosomes. Cell 152: 1270–1284. [DOI] [PubMed] [Google Scholar]
- Buenrostro JD, Giresi PG, Zaba LC, Chang HY, Greenleaf WJ. 2013. Transposition of native chromatin for fast and sensitive epigenomic profiling of open chromatin, DNA-binding proteins and nucleosome position. Nat Methods 10: 1213–1218. [DOI] [PMC free article] [PubMed] [Google Scholar]
- Burgess RC, Burman B, Kruhlak MJ, Misteli T. 2014. Activation of DNA damage response signaling by condensed chromatin. Cell Rep 9: 1703–1717. [DOI] [PMC free article] [PubMed] [Google Scholar]
- Celli GB, de Lange T. 2005. DNA processing is not required for ATM-mediated telomere damage response after TRF2 deletion. Nat Cell Biol 7: 712–718. [DOI] [PubMed] [Google Scholar]
- Cho NW, Dilley RL, Lampson MA, Greenberg RA. 2014. Interchromosomal homology searches drive directional ALT telomere movement and synapsis. Cell 159: 108–121. [DOI] [PMC free article] [PubMed] [Google Scholar]
- Davoli T, Denchi EL, de Lange T. 2010. Persistent telomere damage induces bypass of mitosis and tetraploidy. Cell 141: 81–93. [DOI] [PMC free article] [PubMed] [Google Scholar]
- de Lange T. 2005. Shelterin: the protein complex that shapes and safeguards human telomeres. Genes Dev 19: 2100–2110. [DOI] [PubMed] [Google Scholar]
- de Lange T. 2009. How telomeres solve the end-protection problem. Science 326: 948–952. [DOI] [PMC free article] [PubMed] [Google Scholar]
- Dempsey GT, Vaughan JC, Chen KH, Bates M, Zhuang X. 2011. Evaluation of fluorophores for optimal performance in localization-based super-resolution imaging. Nat Methods 8: 1027–1036. [DOI] [PMC free article] [PubMed] [Google Scholar]
- Denchi EL, de Lange T. 2007. Protection of telomeres through independent control of ATM and ATR by TRF2 and POT1. Nature 448: 1068–1071. [DOI] [PubMed] [Google Scholar]
- Difilippantonio S, Gapud E, Wong N, Huang CY, Mahowald G, Chen HT, Kruhlak MJ, Callen E, Livak F, Nussenzweig MC, et al. 2008. 53BP1 facilitates long-range DNA end-joining during V(D)J recombination. Nature 456: 529–533. [DOI] [PMC free article] [PubMed] [Google Scholar]
- Dimitrova N, Chen YC, Spector DL, de Lange T. 2008. 53BP1 promotes non-homologous end joining of telomeres by increasing chromatin mobility. Nature 456: 524–528. [DOI] [PMC free article] [PubMed] [Google Scholar]
- Doksani Y, de Lange T. 2016. Telomere-internal double-strand breaks are repaired by homologous recombination and PARP1/Lig3-dependent end-joining. Cell Rep 17: 1646–1656. [DOI] [PMC free article] [PubMed] [Google Scholar]
- Doksani Y, Wu JY, de Lange T, Zhuang X. 2013. Super-resolution fluorescence imaging of telomeres reveals TRF2-dependent T-loop formation. Cell 155: 345–356. [DOI] [PMC free article] [PubMed] [Google Scholar]
- Eastman P, Friedrichs MS, Chodera JD, Radmer RJ, Bruns CM, Ku JP, Beauchamp KA, Lane TJ, Wang LP, Shukla D, et al. 2013. OpenMM 4: a reusable, extensible, hardware independent library for high performance molecular simulation. J Chem Theory Comput 9: 461–469. [DOI] [PMC free article] [PubMed] [Google Scholar]
- Erdel F, Kratz K, Willcox S, Griffith JD, Greene EC, de Lange T. 2017. Telomere recognition and assembly mechanism of mammalian shelterin. Cell Rep 18: 41–53. [DOI] [PMC free article] [PubMed] [Google Scholar]
- Ester M, Kriegel HP, Sander J, Xu X. 1996. A density-based algorithm for discovering clusters in large spatial databases with noise. In KDD'96 Proceedings of the Second International Conference on Knowledge Discovery and Data Mining, pp. 226–231. AAAI Press, Portland, OR. [Google Scholar]
- Flynn RL, Centore RC, O'Sullivan RJ, Rai R, Tse A, Songyang Z, Chang S, Karlseder J, Zou L. 2011. TERRA and hnRNPA1 orchestrate an RPA-to-POT1 switch on telomeric single-stranded DNA. Nature 471: 532–536. [DOI] [PMC free article] [PubMed] [Google Scholar]
- Folling J, Bossi M, Bock H, Medda R, Wurm CA, Hein B, Jakobs S, Eggeling C, Hell SW. 2008. Fluorescence nanoscopy by ground-state depletion and single-molecule return. Nat Methods 5: 943–945. [DOI] [PubMed] [Google Scholar]
- Gong Y, de Lange T. 2010. A Shld1-controlled POT1a provides support for repression of ATR signaling at telomeres through RPA exclusion. Mol Cell 40: 377–387. [DOI] [PMC free article] [PubMed] [Google Scholar]
- Goodarzi AA, Noon AT, Deckbar D, Ziv Y, Shiloh Y, Lobrich M, Jeggo PA. 2008. ATM signaling facilitates repair of DNA double-strand breaks associated with heterochromatin. Mol Cell 31: 167–177. [DOI] [PubMed] [Google Scholar]
- Greider CW, Blackburn EH. 1985. Identification of a specific telomere terminal transferase activity in Tetrahymena extracts. Cell 43: 405–413. [DOI] [PubMed] [Google Scholar]
- Griffith J, Bianchi A, de Lange T. 1998. TRF1 promotes parallel pairing of telomeric tracts in vitro. J Mol Biol 278: 79–88. [DOI] [PubMed] [Google Scholar]
- Griffith JD, Comeau L, Rosenfield S, Stansel RM, Bianchi A, Moss H, de Lange T. 1999. Mammalian telomeres end in a large duplex loop. Cell 97: 503–14. [DOI] [PubMed] [Google Scholar]
- Heilemann M, van de Linde S, Schuttpelz M, Kasper R, Seefeldt B, Mukherjee A, Tinnefeld P, Sauer M. 2008. Subdiffraction-resolution fluorescence imaging with conventional fluorescent probes. Angew Chem Int Ed Engl 47: 6172–6176. [DOI] [PubMed] [Google Scholar]
- Herbig U, Jobling WA, Chen BP, Chen DJ, Sedivy JM. 2004. Telomere shortening triggers senescence of human cells through a pathway involving ATM, p53, and p21(CIP1), but not p16(INK4a). Mol Cell 14: 501–513. [DOI] [PubMed] [Google Scholar]
- Hockemeyer D, Daniels JP, Takai H, de Lange T. 2006. Recent expansion of the telomeric complex in rodents: two distinct POT1 proteins protect mouse telomeres. Cell 126: 63–77. [DOI] [PubMed] [Google Scholar]
- Huang B, Babcock H, Zhuang X. 2010. Breaking the diffraction barrier: super-resolution imaging of cells. Cell 143: 1047–1058. [DOI] [PMC free article] [PubMed] [Google Scholar]
- Kaur P, Wu D, Lin J, Countryman P, Bradford KC, Erie DA, Riehn R, Opresko PL, Wang H. 2016. Enhanced electrostatic force microscopy reveals higher-order DNA looping mediated by the telomeric protein TRF2. Sci Rep 6: 20513. [DOI] [PMC free article] [PubMed] [Google Scholar]
- Konishi A, Izumi T, Shimizu S. 2016. TRF2 Protein interacts with core histones to stabilize chromosome ends. J Biol Chem 291: 20798–20810. [DOI] [PMC free article] [PubMed] [Google Scholar]
- Krawczyk PM, Stap J, van Oven C, Hoebe R, Aten JA. 2006. Clustering of double strand break-containing chromosome domains is not inhibited by inactivation of major repair proteins. Radiat Prot Dosimetry 122: 150–153. [DOI] [PubMed] [Google Scholar]
- Maciejowski J, de Lange T. 2017. Telomeres in cancer: tumour suppression and genome instability. Nat Rev Mol Cell Biol 18: 175–186. [DOI] [PMC free article] [PubMed] [Google Scholar]
- Makarov VL, Lejnine S, Bedoyan J, Langmore JP. 1993. Nucleosomal organization of telomere-specific chromatin in rat. Cell 73: 775–787. [DOI] [PubMed] [Google Scholar]
- Mao P, Liu J, Zhang Z, Zhang H, Liu H, Gao S, Rong YS, Zhao Y. 2016. Homologous recombination-dependent repair of telomeric DSBs in proliferating human cells. Nat Commun 7: 12154. [DOI] [PMC free article] [PubMed] [Google Scholar]
- Martinez P, Thanasoula M, Muñoz P, Liao C, Tejera A, McNees C, Flores JM, Fernández-Capetillo O, Tarsounas M, Blasco MA. 2009. Increased telomere fragility and fusions resulting from TRF1 deficiency lead to degenerative pathologies and increased cancer in mice. Genes Dev 23: 2060–2075. [DOI] [PMC free article] [PubMed] [Google Scholar]
- Murga M, Jaco I, Fan Y, Soria R, Martinez-Pastor B, Cuadrado M, Yang SM, Blasco MA, Skoultchi AI, Fernandez-Capetillo O. 2007. Global chromatin compaction limits the strength of the DNA damage response. J Cell Biol 178: 1101–1108. [DOI] [PMC free article] [PubMed] [Google Scholar]
- Neumaier T, Swenson J, Pham C, Polyzos A, Lo AT, Yang P, Dyball J, Asaithamby A, Chen DJ, Bissell MJ, et al. 2012. Evidence for formation of DNA repair centers and dose-response nonlinearity in human cells. Proc Natl Acad Sci 109: 443–448. [DOI] [PMC free article] [PubMed] [Google Scholar]
- Palm W, de Lange T. 2008. How shelterin protects mammalian telomeres. Annu Rev Genet 42: 301–334. [DOI] [PubMed] [Google Scholar]
- Poulet A, Buisson R, Faivre-Moskalenko C, Koelblen M, Amiard S, Montel F, Cuesta-Lopez S, Bornet O, Guerlesquin F, Godet T, et al. 2009. TRF2 promotes, remodels and protects telomeric Holliday junctions. EMBO J 28: 641–651. [DOI] [PMC free article] [PubMed] [Google Scholar]
- Rust MJ, Bates M, Zhuang X. 2006. Sub-diffraction-limit imaging by stochastic optical reconstruction microscopy (STORM). Nat Methods 3: 793–795. [DOI] [PMC free article] [PubMed] [Google Scholar]
- Sfeir A, de Lange T. 2012. Removal of shelterin reveals the telomere end-protection problem. Science 336: 593–597. [DOI] [PMC free article] [PubMed] [Google Scholar]
- Sfeir A, Kosiyatrakul ST, Hockemeyer D, MacRae SL, Karlseder J, Schildkraut CL, de Lange T. 2009. Mammalian telomeres resemble fragile sites and require TRF1 for efficient replication. Cell 138: 90–103. [DOI] [PMC free article] [PubMed] [Google Scholar]
- Sfeir A, Kabir S, van Overbeek M, Celli GB, de Lange T. 2010. Loss of Rap1 induces telomere recombination in the absence of NHEJ or a DNA damage signal. Science 327: 1657–1661. [DOI] [PMC free article] [PubMed] [Google Scholar]
- Stansel RM, de Lange T, Griffith JD. 2001. T-loop assembly in vitro involves binding of TRF2 near the 3′ telomeric overhang. EMBO J 20: 5532–5540. [DOI] [PMC free article] [PubMed] [Google Scholar]
- Takai H, Smogorzewska A, de Lange T. 2003. DNA damage foci at dysfunctional telomeres. Curr Biol 13: 1549–1556. [DOI] [PubMed] [Google Scholar]
- Tang J, Cho NW, Cui G, Manion EM, Shanbhag NM, Botuyan MV, Mer G, Greenberg RA. 2013. Acetylation limits 53BP1 association with damaged chromatin to promote homologous recombination. Nat Struct Mol Biol 20: 317–325. [DOI] [PMC free article] [PubMed] [Google Scholar]
- Tommerup H, Dousmanis A, de Lange T. 1994. Unusual chromatin in human telomeres. Mol Cell Biol 14: 5777–5785. [DOI] [PMC free article] [PubMed] [Google Scholar]
- Vancevska A, Douglass KM, Pfeiffer V, Manley S, Lingner J. 2017. The telomeric DNA damage response occurs in the absence of chromatin decompaction. Genes Dev (this issue) 10.1101/gad.294082.116. [DOI] [PMC free article] [PubMed] [Google Scholar]
- Wu P, de Lange T. 2008. No overt nucleosome eviction at deprotected telomeres. Mol Cell Biol 28: 5724–5735. [DOI] [PMC free article] [PubMed] [Google Scholar]
- Zhu XD, Kuster B, Mann M, Petrini JH, de Lange T. 2000. Cell-cycle-regulated association of RAD50/MRE11/NBS1 with TRF2 and human telomeres. Nat Genet 25: 347–352. [DOI] [PubMed] [Google Scholar]
- Zimmermann M, de Lange T. 2014. 53BP1: pro choice in DNA repair. Trends Cell Biol 24: 108–117. [DOI] [PMC free article] [PubMed] [Google Scholar]
- Ziv Y, Bielopolski D, Galanty Y, Lukas C, Taya Y, Schultz DC, Lukas J, Bekker-Jensen S, Bartek J, Shiloh Y. 2006. Chromatin relaxation in response to DNA double-strand breaks is modulated by a novel ATM- and KAP-1 dependent pathway. Nat Cell Biol 8: 870–876. [DOI] [PubMed] [Google Scholar]
Associated Data
This section collects any data citations, data availability statements, or supplementary materials included in this article.