

In this Resource/Methodology, Wu et al. establish new methods for the genomic mapping of active DNA demethylation using limited numbers of cells or single cells. They describe low-input and single-cell methylase-assisted bisulfite sequencing (liMAB-seq and scMAB-seq), capable of profiling 5fC and 5caC at genome scale using ∼100 cells and single cells, respectively.
Keywords: methylase-assisted bisulfite sequencing, 5-formylcytosine, 5-carboxylcytosine, low input, single cell, sister chromatid exchange
Abstract
To understand mammalian active DNA demethylation, various methods have been developed to map the genomic distribution of the demethylation intermediates 5-formylcysotine (5fC) and 5-carboxylcytosine (5caC). However, the majority of these methods requires a large number of cells to begin with. In this study, we describe low-input methylase-assisted bisulfite sequencing (liMAB-seq ) and single-cell MAB-seq (scMAB-seq), capable of profiling 5fC and 5caC at genome scale using ∼100 cells and single cells, respectively. liMAB-seq analysis of preimplantation embryos reveals the oxidation of 5mC to 5fC/5caC and the positive correlation between chromatin accessibility and processivity of ten-eleven translocation (TET) enzymes. scMAB-seq captures the cell-to-cell heterogeneity of 5fC and 5caC and reveals the strand-biased distribution of 5fC and 5caC. scMAB-seq also allows the simultaneous high-resolution mapping of sister chromatid exchange (SCE), facilitating the study of this type of genomic rearrangement. Therefore, our study not only establishes new methods for the genomic mapping of active DNA demethylation using limited numbers of cells or single cells but also demonstrates the utilities of the methods in different biological contexts.
DNA methylation at the 5-position of cytosine (5-methylcytosine [5mC]) in mammalian DNA serves as a key epigenetic mark with regulatory functions in transcription, development, and disease (Jones 2012; Smith and Meissner 2013). 5mC is established and maintained by DNA methyltransferases (DNMTs) (Law and Jacobsen 2010). DNA demethylation can occur passively during DNA replication when DNA methylation maintenance machinery is absent or not functional or actively through the actions of ten-eleven translocation (TET) dioxygenases and other enzymes (Wu and Zhang 2014). TETs catalyze the iterative oxidation of 5mC to 5-hydroxymethylcytosine (5hmC), 5-formylcysotine (5fC), and 5-carboxylcytosine (5caC) (Tahiliani et al. 2009; Ito et al. 2010, 2011; He et al. 2011). Replication-dependent dilution of 5hmC, 5fC, and 5caC or thymine DNA glycosylase (TDG)-mediated excision of 5fC and 5caC followed by base excision repair (BER) can erase these oxidized forms of 5mC from the genome (Wu and Zhang 2014). TET-mediated active DNA demethylation has been observed in various biological contexts, including preimplantation embryos and primordial germ cells (PGCs) (Wu and Zhang 2014).
To understand the mechanism and function of active DNA demethylation, various methods have been developed to map the genomic distribution of 5fC and 5caC (Raiber et al. 2012; Shen et al. 2013; Song et al. 2013; Booth et al. 2014; Wu et al. 2014; Lu et al. 2015; Sun et al. 2015; Xia et al. 2015). However, the majority of these methods requires a large amount of input DNA (typically hundreds of nanograms or more, corresponding to several hundred thousand cells) and thus cannot be readily applied to biological processes with limited cell availability, such as mammalian preimplantation development and PGC development. To understand the role of active DNA demethylation in these biological processes, low-input methods capable of profiling the demethylation intermediates using a small number of cells are needed. In addition to low-input methods, single-cell methods are also required to reveal cell-to-cell heterogeneity of active DNA demethylation, which may contribute to the diversity of cell function.
Here, we describe low-input methylase-assisted bisulfite sequencing (liMAB-seq) and single-cell MAB-seq (scMAB-seq), the first methods capable of profiling 5fC and 5caC together (abbreviated as 5fC/5caC) using a small number of cells and single cells, respectively. Using liMAB-seq starting from ∼100 cells, we profiled 5fC/5caC of mouse preimplantation embryos and demonstrated that loss of 5mC is accompanied by the generation of 5fC/5caC during zygotic paternal genome demethylation and that TET processivity is associated with chromatin accessibility. Using scMAB-seq, we showed that individual cells display a cell type-specific 5fC/5caC distribution pattern. In addition, DNA replication leads to a biased distribution of 5fC/5caC between the old and the newly synthesized strands, creating an additional layer of heterogeneity. The single-cell 5fC/5caC profile also allows the simultaneous high-resolution mapping of the genomic location of sister chromatid exchange (SCE), a type of genomic rearrangement associated with genomic instability.
Results
Development of liMAB-seq and scMAB-seq
DNA purification-associated loss of material during sequencing library construction presents a major challenge in performing genomic and epigenomic studies using a small number of cells or single cells. Most of the current methods used for profiling oxidized forms of 5mC involve chemical treatment or bead-based enrichment and thus require multiple rounds of DNA purification, making them incompatible with studies in which cell availability is limited. We previously developed MAB-seq, an enzyme-based method capable of mapping genomic 5fC/5caC at single-base resolution (Wu et al. 2014). MAB-seq is based on bisulfite sequencing (BS-seq), a commonly used method for mapping DNA methylation. In regular BS-seq, 5mC and 5hmC (abbreviated as 5mC/5hmC) are sequenced as C, while unmodified C and 5fC/5caC are sequenced as T. In MAB-seq, an additional step of M.SssI methyltransferase treatment converts unmodified C in CpG context to 5mC prior to bisulfite conversion, thereby allowing 5fC/5caC to be directly read out as T (Supplemental Fig. S1A). Because M.SssI treatment is carried out in normal enzymatic conditions (Wu et al. 2016), it is possible that M.SssI treatment can be combined with other steps of library preparation without introducing additional rounds of DNA purification. Currently, two different library preparation strategies, reduced representation BS-seq (RRBS) (Meissner et al. 2005) and post-bisulfite adaptor tagging (PBAT) (Miura et al. 2012), have been implemented to perform low-input or single-cell BS-seq (Guo et al. 2013; Smallwood et al. 2014; Farlik et al. 2015). RRBS allows the study of a fixed set of CpG sites with a relatively small sequencing effort, while PBAT interrogates all of the CpG sites in the genome in a relatively unbiased manner. Because RRBS and PBAT each have unique advantages, we decided to develop liMAB-seq and scMAB-seq based on both strategies (Fig. 1A).
Figure 1.
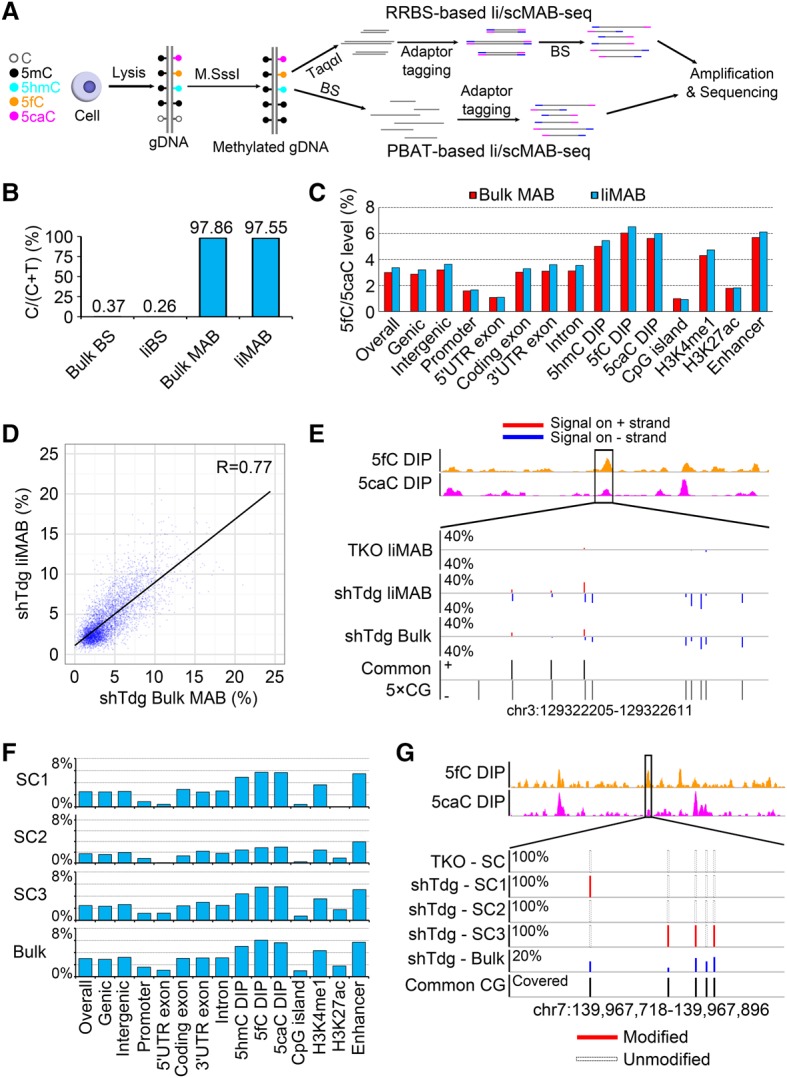
Development of liMAB-seq and scMAB-seq. (A) Schematic illustration of liMAB-seq and scMAB-seq based on RRBS or PBAT strategies. For both strategies, the steps from cell lysis to bisulfite conversion are integrated into a single-tube reaction. (B) Efficient methylation of unmodified C by liMAB-seq. Conversion rate of unmodified C is monitored by λ DNA spike-in [calculated as sum(C)/(sum(C) + sum(T) for all CpG sites covered by at least 20 times (20×CGs)]. liMAB-seq is comparable with regular MAB-seq starting from bulk DNA with two rounds of M.SssI methylation. (C) The 5fC/5caC level of various genomic features quantified by liMAB-seq is comparable with that quantified by regular MAB-seq (bulk). Background signals, defined as the signals detected in Tet triple-knockout liMAB-seq sample (overall ∼2%) (Supplemental Fig. S1E), have been subtracted to reflect the actual level of 5fC/5caC. (D) Correlation between liMAB-seq and regular MAB-seq (bulk). Each dot represents a 2-kb genomic bin with at least 12 20×CGs, and MAB-seq signal within the bin was calculated as sum(T)/[sum(C) + sum(T)]. (E) A representative locus showing 5fC/5caC detected by liMAB-seq. CpG sites covered for at least five times by sequencing and shared between samples (common 5×CGs) are shown. Tet triple-knockout cells served as a negative control. (5fC DIP) 5fC profiles obtained through DNA immunoprecipitation (DIP) (Shen et al. 2013); (5caC DIP) 5caC profiles obtained through DIP (Shen et al. 2013); (TKO) Tet triple-knockout mouse embryonic stem (ES) cells; (shTdg) Tdg-depleted mouse ES cells; (red) 5fC/5caC signals detected on the top (+) strand; (blue) 5fC/5caC signals detected bottom (−) strand. (F) Mean levels of 5fC/5caC in different genomic features. For each sample, background signals detected in Tet triple-knockout control were subtracted from the raw signals to obtain the actual level of 5fC/5caC. SC1 to SC3 are three Tdg-depleted mouse ES cells. The distribution (relative abundance) of 5fC/5caC in different genomic features is comparable between single cells and bulk profile. (G) A representative locus showing 5fC/5caC detected in single cells by scMAB-seq. Five common 5×CGs in the four single cells are shown. 5fC/5caC is not detected in Tet triple-knockout-negative control and displays heterogeneity and a digital pattern in the three Tdg-depleted mouse ES cells.
To examine the feasibility of liMAB-seq, we first tested the combination of MAB-seq with RRBS by integrating cell lysis, M.SssI treatment, and RRBS library preparation into a single-tube reaction, starting with 100 mouse diploid cells (Fig. 1A; Guo et al. 2013). To assess 5fC/5caC detection, we used Tet1–3 triple-knockout mouse embryonic stem (ES) cells as a negative control and Tdg-depleted mouse ES cells treated with vitamin C as a positive control (Shen et al. 2013; Lu et al. 2014; Wu et al. 2014). We started by testing different concentrations of M.SssI. While insufficient M.SssI may lead to incomplete methylation of unmodified C (Wu et al. 2014), a concentration of M.SssI used in regular MAB-seq for bulk DNA unexpectedly reduced library quality, as shown by loss of large DNA fragments in the final library (Supplemental Fig. S1B), low mapping efficiency, and poor CpG coverage. We therefore reduced M.SssI concentration and determined 3.2 U per reaction as an optimized condition that allows efficient methylation of unmodified C without compromising library quality (Fig. 1B; Supplemental Fig. S1B).
Comparative analyses suggest that the data quality of our method starting with 100 cells, termed liMAB-seq, is comparable with that of regular MAB-seq starting with 1 µg of DNA (∼2 × 10⁵ cells) in terms of unmodified C conversion rate (Fig. 1B), mapping efficiency (Supplemental Fig. S1C), CpG coverage (Supplemental Table S1; Supplemental Fig. S1D), 5fC/5caC level of different genomic features (Fig. 1C; Supplemental Fig. S1E), and individual genomic regions (Fig. 1D,E). The results are also comparable between biological replicates (Supplemental Fig. S1F). Notably, the method is widely applicable for analyzing samples with varying amounts of unmodified C, as Dnmt triple-knockout mouse ES cells (with all Cs unmethylated) can be efficiently methylated (Supplemental Fig. S1E).
Although 5fC and 5caC are relatively rare modifications, two factors allow MAB-seq to confidently identify genomic regions modified by 5fC/5caC. First, although the average level of 5fC/5caC across all of the CpG sites is low, the 5fC/5caC level at individual CpG sites being modified is high enough to be distinguished from background signal (Wu et al. 2014). Second, real 5fC/5caC signals tend to cluster together at individual genomic regions, while background signals should distribute across the genome in a largely random manner. Therefore, we undertook a binning approach (100-base-pair [bp] bin) and applied a numeric cutoff (≥10%) to call 5fC/5caC-modified regions in liMAB-seq data sets. Using this strategy, 1.3% and 12% of the regions covered in Tet triple-knockout-negative control and Tdg-depleted ES cells, respectively, were called as modified, representing a false discovery rate (FDR) of 11% (Supplemental Fig. S1G). FDR is even lower for zygotic paternal pronuclei (FDR = 3.6%), which have a higher 5fC/5caC level (see below), and can be further reduced by using a larger bin size or applying a more stringent numeric cutoff. Consistent with previous reports, 5fC/5caC-modified regions called in Tdg-depleted ES cells are enriched at enhancers, H3K4me1 ChIP-seq (chromatin immunoprecipitation [ChIP] combined with high-throughput sequencing) peaks, and 5hmC/5fC/5caC DIP-seq (DNA immunoprecipitation combined with sequencing) peaks (Supplemental Fig. S1G; Shen et al. 2013; Song et al. 2013; Wu et al. 2014; Lu et al. 2015; Sun et al. 2015; Xia et al. 2015). Among the regions covered by RRBS strategy and overlapping with 5fC/5caC DIP-seq peaks, 27.1% were called as modified in Tdg-depleted cells, while only 1.0% were wrongly called as modified in the Tet triple-knockout-negative control, further confirming the effectiveness of our approach in distinguishing real 5fC/5caC signals from background. Therefore, liMAB-seq can confidently identify 5fC/5caC-modified regions.
The success of liMAB-seq prompted us to test the feasibility of scMAB-seq. By further reducing the M.SssI concentration to 0.8 U per reaction, we succeeded in performing scMAB-seq of single mouse ES cells (Supplemental Fig. S1H,I). The mean mapping efficiency of scMAB-seq libraries is 32.3%, while negative control starting with no cell has a mapping efficiency of 0.2%, demonstrating a minimum degree of contamination (Supplemental Fig. S1C). When sequencing depths are comparable (∼30 million reads per library), the number of CpG sites covered in scMAB-seq is 20%–50% of that of liMAB-seq or regular MAB-seq (Supplemental Table S1), while the distribution of the covered sites in different genomic features are comparable (Supplemental Fig. S1D). The number of CpG sites covered can be further improved by increasing the length of sequencing (Supplemental Table S2) or performing paired-end sequencing (Supplemental Table S3). Although further reducing M.SssI concentration may increase the number of CpG sites covered, methylation efficiency will be compromised (Supplemental Fig. S1I). Therefore, we chose 0.8 U per reaction for scMAB-seq in order to balance CpG coverage and methylation efficiency. scMAB-seq analyses reveal that the relative abundance of 5fC/5caC in different genomic features is largely consistent between single cells and bulk profile (Fig. 1F). At individual CpG sites, the 5fC/5caC level displays a digital pattern of 0%, 50%, or 100%, as expected for single-cell data sets (Fig. 1G; Supplemental Fig. S1J). Comparing a shared set of CpG sites, individual cells display heterogeneity of the 5fC/5caC signal, reflecting the transient nature of the demethylation process (Fig. 1G).
As a proof of principle, we also tested the possible combination of M.SssI treatment with PBAT by modifying a published protocol (Fig. 1A; Smallwood et al. 2014). Our results demonstrate that PBAT-based liMAB-seq and scMAB-seq can also be successfully performed to detect 5fC/5caC in Tdg-depleted mouse ES cells (Supplemental Fig. S2A). With ∼250 million reads, PBAT-based liMAB-seq starting from 100 cells can cover ∼25 million CpG sites, representing ∼60% of all of the CpG sites in the mouse genome (one CpG dyad is counted as two different CpG sites here). With ∼30 million reads, 1.7 million to 6.1 million CpG sites can be covered by PBAT-based scMAB-seq. The mapping efficiency is ∼40% for liMAB-seq and ranges from 9.0% to 35.4% for scMAB-seq, while the mapping efficiency for the negative controls (no cell) is ∼0.2% (Supplemental Fig. S2B; Supplemental Table S4). The distribution of the covered CpG sites and the relative abundance of 5fC/5caC in different genomic features are comparable between PBAT-based scMAB-seq, liMAB-seq, and the published whole-genome regular MAB-seq data sets (Supplemental Fig. S2C,D; Wu et al. 2014).
Notably, the distribution of the covered CpG sites and the level of 5fC/5caC in different genomic features are also largely comparable between PBAT and TaqαI-based RRBS (Fig. 1C,F; Supplemental Fig. S1D, 2C,D). Further analyses below also demonstrate that both strategies lead to the same conclusions. For consistency and comparability, we chose RRBS as our major strategy for both liMAB-seq and scMAB-seq unless otherwise specified.
liMAB-seq reveals insights into paternal genome demethylation in mouse preimplantation embryos
Having established liMAB-seq and scMAB-seq, we applied these methods to study active DNA demethylation in mouse preimplantation embryos. In mammals, the highly methylated zygotic paternal genome undergoes TET3-mediated oxidation shortly after fertilization (Gu et al. 2011; Iqbal et al. 2011; Wossidlo et al. 2011; Inoue et al. 2012). All modified forms of cytosine undergo replication-dependent dilution in subsequent rounds of cell division (Inoue and Zhang 2011; Inoue et al. 2011; Guo et al. 2014; Shen et al. 2014). Although this process has been studied for years, many questions still remain. First, many of the molecular events, including loss of 5mC and gain of 5hmC/5fC/5caC as well as the replication-dependent dilution of 5mC/5hmC/5fC/5caC, have been investigated primarily by immunostaining, leaving open the questions of where in the genome and to what extent 5mC is being converted to its oxidized forms. Second, the property of active DNA demethylation during this process (for example, the processivity of TET) is not clear (Wu et al. 2014). These questions have been difficult to address due to the technical difficulties in collecting sufficient mammalian zygotes.
To demonstrate the utility of liMAB-seq and answer some of these questions, we collected mouse sperm and paternal pronuclei from PN5 stage zygotes and performed RRBS-based MAB-seq and BS-seq to monitor changes in 5fC/5caC and 5mC/5hmC, respectively. To rule out the effect of replication-dependent dilution and focus solely on TET-mediated oxidation, zygotes were treated with the replication inhibitor aphidicolin (Guo et al. 2014; Shen et al. 2014). liMAB-seq reveals that the global 5fC/5caC level increases from 1.35% in sperm to 7.25% in paternal pronuclei and that this increase is particularly evident for certain genomic features such as short interspersed element (SINE) repeats, where the 5fC/5caC level increases from 1.41% to 13.20% (Fig. 2A). The increase of 5fC/5caC correlates well with the decrease of 5mC/5hmC at different genomic features (Fig. 2A; Supplemental Fig. S3A) as well as representative genomic loci (Fig. 2B; Supplemental Fig. S3B). For genomic features with little 5fC/5caC increase (e.g., promoters, 5′ untranslated region [UTR] exons, low-complexity repeats, and CpG islands), the 5mC/5hmC level remains unchanged or slightly increased (Fig. 2A; Supplemental Fig. S3A). When individual genomic regions are classified into demethylated, unchanged, or de novo methylated based on BS-seq, 5fC/5caC increase is most evident at demethylated regions (Supplemental Fig. S3C). For CpG sites with greater 5mC/5hmC loss from sperm to paternal pronuclei, the gain of 5fC/5caC is correspondingly greater (Fig. 2C). Consistently, CpG sites with greater 5fC/5caC gain also exhibit greater 5mC/5hmC loss (Fig. 2D). Interestingly, the absolute amount of 5fC/5caC increase is lower than that of 5mC/5hmC decrease, suggesting that unmodified C is generated during this process (Fig. 2C). To quantify how the 5fC/5caC increase matches with the 5mC/5hmC decrease in absolute amount, we calculated a match index, −[Δ(5fC + 5caC)/(Δ(5mC + 5hmC)], for all of the demethylated regions. This index will be 100% if 5fC/5caC increase completely matches 5mC/5hmC decrease and <100% if a certain amount of unmodified C is generated. While the majority (70.7%) of the demethylated regions has gained 5fC/5caC to some degree (match index ≥20%), many of them have a match index between 20% and 80% (Supplemental Fig. S3D). Therefore, unmodified C generation accompanies 5fC/5caC generation at many demethylated regions. The match index is largely comparable for different genomic features, but some genomic features display a small but significant difference from the baseline (Supplemental Fig. S3E). Given that DNA replication was inhibited in our experiments, these results imply that a replication-independent mechanism may be responsible for restoring unmodified C during paternal demethylation. Therefore, liMAB-seq not only confirmed the previous immunostaining-based conclusion that DNA replication-independent loss of 5mC is coupled with generation of 5fC/5caC but also extended the previous findings by identifying the genomic regions and CpG sites where 5fC/5caC accumulates.
Figure 2.

liMAB-seq reveals insights into paternal genome demethylation in mouse preimplantation embryos. (A) The 5fC/5caC levels of different genomic features of sperm and paternal pronuclei. Background signals detected in the Tet triple-knockout control were subtracted from the MAB-seq signals detected in sperm and paternal pronuclei to reflect the actual 5fC/5caC level. The increase of 5fC/5caC from sperm to paternal pronuclei is evident in most genomic features, especially the SINE repeat. (LC repeat) Low-complexity repeat. (B) A representative locus showing the change of 5mC/5hmC (measured by BS-seq) and 5fC/5caC (measured by MAB-seq) from sperm to paternal pronuclei (PPNs). Common 5×CGs are shown. The increase of 5fC/5caC in PPNs correlates to the decrease of 5mC/5hmC in PPNs in the first four CpG sites. (C) 5fC/5caC changes in CpG sites with different 5mC/5hmC changes. CpG sites were separated into seven groups according to the change of 5mC/5hmC from sperm to PPNs, and, for each group, a box plot was generated to summarize the change of 5fC/5caC (n is the number of CpG sites in the group). CpG sites with greater 5mC/5hmC loss are also sites with greater 5fC/5caC gain. (D) 5mC/5hmC changes in CpG sites with different 5fC/5caC changes. CpG sites were separated into six groups according to the change of 5fC/5caC from sperm to PPNs, and, for each group, a box plot was plotted to summarize the change of 5mC/5hmC (n is the number of CpG sites in the group). CpG sites with greater 5fC/5caC gain are the sites with greater 5mC/5hmC loss. (E) The 5mC oxidation state is different for individual genomic regions in two-cell embryos. One-hundred-base-pair bins with at least three common 5×CGs between TET-assisted bisulfite sequencing (TAB-seq) and MAB-seq were analyzed, and ≥10% was the cutoff to call modified bins. The number in the parentheses refers to the number of 100-bp bins within the indicated group. (F) TET processivity is positively correlated with chromatin accessibility. Mean DNase I sequencing (DNase-seq) signals centering on the center of the indicated groups of 100-bp bins were plotted. The mean DNase-seq signal is higher in regions with 5fC/5caC as compared with regions with 5hmC only.
We showed previously that the processivity of TET enzymes is positively correlated with chromatin accessibility in mouse ES cells (Wu et al. 2014). To determine whether a similar relationship between TET processivity and chromatin accessibility exists in preimplantation embryos, we performed liMAB-seq to map the genomic location of 5fC/5caC in two-cell embryos. We chose to profile two-cell embryos because the genomic distribution of 5hmC has been mapped in two-cell embryos by TET-assisted bisulfite sequencing (TAB-seq), thereby enabling the comparative analysis of 5hmC and 5fC/5caC distribution (Wang et al. 2014). Similar to the observation in mouse ES cells, some genomic regions in two-cell embryos are modified only by 5hmC but not 5fC/5caC, indicating low TET processivity, while some other regions are 5fC/5caC only, indicating high TET processivity (Fig. 2E). Importantly, the genomic regions modified by 5fC/5caC have higher DNase I sequencing (DNase-seq) signals as compared with 5hmC-only regions (Fig. 2F; Lu et al. 2016). These results suggest that TET processivity in two-cell embryos is positively correlated with chromatin accessibility.
scMAB-seq allows analysis of cell-to-cell heterogeneity of 5fC/5caC distribution
We next tested the utility of scMAB-seq by examining cell-to-cell heterogeneity of 5fC/5caC distribution between different cell types and within the same type of cells. To this end, we performed scMAB-seq analysis of 15 Tdg-depleted ES cells (four PBAT-based and 11 RRBS-based) and 26 blastomeres from 18 two-cell embryos (all were RRBS-based, eight of which had both blastomeres sequenced).
To test whether scMAB-seq can capture the cell-to-cell heterogeneity resulting from the difference of cell types, we first pooled single two-cell blastomeres and Tdg-depleted ES cells for unsupervised principle component analysis (PCA) based on their 5fC/5caC profiles. In PCA, the majority of the cells is clustered according to cell identity (Fig. 3A), and PC1 largely distinguishes the two cell types (Fig. 3A,B). We also analyzed the data in a supervised manner by inspecting ES cell-specific and two-cell-specific 5fC/5caC-modified regions identified by liMAB-seq, revealing that all single cells display cell type-specific 5fC/5caC patterns (Fig. 3C; Supplemental Fig. S4A). These results confirm that scMAB-seq is capable of capturing the variable patterns of active DNA demethylation in different types of single cells, validating our scMAB-seq technique. For both analyses, scMAB-seq data sets obtained from RRBS and PBAT strategies were analyzed together and supported the same conclusion (Fig. 3A–C; Supplemental Fig. S4A).
Figure 3.
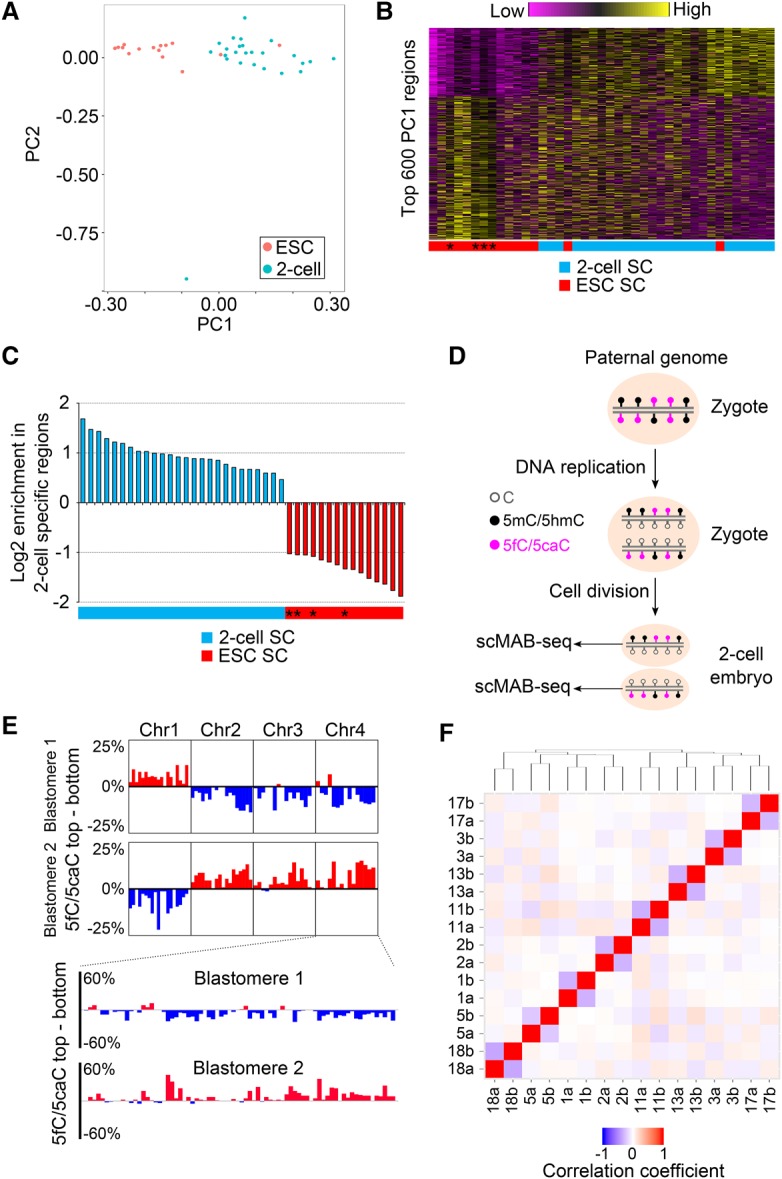
scMAB-seq allows analysis of cell-to-cell heterogeneity of 5fC/5caC distribution. (A) PCA of 15 Tdg-depleted mouse ES cells and 26 single blastomeres from mouse two-cell embryos. The first two PCs are shown, and cells are largely clustered according to their identity. PC1 is the major PC for distinguishing the two cell types. (B) Heat map of 5fC/5caC of the top 600 PC1 regions. The vertical axis plots the 600 regions, while the horizontal axis plots the 41 single cells. Cells are ranked based on PC1 score. Asterisks denote PBAT-based libraries. (C) 5fC/5caC-modified regions (2-kb genomic bin) in single cells are enriched in the corresponding cell type-specific 5fC/5caC-modified regions identified by liMAB-seq. For each single cell, 5fC/5caC-modified regions were called, and the log2 enrichment of these regions in two-cell-specific 5fC/5caC-modified regions relative to ES cell-specific regions was calculated and plotted. Asterisks denote PBAT-based libraries. (D) Schematic representation of replication-dependent dilution of 5fC/5caC in preimplantation embryos. DNA replication and cell division generate a complementary pattern of 5fC/5caC in a pair of blastomeres of a two-cell embryo. (E) Complementary 5fC/5caC pattern observed in a pair of blastomeres from one two-cell embryo. Strand-specific MAB-seq signals were binned into 10-Mb bins (top panel) and 2-Mb bins (bottom panel). For each bin, the difference of 5fC/5caC between the top (+) strand and the bottom (−) strand was calculated to reveal the bias toward one strand. (F) Clustering of two-cell blastomeres based on anti-correlation of the 5fC/5caC pattern. Two blastomeres from the same two-cell embryo are labeled as “number + a/b” (e.g., 17a and 17b). For any two blastomeres, a correlation coefficient (R) was calculated by comparing the strand bias of 1-Mb bins, and pairwise R is shown as a heat map. Hierarchical clustering was then performed using (R + 1)/2 as distance to establish the dendrogram. Two blastomeres from the same two-cell embryo always cluster together.
In addition to cell type-specific patterns, cell-to-cell heterogeneity in 5fC/5caC distribution can also be introduced by DNA replication. In zygotic paternal genome, following the first round of DNA replication, the majority of the CpG sites on the newly synthesized strand is unmodified, creating a biased distribution of 5fC/5caC toward the template strand. After cell division, the two blastomeres of the two-cell embryo should have completely complementary 5fC/5caC strand distribution (Fig. 3D). To determine whether this replication-driven heterogeneity can be captured by scMAB-seq, we analyzed the strand distribution of 5fC/5caC of the two blastomeres from a single two-cell embryo and observed the expected complementary 5fC/5caC patterns (Fig. 3E; Supplemental Fig. S4B). When two-cell blastomeres from different embryos were pooled together for clustering analysis based on anti-correlation of the 5fC/5caC pattern, two blastomeres from the same two-cell embryo always cluster together due to their total complementary patterns (Fig. 3F). These results provide the first sequencing-based evidence at the single-cell level that 5fC/5caC are diluted by DNA replication, creating a complementary 5fC/5caC pattern in the two daughter cells.
scMAB-seq allows mapping of SCE in mouse two-cell embryos
In two-cell embryos, another interesting phenomenon observed by 5fC/5caC immunostaining is SCE (Inoue et al. 2011). SCE is defined as homologous recombination taking place between the two sister chromatids during DNA replication and has been observed in abnormally high frequency in diseases associated with genomic instability such as Bloom syndrome (Wilson and Thompson 2007). Currently, the most commonly used analysis method for SCE is bromodeoxyuridine (BrdU) incorporation followed by staining. However, BrdU treatment itself can induce SCE, and staining provides a low-resolution metric regarding the genomic location of SCE (Wilson and Thompson 2007). Consequently, despite the discovery of SCE decades ago, its cause, genomic location, consequences, and biological significance are not fully understood.
In zygotes, the vast majority of 5fC/5caC is generated on the paternal genome (Inoue et al. 2011). A replication-coupled SCE that happened on the paternal genome will lead to the switching of overall 5fC/5caC distribution from the top (+) strand to the bottom (−) strand or vice versa in the two daughter cells (Fig. 4A; Supplemental Fig. S5A), making the genomic mapping of naturally occurring SCE by scMAB-seq possible. Indeed, by analyzing the strand distribution of 5fC/5caC of single two-cell blastomeres, we observed SCEs at the same location in the two blastomeres from one embryo (Fig. 4B; Supplemental Fig. S4B). When the region surrounding an SCE is sufficiently covered by sequencing and modified by 5fC/5caC, the SCE can be fine-mapped to a small 30-kb region (Fig. 4C). In general, the analysis of both blastomeres from one two-cell embryo or one of the two blastomeres by RRBS-based scMAB-seq can map SCE to a median resolution of 700 and 1250 kb, respectively (Supplemental Fig. S5B,C). These resolutions are much higher than the conventional BrdU immunostaining, which has a resolution of a few megabases or worse.
Figure 4.

scMAB-seq allows mapping of SCE in mouse two-cell embryos. (A) Schematic representation of SCE in preimplantation embryos. DNA replication and cell division create a complementary pattern of 5fC/5caC in the two daughter cells, and SCE leads to the switch of strand bias from one strand to another. (B) SCE in a representative pair of blastomeres from one two-cell embryo. Each bar represents a 2-Mb bin. For each bin, the difference of 5fC/5caC between the top (+) strand and the bottom (−) strand was calculated. The switch of strand bias from one strand to another suggests that an SCE has occurred, and the switch is at the same genomic position in the two daughter cells, as expected. (C) High-resolution mapping of SCE. The rough location of SCE can be identified through binning the 5fC/5caC signals into 1-Mb bins and calculating the strand bias. By using smaller bins (250 kb, 100 kb, and 1 kb) for the calculation and zooming in further, SCE can be fine-mapped to a 30-kb region within the Eif2b3 gene. (D) Chromosome distribution of the detected SCE events. The 75 paternal autosomal SCEs from 18 two-cell embryos were mapped to chromosomes. Each blue bar represents a 1-Mb bin with SCE, and the height represents the number of SCEs observed in this 1-Mb bin (scale: 2). The distribution of SCEs is largely random, but specific genomic regions (marked by the red arrowheads) might have a higher SCE frequency. (E) Histogram of the number of paternal autosomal SCEs in each embryo. The majority of cells has three to four paternal autosomal SCEs, but the highest number observed in the 18 embryos is nine paternal autosomal SCEs within a single embryo. (F) Paternal SCE frequency for each chromosome. Frequency was calculated as the number of paternal SCEs per gigabase per cell. Certain chromosomes such as chromosome 14 might have a higher SCE frequency. (G) Artificial SCE identified in mm9 chromosome 10: 7,000,000–8,000,000. This artificial SCE was caused by an error in mm9 genome assembly, and the error was fixed in mm10 genome assembly. Each bar represents a 1-Mb bin.
We identified a total of 75 paternal autosomal SCEs in the 18 two-cell embryos analyzed (4.17 per embryo) (Fig. 4D). This frequency is comparable with that reported in ES cells (Falconer et al. 2012). The number of paternal autosomal SCEs in individual embryos ranges from one to nine (Fig. 4E). The distribution of the SCEs is largely random (Fig. 4D), but specific chromosomes (Fig. 4F) or genomic regions (arrowheads in Fig. 4D) might have a higher SCE frequency. Interestingly, we also observed two artificial SCEs on chromosomes 10 and 14 (Fig. 4G; Supplemental Fig. S5D). These two artificial SCEs were observed in every embryo examined, a frequency that is abnormally high compared with other SCEs identified (Supplemental Fig. S5E). Further analysis and literature search confirmed that they were caused by two disoriented contigs in the mouse mm9 genome assembly (Falconer et al. 2012). In mouse mm10 genome assembly, the disoriented contig on chromosome 10 was already corrected, while the disoriented contig on chromosome 14 still remained (Fig. 4G; Supplemental Fig. S5D). Therefore, scMAB-seq allows the mapping of SCE at high resolution and can be used for identifying assembly errors of a reference genome.
scMAB-seq allows lineage reconstruction of mouse four-cell embryos
After cell division, SCE occurring during the last cell cycle will pass down to the two daughter cells. When multiple rounds of cell division occur, the daughter cells will carry SCE information from multiple cell cycles, with older SCEs shared by more cells, and the youngest SCEs from the most recent cell cycle shared only by the two daughter cells from the same mother cell (Fig. 5A). In other words, cells with a closer lineage relationship should share more SCEs. To test the possibility of using the SCE pattern to reconstruct cell lineage, we performed scMAB-seq of 12 blastomeres from three four-cell stage mouse embryos (four blastomeres by PBAT-based protocol and eight by RRBS-based protocol).
Figure 5.

scMAB-seq allows lineage reconstruction of mouse four-cell embryos. (A) Four-cell blastomeres carry SCE information from two cell cycles. SCEs occurring during the first cell cycle will be shared by all four blastomeres, while those occurring during the second cell cycle will be shared by only the two blastomeres from the same mother cell. (B) SCE identification in a four-cell blastomere by RRBS-based scMAB-seq. Real SCEs that occurred on chromosomes 2 and 4 were identified as a switch of 5fC/5caC distribution from biased toward one strand to largely unbiased. (Top panel) Ten-megabase bin. (Bottom panel) Two-megabase bin. (C) SCE identification in a four-cell blastomere by PBAT-based scMAB-seq. Real SCEs that occurred on chromosomes 2, 4, 8, and 14 were identified as a switch of 5fC/5caC distribution from biased toward one strand to largely unbiased. The artificial SCE on chromosome 14 was identified as a switch of 5fC/5caC distribution from biased toward the top to biased toward the bottom. (Top panel) Ten-megabase bin. (Bottom panel) Two-megabase bin. (D) Clustering of 12 four-cell blastomeres from three embryos by SCE pattern. The number in the cell name denotes the embryo, while a–d denote the four blastomeres. For any two blastomeres, a correlation coefficient (R) was calculated by comparing the SCE patterns. Hierarchical clustering was then performed using (1 − R)/2 as distance to establish the dendrogram. Four blastomeres from the same four-cell embryo always cluster together and display lineage relationship. (E) Inspection of individual chromosomes further supports the lineage relationship established by clustering. Two embryos, one prepared by RRBS (top) and one prepared by PBAT (bottom), are shown. For embryo 1, 1a–1b and 1c–1d are two pairs of daughter cells. For embryo 2, 2a–2d and 2b–2c are two pairs of daughter cells. For each four-cell embryo, SCEs that occurred during the first cell cycle will be shared by all four blastomeres, while those that occurred during the second cell cycle will be shared by only two blastomeres from the same mother cell.
In four-cell embryos, 5fC/5caC has undergone two rounds of replication-dependent dilution. As a result, paternal SCE is expected to cause a shift of 5fC/5caC from biased toward one strand to largely unbiased (Fig. 5A). Indeed, SCE can be readily mapped based on this principle using either RRBS-based (Fig. 5B) or PBAT-based (Fig. 5C) scMAB-seq. When the 12 blastomeres were pooled for clustering analysis based on SCE pattern, blastomeres from the same four-cell embryo not only cluster together but also form clear lineage relationship (Fig. 5D). Inspection of individual chromosomes further confirmed this lineage relationship and revealed the SCE took place during the first and second cell cycles (Fig. 5E). Therefore, scMAB-seq can be used for cell lineage reconstruction.
scMAB-seq reveals the strand bias of 5fC/5caC in mouse ES cells
The mouse preimplantation embryo is a unique system for studying 5fC/5caC strand bias and mapping SCE because 5fC/5caC are present mainly on the paternal genome and largely absent in the newly synthesized strand after DNA replication (Inoue et al. 2011). However, it has been unclear whether scMAB-seq can capture the strand bias of 5fC/5caC and identify SCE in more complex biological contexts such as mouse ES cells, where both the paternal and maternal copies of the genome are modified and where both methylation and demethylation machineries are functional to maintain DNA methylation homeostasis after DNA replication. To address this question, we analyzed 5fC/5caC strand distribution of single Tdg-depleted ES cells, taking into consideration that both paternal and maternal copies of the genome are modified (Fig. 6A). We found that 10 out of 15 Tdg-depleted ES cells exhibit different degrees of 5fC/5caC strand bias (Fig. 6B). This high proportion of cells with strand bias suggests that, after DNA replication, the re-establishment of 5fC/5caC on the newly synthesized strand is a relatively slow process despite the presence of functional methylation and demethylation machineries.
Figure 6.
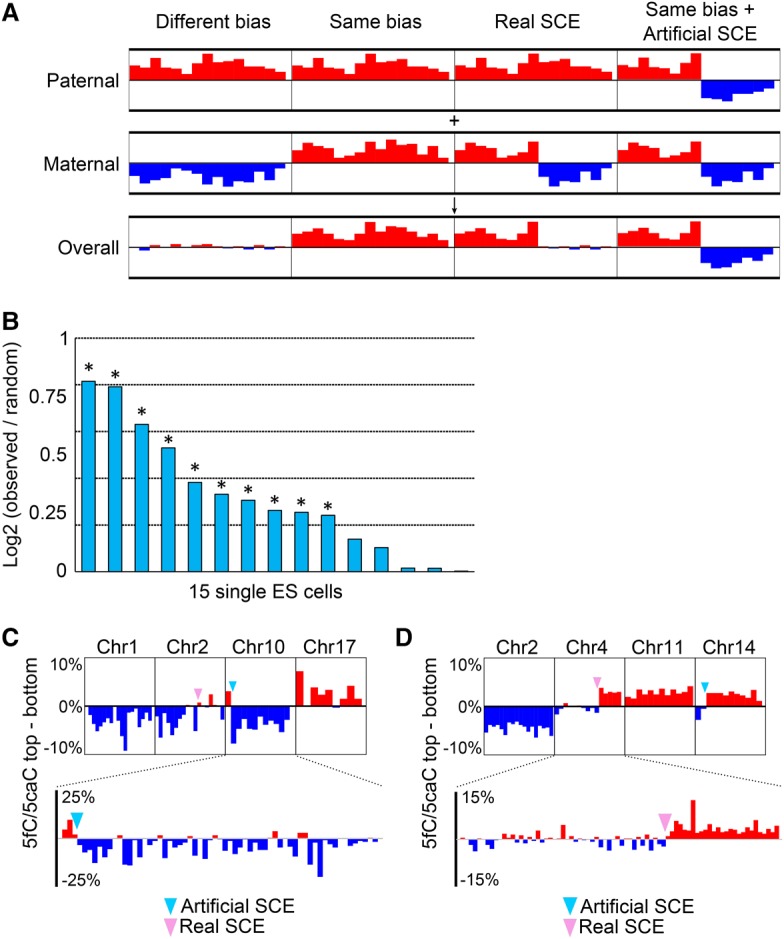
scMAB-seq reveals the strand bias of 5fC/5caC in mouse ES cells. (A) Diagram showing the expected outcomes when both the paternal and maternal genomes are modified and biased. When the paternal bias and maternal bias are in opposite directions, the overall bias detected by sequencing is close to zero (largely unbiased). When the two biases are toward the same direction, the overall bias should be toward that direction. When a real SCE happens, a switch from biased toward one strand to largely unbiased will be observed. In the case of artificial SCEs, if both the paternal and maternal copies are biased toward the same direction, the overall profile should be a transition from top to bottom or vice versa. (B) Individual ES cells display different degrees of strand bias of 5fC/5caC. For each single cell, the degree of strand bias is shown as log2 (observed bias/mean bias from 500 random samplings). A permutation test was performed to determine whether the observed bias deviates significantly from random sampling, and asterisks denote significance. P < 0.05. (C) RRBS-based scMAB-seq captures 5fC/5caC strand bias and SCE in mouse ES cells. Four chromosomes from a single cell are shown as examples. 5fC/5caC on chromosome 1 and chromosome 17 are biased for the bottom and top strands, respectively. Chromosome 2 is an example for a real SCE, as shown by the transition of 5fC/5caC from biased toward the bottom to centered around zero. Chromosome 10 is an example of an artificial SCE where 5fC/5caC transits from biased toward the top to biased toward the bottom. (Top panel) Ten-megabase bin. (Bottom panel) Two-megabase bin. (D) PBAT-based scMAB-seq captures 5fC/5caC strand bias and SCE in mouse ES cells. Four chromosomes from a single cell are shown as examples. 5fC/5caC on chromosome 2 and chromosome 11 are biased for the bottom and top strands, respectively. Chromosome 4 is an example of a real SCE, as shown by the transition of 5fC/5caC from centered around zero to biased toward the top. Chromosome 14 is an example of an artificial SCE where 5fC/5caC transits from biased toward the bottom to biased toward the top. (Top panel) Ten-megabase bin. (Bottom panel) Two-megabase bin.
Similarly, the strand bias of 5fC/5caC allowed us to map SCE and identify disoriented contigs (Fig. 6C,D; Supplemental Fig. S6A). Importantly, the strand bias, SCE, and disoriented genome assembly can be identified by both RRBS-based (Fig. 6C) and PBAT-based (Fig. 6D; Supplemental Fig. S6A) scMAB-seq, confirming that both strategies reach a similar conclusion.
Discussion
To facilitate the study of active DNA demethylation in biological contexts with limited cell numbers, we developed liMAB-seq and scMAB-seq, the first methods capable of profiling 5fC/5caC using ∼100 cells and single cells, respectively. liMAB-seq and scMAB-seq can be performed based on either RRBS or PBAT strategy, providing researchers with the flexibility to choose a suitable protocol based on the biological questions to be addressed and the resources available.
To demonstrate the utility of liMAB-seq, we generated the first genome-scale 5fC/5caC profile of mouse zygotic paternal pronuclei, revealing a high level of 5fC/5caC in genomic features such as SINE repeats. By comparing BS-seq and MAB-seq results, we provided the first sequencing-based evidence that loss of 5mC/5hmC on the paternal genome is accompanied by generation of 5fC/5caC. We also generated the 5fC/5caC profile of two-cell embryos, revealing a positive correlation between TET processivity and chromatin accessibility. In the future, liMAB-seq can facilitate the study of active DNA demethylation in other biological contexts such as developing PGCs and neurons.
To demonstrate the utility of scMAB-seq, we analyzed single mouse ES cells and single blastomeres of mouse two-cell embryos and revealed the heterogeneity of 5fC/5caC distribution between the two cell types and among single cells of the same cell type. We also analyzed the strand distribution of 5fC/5caC in individual blastomeres of mouse two-cell and four-cell embryos and single mouse ES cells, revealing that 5fC/5caC is not maintained during DNA replication. The asymmetric distribution of 5fC/5caC between the template strand and the newly synthesized strand allowed us to map the genomic locations of SCE, a type of genomic rearrangement associated with genomic instability. Compared with conventional methods such as BrdU incorporation followed by staining, scMAB-seq-based SCE mapping yields a much higher genomic resolution in a BrdU-free manner. The pattern of SCE revealed by scMAB-seq can also be used for lineage reconstruction. In the future, a combination of scMAB-seq-based lineage tracing with functional analyses may provide insights into the mechanism and function of lineage specification.
Compared with li/scBS-seq, which profiles the relatively stable DNA methylome, liMAB-seq and scMAB-seq map the dynamic DNA demethylome. Certain cell types or different single cells may have similar DNA methylation patterns but very different DNA demethylation dynamics, and applying liMAB-seq and scMAB-seq to further compare these cell types or single cells may capture additional differences between cell types or among single cells.
Two methods, scAba-seq and nano-5hmC-Seal, which respectively map 5hmC using single cells or ∼1000 cells, have been published recently (Han et al. 2016; Mooijman et al. 2016). Compared with these two methods, which enrich 5hmC-modified regions through restriction enzyme digestion or chemical labeling, liMAB-seq and scMAB-seq are based on BS-seq and do not depend on enrichment, allowing a more quantitative analysis of the modifications and a direct comparison with BS-seq data. Moreover, while 5hmC can be a relatively stable epigenetic mark (Bachman et al. 2014), 5fC and 5caC, being efficiently excised by TDG in most biological contexts, are markers of ongoing DNA demethylation (Shen et al. 2013; Song et al. 2013; Wu et al. 2014). With these unique features and advantages, scMAB-seq and liMAB-seq can complement scAba-seq and nano-5hmC-Seal to reveal different layers of information on DNA methylation dynamics.
Materials and methods
ES cell culture
Tet triple-knockout, Dnmt triple-knockout, and Tdg-depleted mouse ES cells were cultured in DMEM (GIBCO, 11995) with 15% FBS (GIBCO), 2 mM L-glutamine (GIBCO), 0.1 mM 2-mercaptoethanol (Sigma), nonessential amino acids (GIBCO), and 1000 U/mL LIF (Millipore). Tdg-depleted ES cells were treated with vitamin C for 60 h before collection to stimulate 5fC/5caC generation (Wu et al. 2014). For liMAB-seq, 100 cells were obtained through dilution. For scMAB-seq, single cells were collected through mouth pipetting.
Collection of paternal pronuclei from aphidicolin-treated zygotes
All animal studies were performed in accordance with guidelines of the Institutional Animal Care and Use Committee at Harvard Medical School. Adult B6D2F1/J females were superovulated by injecting 7.5 IU of PMSG (Millipore) and hCG (Millipore) followed by mating with B6D2F1/J males. At 18 h after hCG injection, PN0–PN1 stage (G1-phase) zygotes that had not formed visible pronuclei were collected. They were cultured in KSOM containing 3 µg/mL aphidicolin (Sigma-Aldrich) in a humidified atmosphere of 5% CO2/95% air at 37.8°C. Seven hours later, zygotes reached the PN5 stage and were then transferred into M2 medium containing 10 µM cytochalasin B (Sigma-Aldrich). Zona pellucidae were cut by a Piezo impact-driven micromanipulator (Prime Tech Ltd.). The paternal pronuclei were isolated from the zygotes and washed with PBS containing 0.2% BSA followed by collection into 0.2-mL PCR tubes. The samples were stored at −80°C until use. The remaining cytoplasms containing maternal pronuclei were immunostained with anti-H3K9me3 antibody to confirm that the remaining pronuclei were maternal. The paternal pronuclei were distinguished from their maternal counterparts by the distance from the second polar body and by pronuclear size.
RRBS-based liMAB-seq
For liMAB-seq, we collected ∼100 diploid cells in ≤1 µL of 0.01% PBS-BSA through dilution (mouse ES cells) or mouth pipetting (two-cell embryos). In the case of zygotic paternal pronuclei, we started from ∼150 haploid pronuclei. Five microliters of lysis mix containing the following components was then added: 4.4 µL of water, 0.1 µL of 100× TE, 0.1 µL of 1 M KCl, 0.15 µL of 10% Triton X-100, and 0.25 µL of 20 mg/mL Qiagen Protease (Qiagen, 19155). The reaction was incubated for 3 h at 50°C and 30 min at 75°C. Without purifying the reaction, 14 µL of M.SssI mix was added: 10.2 µL of water, 2 µL of New England Biolabs 10× Cutsmart buffer, 1 µL of 1% (w/w) unmethylated λ DNA, 0.4 µL of 4 U/µL M.SssI (M0226S), and 0.4 µL of 32 mM SAM. The reaction mix was incubated for 2 h at 37°C followed by supplementation of another 0.4 µL of 4 U/µL M.SssI and 0.4 µL of 32 mM SAM and incubation for 6 h at 30°C. After the reaction mix was heat-inactivated for 20 min at 65°C, 10 µL of digestion mix (0.5 µL of 20 U/µL TaqαI, 1 µL of New England Biolabs Cutsmart buffer, 8.5 µL of water) was added directly to the reaction mix followed by incubation for 3 h at 65°C and 20 min at 80°C. Without purifying the reaction, 2 µL of end preparation mix consisting of 1 µL of 5 U/µL Klenow fragment exo− (M0212S), 0.2 µL of New England Biolabs Cutsmart buffer, and 0.8 µL of dNTP mix (1 mM dATP, 0.1 mM dCTP, 0.1 mM dGTP) was added. The reaction mix was incubated at 37°C for 40 min followed by heat inactivation for 15 min at 75°C. Without purifying the reaction, 1.35 µL of water, 0.4 µL of New England Biolabs Cutsmart buffer, 0.25 µL of 100 mM ATP, 1.0 µL of 0.75 µM methyalted adaptor, and 1 µL of 2000 U/µL T4 ligase (New England BioLabs, M0202M) were added. The reaction mix was incubated for 3 h at 16°C, overnight at 4°C, and 20 min at 65°C. Without purifying the reaction, bisulfite conversion was set up as follows: ∼36 µL of reaction mix after ligation, 19 µL of DNA protection buffer, and 85 µL of bisulfite conversion mix. The bisulfite conversion and purification were performed following the manufacturer's instructions for small amounts of fragmented DNA except that the thermal cycle was performed twice. Bisulfite-converted DNA was amplified using KAPA HiFi Uracil+ ReadyMix (2×) (Kapa Biosystems, KK2801) and NEBNext index primer for 16–17 cycles followed by purification by SPRI beads (Beckman Coulter, catalog no. B23318; double size selection from 0.55× to 1.4×).
RRBS-based scMAB-seq
For scMAB-seq, all steps were the same as liMAB-seq with three modifications. First, 4 U/µL M.SssI was diluted four times (1 U/µL; 0.8 U for the total reaction) to perform MAB-seq. Next, methylation efficiency was assessed by single Tet-triple-knockout ES cells instead of λ DNA spike-in due to the consideration that λ DNA spike-in at trace amounts (∼5 fg per sample at 1% [w/w]) may not allow accurate estimation of unmodified C conversion rate. Therefore, performing scMAB-seq of single Tet-triple-knockout cells in parallel with the samples of interest was a better strategy for quality control. Finally, 20–21 PCR cycles were used to amplify the library.
Illumina sequencing and data analysis
The majority of the samples was sequenced by Illumina HiSeq 2500 using 100-bp single-end mode, but some samples were sequenced using 100-bp paired-end mode or 250-bp single-end mode for comparison. For analysis other than those shown in Supplemental Table S2 and S3, all reads were trimmed to 100-bp single-end. Adaptor trimming and quality trimming were performed using Trim galore (http://www.bioinformatics.babraham.ac.uk/projects/trim_galore). For RRBS-based samples, the parameter was --three_prime_clip_R1 2 --length 35. For PBAT-based samples, the parameter was --clip_R1 9 --three_prime_clip_R1 9 --length 35. Sequencing alignment was performed using Bismark (Krueger and Andrews 2011). The mouse mm9 genome was used as the reference genome for sperm, zygotic paternal pronuclei, two-cell embryos, and four-cell embryos, while an mm9-based E14 genome was used for ES cells (Incarnato et al. 2014). Specifically for PBAT-based samples, PCR duplicates were excluded using Picard (http://picard.sourceforge.net). For downstream analysis, known single-nucleotide polymorphisms (SNPs) reported by the Sanger Institute were excluded (Keane et al. 2011). Specifically for RRBS-based samples, CpG sites with an abnormally high level of 5fC/5caC in multiple regular or liMAB-seq samples (>20% in both replicates of Tet-triple-knockout mouse ES cells or >20% in both sperm and zygotic paternal pronuclei) were also excluded. For all RRBS-based samples, CpG sites covered for at least five times (5×CG) were used for analysis and description unless otherwise specified. For each condition with biological replicates, the 5×CGs commonly covered in the replicates were merged by summing up the C and T counts, generating one data set for downstream analyses. For PBAT-based samples, 1×CGs were used for analysis and description.
Identification of 5fC/5caC-modified regions by liMAB-seq and estimation of FDR
To call 5fC/5caC-modified regions (Supplemental Fig. S1G), 5×CGs commonly covered in the sample of interest (Tdg-depleted mouse ES cells or zygotic paternal pronuclei) and the negative control (Tet-triple-knockout mouse ES cells) were extracted. The level of 5fC/5caC signal was estimated as T/(C + T) for all 100-bp genomic bins with at least two 5×CGs. To call bins modified by 5fC/5caC, a numeric cutoff of 5fC/5caC signal ≥10% is applied. FDR for the sample of interest was estimated as number of called bins in Tet triple-knockout control/number of called bins in sample of interest, which was 11% for Tdg-depleted mouse ES cells and 3.6% for zygotic paternal pronuclei. FDR could be reduced further when larger bin sizes were used. For example, for Figure 3C and Supplemental Fig. S4A, we analyzed 2-kb bins with five or more 5×CGs and defined modified as 5fC/5caC level ≥7.5%. FDR for Tdg-depleted mouse ES cells under this cutoff was 2.0%.
Identification of 5fC/5caC-modified CpG sites and regions by scMAB-seq
For scMAB-seq data, the possible level of 5fC/5caC for a CpG site was 0%, 50%, or 100% (25% and 75% were less likely but theoretically possible if the cell was undergoing DNA replication). In reality, PCR error or biased amplification may lead to an observed level slightly deviating from these three possibilities. Therefore, a digital transformation of the raw data was performed to convert CpG sites with a 5fC/5caC level of 0%–20% to 0%, 80%–100% to 100%, and any level in between to 50%. After the transformation, CpG sites that had 50% or 100% 5fC/5caC were regarded as modified. The digitally transformed data were also used to calculate the mean level of scMAB-seq signals in different genomic features (Fig. 1F). To reduce the FDR, we also undertook a binning approach for Figure 3C and Supplemental Figure S4A, with the rationale that true 5fC/5caC-modified sites should cluster together, while background signals should distribute randomly in the genome.
Unsupervised PCA of single-cell 5fC/5caC profiles
Raw scMAB-seq data were digitally transformed as described above. 5fC/5caC profiles of individual cells were obtained through a sliding window approach (2-Mb window and 500-kb step). For each window, the level of MAB-seq signal was calculated as the weighted mean of all CGs in the window, with sequencing coverage as the weight and without considering strand information. Background signals detected in single Tet-triple-knockout ES cells were then subtracted from MAB-seq signals of samples of interest to obtain the absolute level of 5fC/5caC. The data were square root-transformed, and PCA was performed using the R package Seurat (Satija et al. 2015).
Analysis of strand bias of 5fC/5caC
Raw scMAB-seq data were first digitally transformed as described above. The genome was segregated into strand-specific 1-Mb bins (top [+] and bottom [−]). For bins with at least 10 5×CGs, the level of 5fC/5caC was calculated as the weighted mean of all 5×CGs in the bin, with sequencing coverage as the weight. For bins with <10 5×CGs, which indicates poor sequencing coverage, the level of 5fC/5caC was regarded as zero. For each 1-Mb genomic window, the strand bias was calculated as the level of 5fC/5caC in the top bin minus that of the bottom bin. Other bin sizes were also used for visualizing the strand bias or mapping SCE at high resolution. When using 500-kb bins, we calculated the level of 5fC/5caC only for bins with at least five 5×CGs and regarded that of the other bins as zero. When using 100-kb bins, the cutoff was at least two 5×CGs. When using bins >1 Mb, the cutoff was at least 10 5×CGs. For single mouse ES cells, we also calculated an overall strand bias for each cell to represent the overall difference of the level of modifications between the old and new strands. For each chromosome, we calculated a mean strand bias for all 5-Mb windows and used the absolute value of this mean as the chromosome strand bias. For a cell without strand bias, this value should be close to zero. The overall strand bias for a cell was calculated as the mean of the chromosome strand bias multiplied by 2. The reason to multiply by 2 was that, for a cell with strand bias, there was 50% probability that the paternal and maternal bias for a chromosome would be toward different directions and cancel each other out. In order to test whether a cell was significantly biased, we randomly shuffled the strand bias of 5-Mb windows and recalculated an overall strand bias. This random shuffling process was performed 500 times to establish a sample distribution for performing a two-tailed permutation test. In Figure 6B, log2 (observed bias/mean of random bias) is presented to show the extent of bias. For all of the analyses of strand bias, sex chromosomes were excluded.
Published data sets
For the analyses in Figure 1 and Supplemental Figures S1 and S2, we used the following published data sets of mouse ES cells: H3K4me1 (Meissner et al. 2008), H3K27ac (Creyghton et al. 2010), mouse ES cell enhancers (Shen et al. 2012), 5hmC DIP (Wu et al. 2011), 5fC DIP, 5caC DIP (Shen et al. 2013), and WG-MAB-seq (Wu et al. 2014). For the analysis in Figure 2, we used the following published data sets of two-cell embryos: TAB-seq (Wang et al. 2014) and DNase-seq (Lu et al. 2016). Gene-related features such as transcription start sites, introns, and exons were extracted from the RefSeq database (O'Leary et al. 2016). Genic region was defined as ±1.5 kb of a gene, and promoter was defined as 2 kb upstream a transcription start site. The MAB-seq and BS-seq data sets of this study have been deposited in Gene Expression Omnibus under accession number GSE95836.
Supplementary Material
Acknowledgments
We thank Dr. Shinpei Yamaguchi and Dr. Falong Lu for generating the Tet-triple-knockout mouse ES cells, and Dr. Hao Wu and Dr. Li Shen for generating the Tdg-depleted mouse ES cells. We thank Dr. Heather Lee for information related to PBAT. We also thank Dr. Falong Lu, Dr. Hao Wu, and Dr. Luis Tuesta for critical reading of the manuscript. X.W. was supported by a fellowship from China Scholarship Council. Y.Z. is an Investigator of the Howard Hughes Medical Institute. X.W. and Y.Z. designed the study. X.W., A.I., and T.S. performed the experiments. X.W. analyzed the data. X.W. and Y.Z. wrote the manuscript.
Footnotes
Supplemental material is available for this article.
Article published online ahead of print. Article and publication date are online at http://www.genesdev.org/cgi/doi/10.1101/gad.294843.116.
References
- Bachman M, Uribe-Lewis S, Yang X, Williams M, Murrell A, Balasubramanian S. 2014. 5-hydroxymethylcytosine is a predominantly stable DNA modification. Nat Chem 6: 1049–1055. [DOI] [PMC free article] [PubMed] [Google Scholar]
- Booth MJ, Marsico G, Bachman M, Beraldi D, Balasubramanian S. 2014. Quantitative sequencing of 5-formylcytosine in DNA at single-base resolution. Nat Chem 6: 435–440. [DOI] [PMC free article] [PubMed] [Google Scholar]
- Creyghton MP, Cheng AW, Welstead GG, Kooistra T, Carey BW, Steine EJ, Hanna J, Lodato MA, Frampton GM, Sharp PA, et al. 2010. Histone H3K27ac separates active from poised enhancers and predicts developmental state. Proc Natl Acad Sci 107: 21931–21936. [DOI] [PMC free article] [PubMed] [Google Scholar]
- Falconer E, Hills M, Naumann U, Poon SS, Chavez EA, Sanders AD, Zhao Y, Hirst M, Lansdorp PM. 2012. DNA template strand sequencing of single-cells maps genomic rearrangements at high resolution. Nat Methods 9: 1107–1112. [DOI] [PMC free article] [PubMed] [Google Scholar]
- Farlik M, Sheffield NC, Nuzzo A, Datlinger P, Schonegger A, Klughammer J, Bock C. 2015. Single-cell DNA methylome sequencing and bioinformatic inference of epigenomic cell-state dynamics. Cell Rep 10: 1386–1397. [DOI] [PMC free article] [PubMed] [Google Scholar]
- Gu TP, Guo F, Yang H, Wu HP, Xu GF, Liu W, Xie ZG, Shi L, He X, Jin SG, et al. 2011. The role of Tet3 DNA dioxygenase in epigenetic reprogramming by oocytes. Nature 477: 606–610. [DOI] [PubMed] [Google Scholar]
- Guo H, Zhu P, Wu X, Li X, Wen L, Tang F. 2013. Single-cell methylome landscapes of mouse embryonic stem cells and early embryos analyzed using reduced representation bisulfite sequencing. Genome Res 23: 2126–2135. [DOI] [PMC free article] [PubMed] [Google Scholar]
- Guo F, Li X, Liang D, Li T, Zhu P, Guo H, Wu X, Wen L, Gu TP, Hu B, et al. 2014. Active and passive demethylation of male and female pronuclear DNA in the mammalian zygote. Cell Stem Cell 15: 447–458. [DOI] [PubMed] [Google Scholar]
- Han D, Lu X, Shih AH, Nie J, You Q, Xu MM, Melnick AM, Levine RL, He C. 2016. A highly sensitive and robust method for genome-wide 5hmC profiling of rare cell populations. Mol Cell 63: 711–719. [DOI] [PMC free article] [PubMed] [Google Scholar]
- He YF, Li BZ, Li Z, Liu P, Wang Y, Tang Q, Ding J, Jia Y, Chen Z, Li L, et al. 2011. Tet-mediated formation of 5-carboxylcytosine and its excision by TDG in mammalian DNA. Science 333: 1303–1307. [DOI] [PMC free article] [PubMed] [Google Scholar]
- Incarnato D, Krepelova A, Neri F. 2014. High-throughput single nucleotide variant discovery in E14 mouse embryonic stem cells provides a new reference genome assembly. Genomics 104: 121–127. [DOI] [PubMed] [Google Scholar]
- Inoue A, Zhang Y. 2011. Replication-dependent loss of 5-hydroxymethylcytosine in mouse preimplantation embryos. Science 334: 194. [DOI] [PMC free article] [PubMed] [Google Scholar]
- Inoue A, Shen L, Dai Q, He C, Zhang Y. 2011. Generation and replication-dependent dilution of 5fC and 5caC during mouse preimplantation development. Cell Res 21: 1670–1676. [DOI] [PMC free article] [PubMed] [Google Scholar]
- Inoue A, Matoba S, Zhang Y. 2012. Transcriptional activation of transposable elements in mouse zygotes is independent of Tet3-mediated 5-methylcytosine oxidation. Cell Res 22: 1640–1649. [DOI] [PMC free article] [PubMed] [Google Scholar]
- Iqbal K, Jin SG, Pfeifer GP, Szabo PE. 2011. Reprogramming of the paternal genome upon fertilization involves genome-wide oxidation of 5-methylcytosine. Proc Natl Acad Sci 108: 3642–3647. [DOI] [PMC free article] [PubMed] [Google Scholar]
- Ito S, D'Alessio AC, Taranova OV, Hong K, Sowers LC, Zhang Y. 2010. Role of Tet proteins in 5mC to 5hmC conversion, ES-cell self-renewal and inner cell mass specification. Nature 466: 1129–1133. [DOI] [PMC free article] [PubMed] [Google Scholar]
- Ito S, Shen L, Dai Q, Wu SC, Collins LB, Swenberg JA, He C, Zhang Y. 2011. Tet proteins can convert 5-methylcytosine to 5-formylcytosine and 5-carboxylcytosine. Science 333: 1300–1303. [DOI] [PMC free article] [PubMed] [Google Scholar]
- Jones PA. 2012. Functions of DNA methylation: islands, start sites, gene bodies and beyond. Nat Rev Genet 13: 484–492. [DOI] [PubMed] [Google Scholar]
- Keane TM, Goodstadt L, Danecek P, White MA, Wong K, Yalcin B, Heger A, Agam A, Slater G, Goodson M, et al. 2011. Mouse genomic variation and its effect on phenotypes and gene regulation. Nature 477: 289–294. [DOI] [PMC free article] [PubMed] [Google Scholar]
- Krueger F, Andrews SR. 2011. Bismark: a flexible aligner and methylation caller for bisulfite-seq applications. Bioinformatics 27: 1571–1572. [DOI] [PMC free article] [PubMed] [Google Scholar]
- Law JA, Jacobsen SE. 2010. Establishing, maintaining and modifying DNA methylation patterns in plants and animals. Nat Rev Genet 11: 204–220. [DOI] [PMC free article] [PubMed] [Google Scholar]
- Lu F, Liu Y, Jiang L, Yamaguchi S, Zhang Y. 2014. Role of Tet proteins in enhancer activity and telomere elongation. Genes Dev 28: 2103–2119. [DOI] [PMC free article] [PubMed] [Google Scholar]
- Lu X, Han D, Zhao BS, Song CX, Zhang LS, Dore LC, He C. 2015. Base-resolution maps of 5-formylcytosine and 5-carboxylcytosine reveal genome-wide DNA demethylation dynamics. Cell Res 25: 386–389. [DOI] [PMC free article] [PubMed] [Google Scholar]
- Lu F, Liu Y, Inoue A, Suzuki T, Zhao K, Zhang Y. 2016. Establishing chromatin regulatory landscape during mouse preimplantation development. Cell 165: 1375–1388. [DOI] [PMC free article] [PubMed] [Google Scholar]
- Meissner A, Gnirke A, Bell GW, Ramsahoye B, Lander ES, Jaenisch R. 2005. Reduced representation bisulfite sequencing for comparative high-resolution DNA methylation analysis. Nucleic Acids Res 33: 5868–5877. [DOI] [PMC free article] [PubMed] [Google Scholar]
- Meissner A, Mikkelsen TS, Gu H, Wernig M, Hanna J, Sivachenko A, Zhang X, Bernstein BE, Nusbaum C, Jaffe DB, et al. 2008. Genome-scale DNA methylation maps of pluripotent and differentiated cells. Nature 454: 766–770. [DOI] [PMC free article] [PubMed] [Google Scholar]
- Miura F, Enomoto Y, Dairiki R, Ito T. 2012. Amplification-free whole-genome bisulfite sequencing by post-bisulfite adaptor tagging. Nucleic Acids Res 40: e136. [DOI] [PMC free article] [PubMed] [Google Scholar]
- Mooijman D, Dey SS, Boisset JC, Crosetto N, van Oudenaarden A. 2016. Single-cell 5hmC sequencing reveals chromosome-wide cell-to-cell variability and enables lineage reconstruction. Nat Biotechnol 34: 852–856. [DOI] [PubMed] [Google Scholar]
- O'Leary NA, Wright MW, Brister JR, Ciufo S, Haddad D, McVeigh R, Rajput B, Robbertse B, Smith-White B, Ako-Adjei D, et al. 2016. Reference sequence (RefSeq) database at NCBI: current status, taxonomic expansion, and functional annotation. Nucleic Acids Res 44: D733–D745. [DOI] [PMC free article] [PubMed] [Google Scholar]
- Raiber EA, Beraldi D, Ficz G, Burgess HE, Branco MR, Murat P, Oxley D, Booth MJ, Reik W, Balasubramanian S. 2012. Genome-wide distribution of 5-formylcytosine in embryonic stem cells is associated with transcription and depends on thymine DNA glycosylase. Genome Biol 13: R69. [DOI] [PMC free article] [PubMed] [Google Scholar]
- Satija R, Farrell JA, Gennert D, Schier AF, Regev A. 2015. Spatial reconstruction of single-cell gene expression data. Nat Biotechnol 33: 495–502. [DOI] [PMC free article] [PubMed] [Google Scholar]
- Shen Y, Yue F, McCleary DF, Ye Z, Edsall L, Kuan S, Wagner U, Dixon J, Lee L, Lobanenkov VV, et al. 2012. A map of the cis-regulatory sequences in the mouse genome. Nature 488: 116–120. [DOI] [PMC free article] [PubMed] [Google Scholar]
- Shen L, Wu H, Diep D, Yamaguchi S, D'Alessio AC, Fung HL, Zhang K, Zhang Y. 2013. Genome-wide analysis reveals TET- and TDG-dependent 5-methylcytosine oxidation dynamics. Cell 153: 692–706. [DOI] [PMC free article] [PubMed] [Google Scholar]
- Shen L, Inoue A, He J, Liu Y, Lu F, Zhang Y. 2014. Tet3 and DNA replication mediate demethylation of both the maternal and paternal genomes in mouse zygotes. Cell Stem Cell 15: 459–470. [DOI] [PMC free article] [PubMed] [Google Scholar]
- Smallwood SA, Lee HJ, Angermueller C, Krueger F, Saadeh H, Peat J, Andrews SR, Stegle O, Reik W, Kelsey G. 2014. Single-cell genome-wide bisulfite sequencing for assessing epigenetic heterogeneity. Nat Methods 11: 817–820. [DOI] [PMC free article] [PubMed] [Google Scholar]
- Smith ZD, Meissner A. 2013. DNA methylation: roles in mammalian development. Nat Rev Genet 14: 204–220. [DOI] [PubMed] [Google Scholar]
- Song CX, Szulwach KE, Dai Q, Fu Y, Mao SQ, Lin L, Street C, Li Y, Poidevin M, Wu H, et al. 2013. Genome-wide profiling of 5-formylcytosine reveals its roles in epigenetic priming. Cell 153: 678–691. [DOI] [PMC free article] [PubMed] [Google Scholar]
- Sun Z, Dai N, Borgaro JG, Quimby A, Sun D, Correa IR Jr, Zheng Y, Zhu Z, Guan S. 2015. A sensitive approach to map genome-wide 5-hydroxymethylcytosine and 5-formylcytosine at single-base resolution. Mol Cell 57: 750–761. [DOI] [PubMed] [Google Scholar]
- Tahiliani M, Koh KP, Shen Y, Pastor WA, Bandukwala H, Brudno Y, Agarwal S, Iyer LM, Liu DR, Aravind L, et al. 2009. Conversion of 5-methylcytosine to 5-hydroxymethylcytosine in mammalian DNA by MLL partner TET1. Science 324: 930–935. [DOI] [PMC free article] [PubMed] [Google Scholar]
- Wang L, Zhang J, Duan J, Gao X, Zhu W, Lu X, Yang L, Zhang J, Li G, Ci W, et al. 2014. Programming and inheritance of parental DNA methylomes in mammals. Cell 157: 979–991. [DOI] [PMC free article] [PubMed] [Google Scholar]
- Wilson DM 3rd, Thompson LH. 2007. Molecular mechanisms of sister-chromatid exchange. Mutat Res 616: 11–23. [DOI] [PubMed] [Google Scholar]
- Wossidlo M, Nakamura T, Lepikhov K, Marques CJ, Zakhartchenko V, Boiani M, Arand J, Nakano T, Reik W, Walter J. 2011. 5-Hydroxymethylcytosine in the mammalian zygote is linked with epigenetic reprogramming. Nat Commun 2: 241. [DOI] [PubMed] [Google Scholar]
- Wu H, Zhang Y. 2014. Reversing DNA methylation: mechanisms, genomics, and biological functions. Cell 156: 45–68. [DOI] [PMC free article] [PubMed] [Google Scholar]
- Wu H, D'Alessio AC, Ito S, Wang Z, Cui K, Zhao K, Sun YE, Zhang Y. 2011. Genome-wide analysis of 5-hydroxymethylcytosine distribution reveals its dual function in transcriptional regulation in mouse embryonic stem cells. Genes Dev 25: 679–684. [DOI] [PMC free article] [PubMed] [Google Scholar]
- Wu H, Wu X, Shen L, Zhang Y. 2014. Single-base resolution analysis of active DNA demethylation using methylase-assisted bisulfite sequencing. Nat Biotechnol 32: 1231–1240. [DOI] [PMC free article] [PubMed] [Google Scholar]
- Wu H, Wu X, Zhang Y. 2016. Base-resolution profiling of active DNA demethylation using MAB-seq and caMAB-seq. Nat Protoc 11: 1081–1100. [DOI] [PMC free article] [PubMed] [Google Scholar]
- Xia B, Han D, Lu X, Sun Z, Zhou A, Yin Q, Zeng H, Liu M, Jiang X, Xie W, et al. 2015. Bisulfite-free, base-resolution analysis of 5-formylcytosine at the genome scale. Nat Methods 12: 1047–1050. [DOI] [PMC free article] [PubMed] [Google Scholar]
Associated Data
This section collects any data citations, data availability statements, or supplementary materials included in this article.