Abstract
Summary: Immunogold electron microscopy has identified a variety of blood-brain barrier (BBB) proteins with transporter and regulatory functions. For example, isoforms of the glucose transporter, protein kinase C (PKC), and caveolin-1 are BBB specific. Isoform 1 of the facilitative glucose transporter family (GLUT1) is expressed solely in endothelial (and pericyte) domains, and ∼75% of the protein is membrane-localized in humans. Evidence is presented for a water cotransport function of BBB GLUT1. A shift in transporter polarity characterized by increased luminal membrane GLUT1 is seen when BBB glucose transport is upregulated; but a greater abluminal membrane density is seen in the human BBB when GLUT1 is downregulated. PKC colocalizes with GLUT1 within these endothelial domains during up- and downregulation, suggesting that a PKC-mediated mechanism regulates human BBB glucose transporter expression. Occludin and claudin-5 (like other tight-junctional proteins) exhibit a restricted distribution, and are expressed solely within interendothelial clefts of the BBB. GFAP (glial fibrillary acidic protein) is uniformly expressed throughout the foot-processes and the entire astrocyte. But the microvascular-facing membranes of the glial processes that contact the basal laminae are also polarized, and their transporters may also redistribute within the astrocyte. Monocarboxylic acid transporter and water channel (Aquaporin-4) expression are enriched at the glial foot-process, and both undergo physiological modulation. We suggest that as transcytosis and efflux mechanisms generate interest as potential neurotherapeutic targets, electron microscopic confirmation of their site-specific expression patterns will continue to support the CNS drug discovery process.
Keywords: Aquaporin-4, blood-brain barrier, caveolin-1, claudin-5, electron microscopy, GFAP, GLUT1 glucose transporter, occludin, pegylated immunoliposome
INTRODUCTION
Blood-brain barrier (BBB) microvasculature consists of two capillary cell components (pericytes and endothelia), which are typically surrounded by glial cell end-foot processes. A number of major characteristics of BBB endothelial cells have been shown to be astrocyte dependent,1 providing a rationale for the close association of the glial-end foot processes and endothelial cells. Functional differences (i.e., polarization) between the luminal and abluminal membranes have been described, resulting in further investigation of specialized domains within the blood-brain barrier capillary. The distance separating the luminal and abluminal capillary membranes is 300–500 nm in human brain microvessels.2 The association of abluminal capillary cell membrane with the surrounding glial end-foot processes is equally intimate in normal brain, but it can be reduced3 or significantly thickened4 in pathological conditions. The basal lamina is an acellular membrane composed of type IV collagen, fibronectin, and laminin interposed between endothelial cells and astrocytic end feet.5,6 In our experience, the human basal lamina is typically on the order of 150–200 nm in thickness but can reach ∼400 nm in immersion-fixed pathological specimens.
Because the basal lamina is so small, it has created a great deal of confusion in assigning ligand reactivity to the different endothelial and glial domains. In standard light microscopy, resolution of such differences in tissue sections of 5–10 μm in thickness is challenging. The close juxtaposition of the luminal, abluminal, and glial foot-domains requires that high-resolution methods be used to confirm putative differences between these structures. Even when higher resolution double-label confocal microscopy is used to identify membranes and nuclei, Stewart et al.7 indicate that only in the region of the endothelial nucleus are the luminal and abluminal membranes sufficiently far apart to be distinguished. A careful three-dimensional image reconstruction of overlapping glial, endothelial nuclear, and endothelial membrane intensities (three different known signals) was required to reliably assign the intermediate signal of a fourth (unknown) transporter test signal locus to the abluminal membrane domain.8
Immunoelectron microscopy using gold markers is the preferred method because it permits (high resolution) detection of specific cellular proteins in endothelial versus glial domains. This technique has undergone a steady development over the past years because it meets the need to precisely assign macromolecules to specific locations and domains within both tissues and cells. It has also been used to reveal antigens that may be present in low or trace amounts at specific locations, and thus contributed to a greater understanding of cell mechanisms and functional specialization domains within tissues. In contrast to both light microscopic immunocytochemistry and confocal immunofluorescence localization studies, immunogold electron microscopy (EM) uniquely provides the ability to quantitatively analyze protein expression at specific cell and tissue locations. In EM, considerable differences in BBB epitope densities may be seen in comparing different brain regions.9–11 For example, brain capillary membrane GLUT1 glucose transporter densities vary by a factor of 2- to 3-fold in a comparison of cerebellum, hippocampus, and frontal cortex microvasculature.12 In light and confocal microscopic procedures, the apparent quantity of reaction product observed at a specific cellular domain (such as an external membrane) cannot be directly related to the membrane density of the target. In contrast, the quantitative assessment of EM-gold particles on luminal and abluminal membranes within the same cell precisely identifies the quantity of immunoreactive epitopes within these two domains. Quantitative analyses of entire capillary profiles, as opposed to sectors or regions, are advocated13 because this technique recognizes the capillary profile as a functional unit, and reduces the likelihood of tissue sampling errors.
THE GLUCOSE TRANSPORTER IN BBB ENDOTHELIA
The GLUT1 transporter represents 5% of the total protein in human erythrocytes, and it was generally believed that this enrichment of GLUT1 was the highest concentration density for any glucose transporter.14 However, EM immunogold analyses of human brain resections clearly demonstrated that the overexpression of GLUT1 is 150% greater in BBB endothelial membranes from seizures than in erythrocytes,15 and luminal membranes in brain injuries contained 300% more GLUT1 than red cells.16 To confirm that immunogold density in the BBB was functionally related to transporter membrane density, developmental modulations in BBB glucose transport have been examined in vivo. A physiological study comparing newborn, suckling, weanling, and adult rabbits was executed. The half-saturation constant (Km) was unchanged, but transporter maximal velocities (= Vmax, an indicator of the activity and relative number of transporter proteins) increased significantly with age.17,18 Quantitative Western blotting analyses of the concentration of immunoreactive GLUT1 in mass-isolated microvessels at these four developmental stages also correlated significantly with these changes in Vmax.19
Because the quantitative Western blot analyses of immunoreactive GLUT1 in isolated microvessels indicate total cellular GLUT1, and transporter activity in vivo is a function of transporter concentration at the membrane (and transporter mobility), further investigations used electron microscopic immunogold analyses of GLUT1 reactivity in endothelial cytoplasm and membranes.17 Capillary profile ultrastructure changes significantly during development; luminal membrane amplification and mean cytoplasmic thickness are two parameters which dramatically decrease. A digital analysis of capillary profiles was performed in association with GLUT1-immunogold particle counting of newborn through adult (1, 14, 28, and 75 days old) cortical rabbit brain samples. Transporter maximal velocities (determined in vivo) indeed correlate with the number of GLUT1 immunoreactive sites per micron on the luminal and abluminal membrane circumferences.17,18 This demonstration of longitudinal upregulation of physiological transporter activity in vivo provided convincing evidence that quantitative electron microscopic analyses of membrane-associated immunoreactive transporter are a valid indicator of functional changes.
POLARITY OF THE BRAIN MICROVASCULATURE
The polarity of the blood-brain barrier is an unusual feature of the cerebral microvasculature. The concept is that luminal and abluminal membranes of the brain capillaries are not identical, but instead exhibit asymmetric differences characterized by either qualitative or quantitative differences in expression of selected membrane components. Table 1 presents examples of studies in which localized luminal and/or abluminal expression of a wide variety of different ligands has been examined, and emphasizes data derived from in vivo analyses. The fact that there is not complete agreement in assigning all ligands to a specific BBB domain is a further indication of the fact that sometimes even techniques such as confocal microscopy do not provide a definitive assessment. The microvascular-facing membranes of the glial end foot processes, which are in contact with the capillary basal laminae, are also highly polarized in situ5 as discussed below.
TABLE 1.
Studies of Blood-Brain Barrier Polarity: Examples of Similarities and/or Differences in Abluminal:Luminal Membrane Cerebral Microvasculature (in Vivo)
| Protein | Observation (Reference) |
|---|---|
| Na+-Amino acid transporter | Functions only on the abluminal membrane20 |
| Na+K+ATPase; 5′ nucleotidase | Both found only on abluminal membrane, whereas alkaline phosphatase and g-glutamyl transpeptidase were present on luminal and abluminal membranes21 |
| γ-Glutamyl transpeptidase | γ-GTP was enriched on the luminal membrane22 |
| Alkaline phosphatase, 5′nucleotidase, thiamine pyrophosphatase | Enriched on luminal membrane in normal mice; but abluminal expression was increased in scrapie infected animals23 |
| Na+/Na+, Na+/H+ transporter | Present on the abluminal, but not luminal membranes24 |
| Mg++ATPase and alkaline phosphatase | In glioblastomas, luminal membrane expression of both markers is increased25 |
| GLUT1 glucose transporter | In normal rats, abluminal membrane GLUT1 is 3-fold greater than luminal membrane26 |
| Transferrin receptor (TfR) | Transcytosis of TfR from luminal to abluminal capillary membrane, and into parenchyma27 |
| P-glycoprotein | P-glycoprotein, responsible for brain efflux of many pharmaceuticals, was highly expressed in luminal capillary membranes28,29 |
| P-glycoprotein | P-glycoprotein activity was in the astrocyte foot process, and not the endothelial cell. In dual label studies P-gp did not colocalize with endothelial GLUT1, but did colocalize with astroglial GFAP30,31 |
| Human GLUT1 glucose transporter | In high-GLUT1-expressing capillaries, the luminal to abluminal membrane ratio <1.0; but >1.0 in low-GLUT1-expressing endothelia2 |
| Monocarboxylic acid transporter (MCT1) | Neonate MCT1 is greater than in adults. Equal MCT1 density in abluminal and luminal membranes at both ages32 |
| Intercellular adhesion molecule-1 (ICAM-1) | In hemangiomas, luminal>abluminal ICAM-1. Age-variations in ICAM expression were seen in mouse BBB33 |
| GLUT1 glucose transporter | Abluminal:luminal ratio is 4:1 in normals; 1:1 in stroke-prone rats34 |
| Ca++ ATPase; Ecto ATPase | Ca++ATPase is luminally enriched, whereas ecto ATPase is primarily localized on abluminal membranes35 |
| Na+/K+ ATPase | Abluminal localization is questioned; lower fixative concentrations produce more luminal membrane labeling36 |
| Essential fatty acid transporters | Hypothesis: essential fatty acids may use lipoprotein receptors on the luminal membrane to enter the CNS37 |
| Neonatal Fc receptor (FcRn) | Abluminal internalization of IgG, and only brain-to-blood transcytosis suggests no luminal FcRn activity38,39 |
| MCT1 | In ketonemic up-regulation, abluminal MCT1 increased 2-fold. Equal abluminal and luminal MCT1 in controls40 |
| Amino acid transporters | Na+-dependent amino acid transporters are abluminal41 |
| Heparin sulfate proteoglycan (HSPG) | Perlecan (a core protein of HSPG) is expressed at the abluminal membrane, where it functions in transport of bFGF42 |
| Rat organic anion transporter 3 (rOAT3) | The acid efflux transporter, rOAT3 is expressed at the abluminal membrane43 |
| Aspartic acid transporter (ASCT2) | ASCT2 immunoreactivity is localized to the abluminal capillary membrane8 |
| Erythropoietin receptor (EPO-r) | EPO-r is equally expressed on luminal and abluminal BBB membranes, as well as astrocytic end feet. Upregulation of EPO-r is seen in epileptogenic hippocampus44 |
| Na+-dependent glucose transporter (SGLT1) | Luminal membrane expression of SGLT1 is suggested45 |
Luminal and abluminal membrane fractions have been mass-isolated from bovine brain capillaries. The disadvantage with this technique is that the final product yields only partially purified membrane vesicle populations.46 This technique may not be suitable for the study of abluminal and luminal membrane differences because sodium-potassium-ATPase is used as a marker of the abluminal fraction. As indicated in Table 1, this enzyme was also thought to be specifically localized to abluminal membranes, but recent studies indicate it is enriched in abluminal membranes and also present on the luminal BBB.35,46 The other marker used to identify abluminal-enriched fractions, the alanine preferring System A amino acid transporter,47 is also present in glial cells; and glial contamination cannot be discounted in any analysis of mass-isolated brain capillaries.31 Table 1 also exemplifies that for many BBB transporters, abluminal-luminal membrane shifts have been identified in normal biological conditions (e.g., development) that further challenge the use of mass isolated membrane fractions. Analyses of intact cells is more informative for polarity studies of membrane proteins (such as GLUT1 or MCTs) because populations of single endothelia are examined, and comparisons can be made between resected tissues from several different sources. These analytical studies show that there can be greater differences in GLUT1 expression between adjacent endothelial cells than between the luminal and abluminal membranes.2
The first descriptions of BBB polarity did not come from microscopic analyses. Betz and Goldstein20 showed that in isolated brain capillaries, Na+-dependent neutral amino acid transport could be demonstrated. Because in vivo studies demonstrated that this transporter was not functional (i.e., on the luminal membrane), they proposed polarity of the BBB to explain these observations. Using electron microscopic localization in combination with capillary isolation techniques, Betz et al.21 reported the localization of Na+K+ ATPase and 5′-nucleotidase activity to the abluminal membrane, whereas alkaline phosphatase and γ-glutamyl transpeptidase were found in both luminal and abluminal membrane domains. Cremer et al.48 and others49–51 recognized from in vivo studies that glucose transport, which was operationally treated as permeation through a single membrane, actually represented glucose movement through a double (luminal and abluminal) membrane barrier. It was generally accepted that blood-to-brain influx, and brain-to-blood efflux of glucose were equal (or symmetrical).49–52 Cunningham et al.51 considered the possibility that BBB glucose transport could be kinetically analyzed in terms of translocation through a single membrane, or alternatively via individually (asymmetric) luminal and abluminal membranes. From these double-membrane mathematical analyses of brain glucose transport in modulated states (wherein anesthetized and conscious animals, or control and kainate-treated rats were compared) asymmetric distributions of capillary glucose transporter were predicted.48,51,53
Immunogold electron microscopic studies, using antisera to the GLUT1 glucose transporter, were used to study the subcellular distribution of transporter protein in the BBB.17,54–56 In dog brain capillaries, Gerhart et al.54 observed a symmetrical distribution of GLUT1 epitopes between the luminal and abluminal membranes. In contrast, an asymmetrical distribution (wherein 3- to 4-fold more epitopes were seen on the abluminal membrane) was reported in rat brain capillaries by Farrell and Pardridge,56 and confirmed in developing rabbits,17 rats,57 and mice.10 This asymmetric distribution of glucose transporter between luminal and abluminal membranes may be a unique feature of BBB endothelia, characterized by species-specific different paradigms in human and other nonhuman primates.12
HIGH- (TYPE A) AND LOW-GLUT1-EXPRESSING (TYPE B) CAPILLARIES
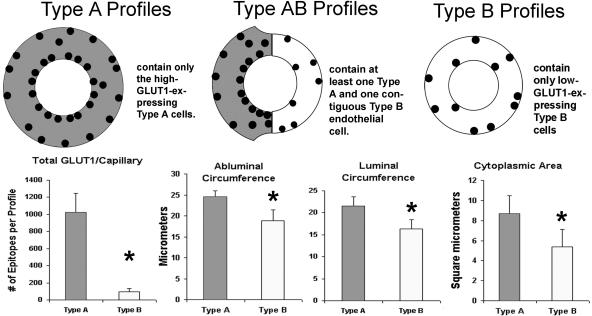
In addition to the asymmetric distribution of GLUT1, two distinct capillary types were noted in the expression of human BBB GLUT1. We observed in vivo changes in the distribution of GLUT1 glucose transporters in brain tissues resected from patients undergoing surgery for treatment of their seizures (FIG. 1). These two configurations of endothelial cell GLUT1 also exhibited significant differences in size; high expression of GLUT1 glucose transporter occurred coincidentally with a 30–40% size increase in cross-sectional areas (lumens) of the type A capillaries. A digitized analysis of morphometric parameters of over 220 complete capillary profiles from five different resections also indicated that luminal and abluminal membrane circumferences were ∼25% greater in type A capillary profiles. Capillary cytoplasmic areas was significantly enlarged in the type A profiles, and capillary thickness was similarly increased.2 In this bimodal GLUT1 distribution pattern, the smaller (type B) endothelial cells consistently displayed low GLUT1 immunoreactivity. The size differences between these two types of capillaries is attributable to swelling in the GLUT1-upregulated endothelial cell. This is due to the fact that facilitative glucose transporters (of the GLUT supergene family) in addition to regulating glucose entry, cotransport water58,59 in the absence of an osmotic gradient,60 perhaps via a gated channel mechanism.61 Water transporters of the aquaporin family are not found in BBB endothelia, and Aquaporin 4 (AQP4, one of the water channel proteins that is significantly expressed in brain) is principally localized to the pericapillary glial foot processes.62 Highly expressed transporter also causes swelling in isolated oocytes due to the cotransport of water via glucose transporter protein,63 but in erythrocytes, the GLUT1 protein does not cotransport significant amounts of water because red cells have a separate (AQP-1) water transporter.64
FIG. 1.
A diagrammatic comparison of type A, AB, and B capillary profiles of the human brain microvasculature, as identified with EM GLUT1 immunogold studies. Some of the major differences are presented that summarize information gained from more than 25 surgical resections. The high-GLUT1-type A endothelia express 20–30 GLUT1 epitopes/μm of luminal membrane, but the low-GLUT1-type B endothelial cells express only 1–2 GLUT1 epitopes/μm of luminal membrane. Furthermore, in type A capillaries the luminal GLUT1 density > abluminal density. In contrast, the luminal density < abluminal membrane density in type B capillaries. Normal rat, mouse, and rabbit BBB exhibit the characteristics of human type B capillaries, but no erythrocyte GLUT1 immunoreactivity is apparent in these species. Human erythrocytes, within the lumens of either type A or type B profiles, exhibit 5–10 GLUT1 epitopes/μm of surface membrane. The lower panel demonstrates that the total number of immunoreactive GLUT1 proteins per profile is an order of magnitude greater (p < 0.05) in type A than type B profiles. This overexpression of GLUT1 parallels remarkable changes in capillary morphology. The center panels demonstrate that in type A profiles, luminal and abluminal membrane circumferences are significantly (p < 0.05) larger. In addition the cytoplasmic cross-sectional surface areas are also significantly (p < 0.05) larger than in type B profiles,2 as seen in the lower right panel.
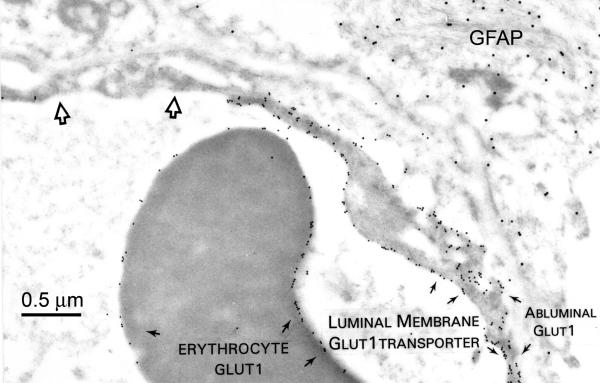
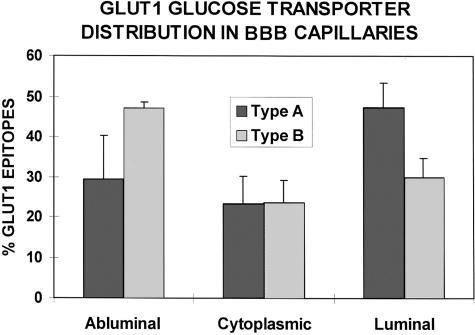
In capillary profiles where both type A and type B endothelial cells were present (FIG. 2), the contiguous larger type A endothelial cells showed a 5- to 10-fold greater expression of membrane GLUT1 transporter protein.2 The fact that red cells seen in the lumens of both type A and B capillaries exhibited identical concentrations of membrane GLUT1 emphasized that the phenomenon was not an artifact of fixation or immunogold staining (FIG. 2). Furthermore, even when GLUT1 percentage was examined within endothelial cell domains, type A capillaries exhibited relatively more luminal membrane GLUT1, whereas abluminal membrane GLUT1 was predominant in type B capillaries (FIG. 3). This analysis indicates that there was not only a marked quantitative change in glucose transporter expression, but a concomitant shift in GLUT1 polarity. The same bimodal pattern was seen in human brain injury,16 but a slightly different bimodal GLUT1 distribution pattern was described in the retinal vasculature of the diabetic eye.65 Brain regional GLUT1 differences, as well as shifts in GLUT1 polarity, have also been defined in mouse9–11,23 and rat34 models of disease. For example, in control rats (both normal and stroke resistant), the abluminal:luminal GLUT1 ratio was found to be 4:1, but it was reduced to 1:1 in the stroke-prone hypertensive rat.34 It was concluded that these changes in glucose transporter expression contributed to the pathogenesis of the disease.
FIG. 2.
A human BBB capillary immunostained for the full-length GLUT1 glucose transporter (identified by 10-nm gold particles), and GFAP (GFAP, linked to 20-nm gold particles, using antisera and methods described elsewhere.2 Note the high GLUT1-expressing type A endothelial cell on the right side of the capillary can be sharply contrasted with the low GLUT1-expressing type B cell (open arrows) on the upper left. In the type A cell, luminal membrane expression is greater than that of the abluminal membrane, and erythrocyte membrane GLUT1 expression is intermediate between that of the type A versus the type B endothelial cell. GFAP epitopes (upper right) are uniformly distributed throughout the astrocyte.
FIG. 3.
Quantitative immunogold EM permits analyses of epitope densities within different intracellular domains of the BBB endothelia. We compared capillaries consisting of high-GLUT1-expressing type A cells, and (low-GLUT1) type B capillaries. From a determination of the total GLUT1 epitopes per capillary profile, the percentages of cytoplasmic, luminal-, and abluminal-membrane GLUT1 proteins are compared. This analysis clearly suggests that in high GLUT1-expressing type A capillaries 45–50% of the GLUT1 is on the luminal membrane, 25% is cytoplasmic, and 25–30% is seen on the abluminal membrane. In contrast, about 45% of the GLUT1 proteins are abluminal in type B profiles, with 25% in the cytoplasmic domain, and about 30% seen in the luminal membrane. This analysis indicates that GLUT1 upregulation in BBB endothelia may involve a preferential shift of transporter to the luminal membranes, whereas GLUT1 downregulation may be associated with relatively increased abluminal transporter proteins. It also suggests that the luminal membrane transporter proteins may be more labile, and one possible mechanism could involve shedding of GLUT1 protein directly into the lumen. (Vertical bars = 1 SD).
REGULATION OF BBB GLUT1 VIA A PROTEIN KINASE C MECHANISM
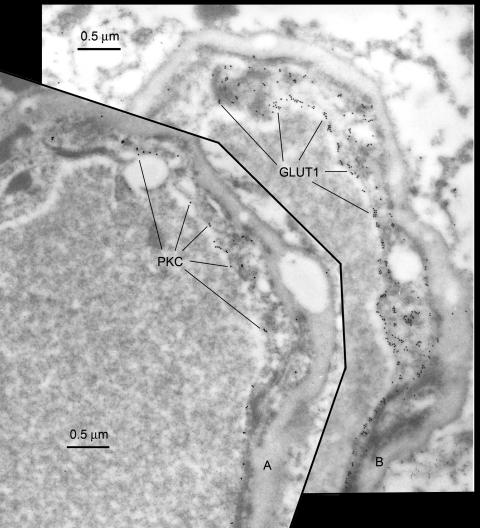
In examinations of PKC immunoreactivity in human brain resections, we also observed type A profiles that exhibited high expression of PKC, type B profiles that exhibited low expression of PKC and type AB profiles that exhibited mixed expression of PKC. Figure 4 illustrates two serial sections of the same type AB profile in which the foreground section (FIG. 4A) illustrates PKC immunoreactivity and in the serial section (FIG. 4B), GLUT1 immunoreactivity is displayed. Note that the type A endothelial cell that forms the right side of the capillary shows that GLUT1 and PKC expression are coincidentally upregulated in the endothelial cell forming the right border of the capillary. In contrast reduced GLUT1 and reduced PKC expression are seen in the type B endothelial cell (upper left). Closer examination also illustrates that relatively more PKC expression is apparent on the luminal than the abluminal membrane (FIG. 4A), just as luminal membrane GLUT1 expression is greater than on the abluminal surface (FIG. 4B).
FIG. 4.
Serial sections of the same capillary profile immunostained for PKC, foreground (FIG. 4A); and the GLUT1 glucose transporter, (background, FIG. 4B). The pan-PKC antisera was prepared after immunization with a C-terminal 40-amino acid peptide fragment and obtained from Upstate Biotechnology (Lake Placid, NY). The GLUT1 antiserum is described elsewhere.2 Note that in the type A endothelial cell which forms the right side of the capillary profile, high GLUT1 expression is readily apparent (FIG. 4B). In the same cell, high PKC expression is also seen (FIG. 4A), indicating colocalization of the two different epitopes. Luminal membrane PKC expression is also greater than abluminal PKC expression (FIG. 4A), just as luminal membrane GLUT1 expression is greater than that seen on the abluminal membrane (FIG. 4B).
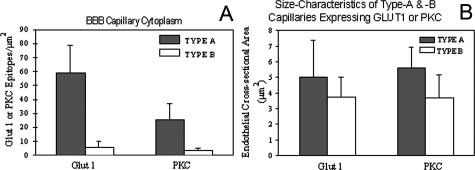
In other studies of type A and B endothelia from human resections, the numbers of GLUT1-immunoreactive epitopes are also highly correlated with the number of PKC-gold epitopes seen in the endothelial cells. Populations of high-PKC-expressing (type A) cells and low-PKC-expressing (type B) cells are also apparent (FIG. 5A). Digitized morphometric analyses further indicate that type A profiles are larger than type B profiles, in both GLUT1 and PKC analyses (FIG. 5B).
FIG. 5.
A: In quantitative analyses of type A and B endothelia from human resections, note that the epitope density is ∼8-fold greater in type A capillaries than in type B endothelia, and this difference is significant (p < 0.05) for both GLUT1 and PKC expression. Comparisons of type A and B capillaries indicate that the expression of GLUT1-immunoreactive epitopes is also highly correlated with the expression of PKC-gold epitopes in other capillary domains such as the abluminal membranes, or luminal membranes (not shown). B: Type A profiles are significantly larger than type B profiles, regardless of whether the endothelia are identified by their expression of GLUT1 or PKC epitopes. From these indications that larger type A profiles also exhibit concomitantly greater GLUT1 and greater PKC expression, we conclude that a PKC-mediated mechanism controls GLUT1 expression in the human BBB. (Vertical bars =1 SD).
Many in vitro studies indicate glucose transporter activity is PKC mediated in a variety of different tissues, including cytosol to membrane recycling in oocytes,66 intestinal GLUT2 recruitment,67 and translocation of GLUT1 in retinal capillary membranes68,69 and mesangial cells.70 PKC also regulates translocation of GLUT171 and GLUT4 in muscle72,73 and fat cells.74,75 However, there is always a concern that demonstration of a regulatory mechanism in cultured cells in vitro may not replicate the in vivo situation with rigorous fidelity. Collectively, the data indicate that larger type A profiles also exhibit concomitantly greater GLUT1 and greater PKC expression, whereas smaller type B capillary profiles were consistently exhibit reduced expression of both GLUT1 and PKC. We conclude that in human brain capillaries in vivo, both GLUT1 transporter polarization, and the brain capillary bimodal GLUT1 configuration, are PKC mediated.
CAVEOLIN-1 IN BBB ENDOTHELIA
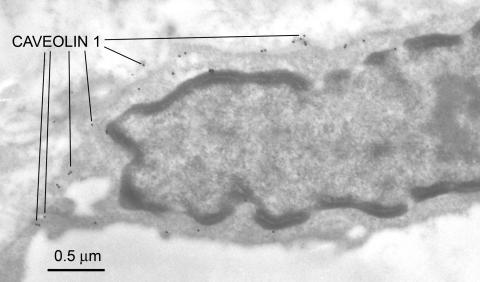
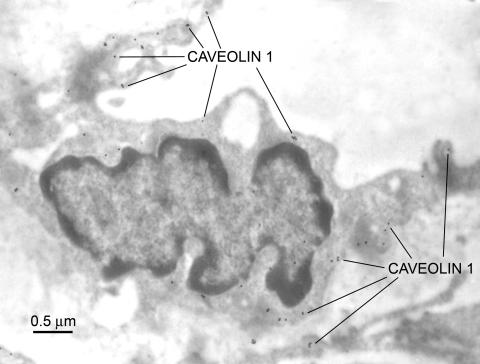
Caveolae are 50- to 100-nm vesicular invaginations of the plasma membrane involved in molecular transport, cell adhesion, and signal transduction.76 Caveolin, a 21- to 24-kDa protein, is a principal structural component of caveolae, and three caveolin genes (caveolin-1, -2, and -3) have been identified. Endothelial cells are known to express the highest levels of caveolin-1.76 Virgintino et al.77 have reported that caveolin-1 and -2 are found in rat microvessels, and caveolin-1 is expressed in the human BBB. In the primate BBB, confocal microscopic studies indicate caveolin-1 is found in both endothelium and astrocytes.78 In human seizure resections, we have observed caveolin-1 alpha expression is apparent throughout the BBB endothelia (FIG. 6). Preliminary studies suggest abluminal enrichment, but at this time, it is not known whether caveolin-1 exhibits polarized expression in these capillaries. Altered caveolin expression may occur in several different human diseases, including cancer, Alzheimer's disease, and muscular dystrophy.79 We examined caveolin-1 expression in experimental gliomas, studying nude mice implanted with U-87 human tumor cells. In these endothelia, the luminal surface of the capillary loses its uniform appearance and luminal membrane folding, and endothelial hyperplasia is seen. Vacuoles, invaginations, and extensions around the luminal membrane are apparent, and hyperplasia is seen along with enrichment of caveolin-1 expression (FIG. 7).
FIG. 6.
Caveolin-1 expression in the BBB endothelial cell from a human seizure resection. The rabbit polyclonal antiserum to caveolin-1 was obtained from Santa Cruz Biotechnology Inc. (Santa Cruz, CA) and was used at a dilution of 1:100. Caveolins are known to participate in the formation of cytoplasmic vesicular structures, and transcytosis mechanisms. They may therefore assume an important role in facilitating the BBB transport of molecular Trojan horses that piggy-back large molecules via receptor transcytosis. This protein appears to have a predominant expression at the endothelial cell membranes and to a lesser extent within the cytoplasmic domain.
FIG. 7.
Caveolin-1 expression in tumor-tissue from a nude mouse brain, in which U87 human glioma cells had been implanted. The antiserum used was identified in Figure 6.
Transcytosis is one of the first functional roles proposed for caveolae. Molecules such as albumin and insulin are known to undergo endothelial transcytosis in peripheral tissue, perhaps through different subsets of caveolae.76 If insulin transcytosis at the BBB is similarly via caveolae, the up- or downregulation of caveolin-1 could affect vector-mediated brain drug delivery via the insulin receptor. Coloma et al.80 have shown that the murine 83-14 monoclonal antibody to the human insulin receptor can indeed be used for brain drug targeting of neurotherapeutics that normally do not cross the BBB, and their study suggests that insulin receptor expression is more than adequate for this purpose. Further studies are needed to determine whether the expression of caveolin-1 protein is similarly adequate; if it is relatively increased in luminal, cytoplasmic, or abluminal membrane domains; and whether BBB caveolin-1 expression may be altered in certain neuropathological states.
Interendothelial tight-junction proteins in the BBB
The interendothelial tight junctions turn cell-to-cell contacts into zones of tight adherence, and as a consequence there is no paracellular pathway for drug or solute movement from plasma into the CNS. In capillaries of the BBB, the tight-junctional proteins ZO-1 (zonula occludens protein), occludin, claudin-1, and β-catenin are now known to be selectively expressed within interendothelial clefts.34,81–83 During development, alterations in the expression of tight-junctional proteins have been reported,81,83 but no changes were seen in stroke-prone hypertensive rats.34 However, in a mouse model of muscular dystrophy, the strict localization of ZO-1 within tight junctions is lost, and the protein is more randomly apparent throughout the endothelial cytoplasm.82
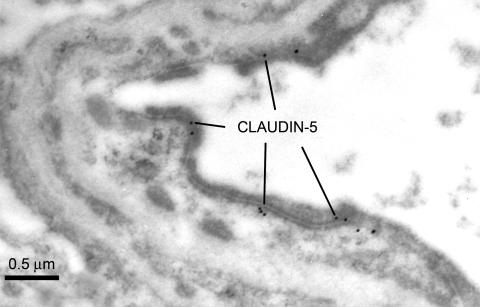
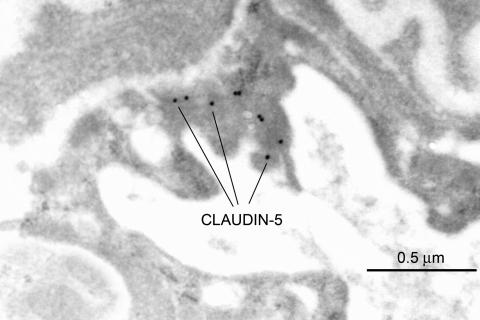
Claudin-5 is another major cell adhesion molecule of tight junctions in BBB endothelial cells. In normal brain, claudin-5 expression is apparently expressed intermittently along the entire interendothelial clefts (FIG. 8), in a similar pattern to that seen for zonula occludens-1.83 However in capillaries from brain tissue which is adjacent to a glioma (the rat RG-2 brain tumor), some amplification of the luminal membrane is apparent and the interendothelial cleft is reduced in length, resulting in a more confined claudin-5 expression (FIG. 9). Other studies suggest that in claudin-5-deficient mice, there is a selective increase in BBB permeability limited to small molecules of less than 800, but larger molecules are restricted just like the normal BBB.84 It has been suggested that if the BBB can be manipulated to allow selective entry of small molecules, claudin-5 may represent a possible target for the development of drugs designed for this purpose.85 However, it is not known whether selective repression of claudin-5 would result in a compensatory upregulation of one or more of the many other tight-junctional proteins.
FIG. 8.
Claudin-5 expression in the normal rat BBB. The polyclonal rabbit antiserum to the C-terminal sequence was obtained from Zymed Laboratories Inc. (South San Francisco, CA), and used at a dilution of 1:50 or 1:25. In the BBB, Claudin-5 is not expressed at the luminal nor abluminal endothelial membranes, but it is solely expressed intermittently along the entire interendothelial cleft. A similar expression pattern was seen in human seizure resections (not shown).
FIG. 9.
Claudin-5 expression in rat brain tissue adjacent to an experimentally implanted RG2 glioma. Details regarding the polyclonal rabbit antiserum are as for Figure 8.
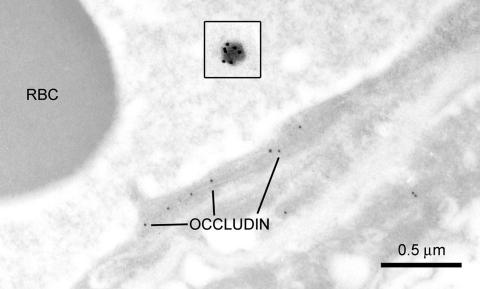
Like other tight-junctional proteins, occludin is not expressed on luminal or abluminal membranes, nor within the endothelial cytoplasm. It is localized to regions within the interendothelial cleft in both the mouse brain83 and in normal rats (FIG. 10). Collectively, these immunolocalization studies indicate that a multiplicity of specialized tight-junctional proteins exhibit expression that is restricted (in normal states) to the interendothelial clefts, and presumably their redundancy and variety ensures that tightly adherent cell-to-cell contacts are maintained at the BBB.
FIG. 10.
Occludin expression in the BBB cortex of a normal rat. The insets depicts a pegylated immunoliposome, illustrated at the same magnification as the capillary profile. Ten-nanometer gold particles are tagged to the polyclonal rabbit antiserum to occludin, which was obtained from Zymed Laboratories Inc., and used at a dilution of 1:500. Similar to the pattern seen in Figure 8, occludin-immunoreactive epitopes are expressed intermittently along the length of the interendothelial junction, and no reactivity is apparent at any other BBB domain. A targeting antibody [e.g., rat antiserum to the mouse BBB transferrin receptor, TfR; or in control immunoliposomes (inset), normal murine IgG] is bound to the tips of the polyethylene glycol strands covering the immunoliposome, which is identified with goat antimouse 20-nm immunogold particles (Ted Pella Inc., Redding, CA). This illustration also compares the dimensions of this receptor-mediated drug delivery system with that of the biological barrier to the CNS. The PIL (depicted in the inset) ranges from 70-100 nm in diameter, and its path of transcytosis through the capillary endothelial cell varies from 200-450 nm in thickness. In contrast, the average molecular mass of a typical CNS drug is 357 Da, and would be smaller than a 1-nm gold particle. Even when comparing the relative sizes of the 10 nm-gold labeled occludin epitopes to that of the PIL nanocontainer, this difference would significantly underestimate the increment in BBB large-molecule drug delivery that is achieved with molecular Trojan horse86 technology. RBC = red blood cell.
In the absence of an interendothelial route for BBB drug delivery, novel intraendothelial delivery mechanisms that use receptor-mediated transcytosis (RMT) pathways have been recently developed.86 Ligands that are transported via the RMT pathways act as molecular Trojan horses (MTH) to ferry across the BBB any attached drug. The MTH may also be tethered to the surface of pegylated immunoliposomes (PILs) for nonviral gene transfer to the brain. The inset in Figure 10 (taken at the same magnification as the capillary) shows one of these liposomes, and illustrates the relative dimensions of this nonviral drug delivery system in comparison the BBB. The occludin-reactive sites within the BBB interendothelial junctions are identified by 10-nm immunogold particles, whereas the targeting antibody (e.g., to the transferrin receptor, TfR), which is attached to polyethylene glycol strands on the liposome, are identified by 20-nm immunogold particles. The immunoliposome is typically about 70–100 nm in diameter, and this nanocontainer must undergo endothelial transcytosis. The intracellular path (i.e., the endothelial cell thickness) can range from 240 ± 50 nm in the cortex of control rats87 to 500 ± 220 nm in the suckling rabbit.17 These parameters are similar in humans where the endothelial thickness ranges from 370 ± 170 nm (in near-normal resected tissue) to 420 ± 110 nm in pathological specimens.2 After exocytosis at the abluminal membrane, the liposome must traverse the basal lamina and undergo receptor-mediated endocytosis within the neuropil to deliver the intact liposomal cargo to the CNS. Given the relative sizes of the immunoliposome and endothelium, it seems highly likely that brain access is facilitated by molecular mechanisms involving caveolin-1- (FIGS. 6 and 7), or clathrin-mediated transcytosis. The liposome is synthesized with multiple MTHs on the distal ends of the polyethylene glycol strands that coat the immunoliposome (illustrated by the 20-nm gold particles in the inset of FIG. 10). One or more of these targeting antibodies must presumably bind to the BBB receptor proteins, in order for caveolae to participate in the transcytosis of such a large nanocontainer.88
POLARIZATION AT THE GLIAL END-FOOT PROCESS
In close proximity to the abluminal endothelial membrane, and just external to the basal lamina, the microvascular-facing membranes of the glial end foot processes are also highly polarized in situ.5 For example, localized glutamine in the foot process is seen in osmotic stress89 and tight-junctional structures linking adjacent end-foot processes90 contribute to the pericapillary polarization. The gap junction protein, connexin-43 or Cx43, is highly expressed at the microvascular surface of these interconnecting end-foot processes. Lucifer yellow diffusion occurs via these gap junctions, localized to the pericapillary face of the end foot process. The purinergic receptors, P2Y(2) and P2Y(4), are also highly expressed around the perivascular end foot processes, where they colocalize with GFAP and form a center for purinergic signaling and participate in glial-endothelial regulatory functions.5 In addition, water channel and monocarboxylate transporter activity is also seen in pericapillary glial membranes.91 In sharp contrast, the glial cell expression of GFAP is not polarized to the foot process membranes in contact with the basal laminae, but instead it is more uniformly expressed in astrocytes throughout the neuropil (FIG. 2).
PERICAPILLARY GLIAL MCT2 TRANSPORTER
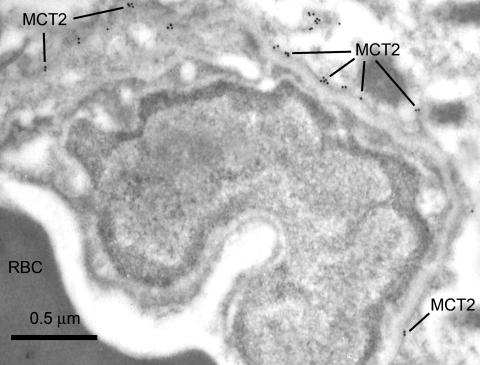
Monocarboxylic acid transporters are important to brain function because they mediate the transport of lactate, pyruvate, and other substrates such as ketone bodies. Three monocarboxylic acid transporters (MCT1, MCT2, and MCT4) are found in brain.92 Immunogold electron microscopic studies have shown different domain localizations throughout the entire brain for these isoforms.91–94 Within the neuropil, MCT2 is coexpressed with the δ-2 glutamate receptor, and alternate labeling patterns are seen with different antisera.95 However, within the cells of the BBB, MCT1 is highly expressed in the endothelia, and increased abluminal expression of MCT1 is seen in ketonemia.32,40 In contrast, MCT2 apparently localizes to the pericapillary glial foot membranes91,94 as shown in Figure 11. Two other characteristics of MCT2 expression are also noteworthy. Firstly, it appears to be absent from brain capillary endothelial cells, as seen in Figure 11. And secondly, MCT2 is the only monocarboxylate transporter that has been found in neurons.92,95
FIG. 11.
MCT2 expression in the mouse brain. The MCT2 chicken antiserum was obtained from Chemicon and was used at a dilution of 1:1000. In the mouse BBB capillaries, MCT2 expression was apparent localized externally to the basal laminae, and enriched along the membranes of the glial foot process that border on the microvasculature. No MCT2 expression was apparent within the capillary endothelial cells.
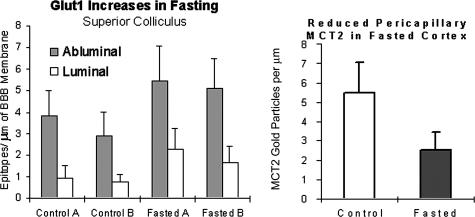
In ketonemic rats, Leino et al.40 observed BBB upregulation of both endothelial MCT1 and endothelial GLUT1. Our studies confirm a similar upregulation of endothelial GLUT1 expression in cortex (not shown) and in the superior colliculi of fasted mice (FIG. 12). However, pericapillary MCT2 expression was ∼50% downregulated in these mice (FIG. 12). In response to a single physiological change, these two different MCT transporter isoforms undergo shifts in expression which are opposite in direction. The same pattern is seen in neonates, where increased MCT132 occurs concomitantly with decreased MCT2 expression.91 These studies suggest that within the confines of the BBB, there are different functional roles for the endothelial MCT1 versus the pericapillary-glial MCT2 isoforms.
FIG. 12.
Fasting-induced alterations in BBB GLUT1 expression are in the opposite direction to the alterations in pericapillary glial end-foot MCT2 expression. As shown before, increased GLUT1 expression was seen. We observed this in the (frontal cortex, hippocampus, not shown, and) superior colliculus. Furthermore, overnight fasting decreased astrocyte monocarboxylic acid transporter (MCT2) expression in mice. Pericapillary and brain parenchymal MCT2 expression was reduced in fasted mice (right panel), whereas GLUT1 is upregulated (left panel). (Vertical bars = 1 SD.)
PERICAPILLARY GLIAL AQP4 TRANSPORTER
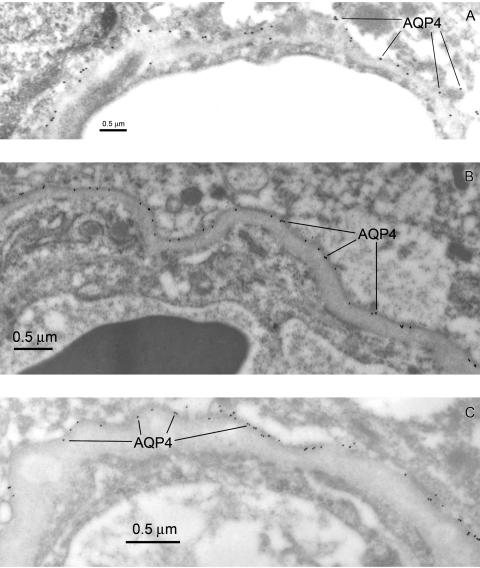
Membrane proteins belonging to the family of aquaporins are known to mediate rapid water transport across cell membranes. The predominant aquaporin in brain is AQP4,96 and even though it is absent in brain capillaries97 several studies suggest that AQP4 mediates water influx during brain edema formation. For example, the extent of brain edema after an experimental stroke is reduced in AQP4 knockout animals.98 AQP4 is highly expressed in brain astrocytes, and the distribution of this water channel protein across the astrocyte cell surface is unequal. Immunocytochemical studies indicate that AQP4 expression is normally detectable only in those membrane areas that are in contact with pial or perivascular basal laminae,99 and several independent studies have confirmed this with high resolution electron microscopy.62,96,97,100,101
In rats87 and mice (FIG. 13A), AQP4 is highly expressed at the astroglial membrane where it comes in contact with the basal lamina. Similarly enriched AQP4 expression in the glial foot process is seen in tissue resected from the area of a traumatic (human) brain injury (FIG. 13B), and the absence of endothelial AQP4 expression is readily apparent. We also examined AQP4 expression in a glioma resection (tissue adjacent to an astrocytoma) and confirmed the high expression of this water channel protein at the glial foot process membranes surrounding the capillaries (FIG. 13C). Within the basal laminae an extracellular heparan sulfate proteoglycan, agrin, is found, and it is believed that agrin is necessary for the polarized distribution of AQP4 in the astrocyte.99 In glioblastoma cells, AQP4 is redistributed away from the astrocyte membranes facing the basal laminae, and unlike the normal situation, the water channel protein now completely covers the parenchymal glial surfaces. These parenchymal membranes normally do not show AQP4 expression. After studying these changes in gliomas, it was concluded that agrin is necessary for the polarized distribution of AQP4 to the pericapillary glial membranes.99
FIG. 13.
Aquaporin-4 expression compared in the mouse BBB (A), and human brain resections (B and C). The AQP4 rabbit polyclonal immunosera were obtained from Sigma and used at a dilution of 1:500. Note that in the mouse brain (A) the AQP4 epitopes are almost all at the glial cell membrane adjacent to the basal lamina. We observed less than 2% of the AQP4 immunoreactive epitopes could be assigned to an abluminal endothelial domain in the mouse. In human brain taken from an acute pathology (traumatic injury) AQP4 is expressed at the astrocyte membranes of the glial foot process that face the microvasculature (B). AQP4 expression is also seen on astrocyte membranes of the pia (not shown). In tumor-adjacent tissue taken an astrocytoma resection, where the basal lamina has become quite thickened (C), the expression of AQP4 at the astrocyte foot process membranes contacting the basal lamina is further confirmed. In EM immunogold examination of more than 30 different resections, we found no evidence for AQP4 expression within the endothelial cell domains of the human BBB.
A recent report suggests that endothelial AQP4 can be seen in α-syntrophin knockout mice, and that endothelial expression may be seen in these mice when the water channel protein is lost from the adjacent membrane of the glial foot process.98 These authors further indicated that endothelial AQP4 expression was quite low and suggested that it had escaped detection in previous studies101 for this reason. In our preliminary examination of mice, we observed less than 2% of the immunogold epitopes associated with the endothelial cell, and these were invariably at the abluminal border (see FIG. 13A). It is not known whether this phenomenon is a specific characteristic of the mouse or not. Another consideration is the antiserum used to identify AQP4 epitopes. The endothelial AQP4 was identified with an antiserum to the C-terminal 17 amino acids.98 We have observed that a C-terminal AQP4 antibody (obtained from Chemicon, Temecula, CA) identified only a small number of AQP4 epitopes when used at 1:15 dilutions (not shown). In contrast, the antibody to a 75-amino acid sequence of the AQP4 protein (Sigma, St. Louis, MO) readily identified AQP4 epitopes (at dilutions of 1:500) in a variety of different tissues (FIG. 13). We have not observed any evidence for endothelial AQP4 in examinations of rat (not shown), human seizure resections (not shown), traumatic brain injury (FIG. 13B), or astrocytoma resections (FIG. 13C), and further quantitative digital analyses of AQP4 density within the capillary and pericapillary domains will resolve this issue.
CONCLUSIONS
Available information suggests that any attempts to modify paracellular transport pathways are unlikely to succeed because of the variety of tight-junctional proteins found at interendothelial BBB junctions. These different proteins impart a redundancy of function and ensure adhesion of the cell-to-cell contacts. Within the context of targeting pharmaceuticals across the BBB, the primary objective of the present work is to emphasize that the precise location, or BBB domain, is still not known for many potential BBB delivery targets. Furthermore, studies employing a variety of pathophysiological conditions have conclusively demonstrated that not only up- and downregulation, but significant domain redistribution of endothelial membrane proteins can occur. This is exemplified by the abluminal-luminal shifts seen for the GLUT1 glucose transporter protein and suggests that regulation is a combination of both abluminal-luminal membrane translocation as well as synthesis of transporter proteins. In insulin activation of fat and muscle cells, the GLUT4 glucose transporter is known to recycle from the cytoplasm to cell membrane,102–104 but in the BBB (where the GLUT1 protein is insulin insensitive), there is no evidence for this cytoplasm-to-membrane recycling mechanism. One of the great challenges in BBB drug delivery research is to define the cellular mechanisms that regulate luminal and abluminal expression of receptor transporter proteins, an area that is poorly understood at this time. Another point worthy of emphasis, is that even though luminal or abluminal membrane enrichment is reported for a variety of proteins (Table 1), the specific BBB domain for many recently identified proteins is either tentatively predicted, or controversial. For many transporters and receptors, their luminal membrane, abluminal membrane, or glial foot process locations have not yet been confirmed with high-resolution electron microscopic methods.
Recent studies have contributed a significant body of information regarding the variety of efflux transporters which are operative at the BBB (as emphasized elsewhere in this theme issue). In designing novel BBB gene therapeutics, it will become essential to first identify with certainty, the precise intracellular locations of these transporters. Efflux of water has been shown via the AQP4 transporter localized to the glial cell membranes surrounding the BBB.101 This work emphasizes that polarization of the pericapillary glial cell may be attributable in part to the presence of astrocytic efflux mechanisms, located on the cell membranes which contact the basal laminae. Hepatic MCT2 is associated with the bidirectional transport of hippurate,105 suggesting that other proteins associated with efflux mechanisms may exhibit astrocyte-foot-process enrichment. Such a division of function would posit BBB influx mechanisms are more prominent in BBB endothelial cell domains, and the proteins that are highly expressed in the astrocytic foot processes may make greater contributions to BBB efflux than previously recognized.
In relation to drug delivery, if a target protein (such as an efflux transporter) has an endothelial cell domain, then target-manipulation with a gene therapeutic that utilizes the GLUT1 promoter (for example) would be effective within the endothelial cell of the BBB; however, its expression would not be promoted within the glial foot process. Likewise, if the target is expressed at the end-foot process of an astrocyte, a gene therapeutic that utilizes the GFAP promoter would result in expression within the glial foot process, with no expression in BBB endothelial cells. Consequently, it will be essential to determine if specific targets are situated internally or externally to the capillary basal laminae, to effectively promote gene therapeutic modifications of BBB function. Even though the basal lamina is only a few hundred nanometers in thickness, EM confirmation of capillary versus glial domains will be play an integral role in the success of molecular therapies and their delivery to targets beyond the BBB. Quantitative immunogold electron microscopy has already enhanced our understanding of brain capillary biology and will continue to make contributions to domain identification of novel targets, especially those which may participate in receptor-mediated transcytosis and BBB delivery of neurotherapeutics.
Acknowledgments
We thank Dr. Marcia E. Cornford for critically reading this manuscript. We also thank Birgitta Sjostrand for assistance with the electron microscope, and Dan Cornford for preparation of the figures. These studies were supported by National Institutes of Health Grants NS48080 and NS37360.
REFERENCES
- 1.Orte C, Lawrenson JG, Finn TM, Reid AR, Allt G. A comparison of blood-brain barrier and blood-nerve barrier endothelial cell markers. Anat Embryol (Berl) 199: 509–517, 1999. [DOI] [PubMed] [Google Scholar]
- 2.Cornford EM, Hyman S, Cornford ME, Landaw EM, Delgado-Escueta AV. Interictal seizure resections show two configurations of endothelial Glut1 glucose transporter in the human blood-brain barrier. J Cereb Blood Flow Metab 18: 26–42, 1998. [DOI] [PubMed] [Google Scholar]
- 3.Hellstrom M, Gerhardt H, Kalen M, Li X, Eriksson U, Wolburg H, Betsholtz C. Lack of pericytes leads to endothelial hyperplasia and abnormal vascular morphogenesis. J Cell Biol 153: 543–553, 2001. [DOI] [PMC free article] [PubMed] [Google Scholar]
- 4.Liwnicz BH, Leach JL, Yeh HS, Privitera M. Pericyte degeneration and thickening of basement membranes of cerebral microvessels in complex partial seizures electron microscopic study of surgically removed tissue. Neurosurgery 26: 409–420, 1990. [DOI] [PubMed] [Google Scholar]
- 5.Simard M, Arcuino G, Takano T, Liu QS, Nedergaard M. Signaling at the gliovascular interface. J Neurosci 23: 9254–9262, 2003. [DOI] [PMC free article] [PubMed] [Google Scholar]
- 6.del Zoppo GJ, Hallenbeck JM. Advances in the vascular pathophysiology of ischemic stroke. Thromb Res 98: 73–81, 2000. [DOI] [PubMed] [Google Scholar]
- 7.Stewart PA, Beliveau R, Rogers KA. Cellular localization of P-glycoprotein in brain versus gonadal capillaries. J Histochem Cytochem 44: 679–685, 1996. [DOI] [PubMed] [Google Scholar]
- 8.Tetsuka K, Takanaga H, Ohtsuki S, Hosoya K, Terasaki T. The l-isomer-selective transport of aspartic acid is mediated by ASCT2 at the blood-brain barrier. J Neurochem 87: 891–901, 2003. [DOI] [PubMed] [Google Scholar]
- 9.Dobrogowska DH, Vorbrodt AW. Quantitative immunocytochemical study of blood-brain barrier glucose transporter (GLUT-1) in four regions of mouse brain. J Histochem Cytochem 47: 1021–1030, 1999. [DOI] [PubMed] [Google Scholar]
- 10.Vorbrodt AW, Dobrogowska DH, Meeker HC, Carp RI. Immunogold study of regional differences in the distribution of glucose transporter (GLUT-1) in mouse brain associated with physiological and accelerated aging and scrapie infection. J Neurocytol 28: 711–719, 1999. [DOI] [PubMed] [Google Scholar]
- 11.Vorbrodt AW, Dobrogowska DH, Tarnawski M, Meeker HC, Carp RI. Quantitative immunogold study of glucose transporter (GLUT-1) in five brain regions of scrapie-infected mice showing obesity and reduced glucose tolerance. Acta Neuropathol (Berl) 102: 278–284, 2001. [DOI] [PubMed] [Google Scholar]
- 12.Cornford EM, Hyman S, Cornford ME, Damian RT, Raleigh MJ. A single glucose transporter configuration in normal primate brain endothelium comparison with resected human brain. J Neuropathol Exp Neurol 57: 699–713, 1998. [DOI] [PubMed] [Google Scholar]
- 13.Cornford EM, Hyman S, Cornford ME. Immunogold detection of microvascular proteins in the compromised blood-brain barrier. Methods Mol Med 89: 161–175, 2003. [DOI] [PubMed] [Google Scholar]
- 14.Meuckler M. Facilitative glucose transporters. Eur J Biochem 219: 713–725, 1994. [DOI] [PubMed] [Google Scholar]
- 15.Cornford EM, Hyman S, Swartz BE. The human brain GLUT1 glucose transporter: ultrastructural localization to the blood-brain barrier endothelia. J Cereb Blood Flow Metab 14: 106–112, 1994. [DOI] [PubMed] [Google Scholar]
- 16.Cornford EM, Hyman S, Cornford ME, Caron MJ. Glut1 glucose transporter activity in human brain injury. J Neurotrauma 13: 523–536, 1996. [DOI] [PubMed] [Google Scholar]
- 17.Cornford EM, Hyman S, Pardridge WM. An electron microscopic immunogold analysis of developmental up-regulation of the blood-brain barrier GLUT1 glucose transporter. J Cereb Blood Flow Metab 13: 841–854, 1993. [DOI] [PubMed] [Google Scholar]
- 18.Cornford EM, Hyman S, Landaw EM. Developmental modulation of blood-brain-barrier glucose transport in the rabbit. Brain Res 663: 7–18, 1994. [DOI] [PubMed] [Google Scholar]
- 19.Dwyer KJ, Pardridge WM. Developmental modulation of blood-brain barrier and choroid plexus GLUT1 glucose transporter messenger ribonucleic acid and immunoreactive protein in rabbits. Endocrinology 132: 558–565, 1993. [DOI] [PubMed] [Google Scholar]
- 20.Betz AL, Goldstein GW. Polarity of the blood-brain barrier neutral amino acid transport into isolated brain capillaries. Science 202: 225–227, 1978. [DOI] [PubMed] [Google Scholar]
- 21.Betz AL, Firth JA, Goldstein GW. Polarity of the blood-brain barrier distribution of enzymes between the luminal and antiluminal membranes of brain capillary endothelial cells. Brain Res 192: 17–28, 1980. [DOI] [PubMed] [Google Scholar]
- 22.Ghandour MS, Langley OK, Varga V. Immunohistological localization of γ-glutamyltranspeptidase in cerebellum at light and electron microscope levels. Neurosci Lett 20: 125–129, 1980. [DOI] [PubMed] [Google Scholar]
- 23.Vorbrodt AW, Lossinsky AS, Wisniewski HM, Moretz RC, Iwanowski L. Ultrastructural cytochemical studies of cerebral microvasculature in scrapie infected mice. Acta Neuropathol (Berl) 53: 203–211, 1981. [DOI] [PubMed] [Google Scholar]
- 24.Betz AL. Sodium transport in capillaries isolated from rat brain. J Neurochem 41: 1150–1157, 1983. [DOI] [PubMed] [Google Scholar]
- 25.Maeda T, Nishiyama F, Ogashiwa M, Takeuchi K, Hirano H. Phosphatase activities in human glioma cells as revealed by light and electron microscopy—a preliminary study. J Neurooncol 3: 211–216, 1985. [DOI] [PubMed] [Google Scholar]
- 26.Pardridge WM, Boado RJ, Farrell CR Brain-type glucose transporter (GLUT1) is selectively localized to the blood-brain barrier. J Biol Chem 285: 18035–18040, 1990. [PubMed] [Google Scholar]
- 27.Bickel U, Kang YS, Yoshikawa T, Pardridge WM. In vivo demonstration of subcellular localization of anti-transferrin receptor monoclonal antibody-colloidal gold conjugate in brain capillary endothelium. J Histochem Cytochem 42: 1493–1497, 1994. [DOI] [PubMed] [Google Scholar]
- 28.Beaulieu E, Demeule M, Ghitescu L, Beliveau R. P-glycoprotein is strongly expressed in the luminal membranes of the endothelium of blood vessels in the brain. Biochem J 326: 539–544, 1997. [DOI] [PMC free article] [PubMed] [Google Scholar]
- 29.Demeule M, Jodin J, Gingras D, Beliveau R. P-glycoprotein is localized in caveolae in resistant cells and in brain capillaries. FEBS Lett 466: 219–224, 2000. [DOI] [PubMed] [Google Scholar]
- 30.Pardridge WM, Golden PL, Kang YS, Bickel U. Brain microvascular and astrocyte localization of P-glycoprotein. J Neurochem 68: 1278–1285, 1997. [DOI] [PubMed] [Google Scholar]
- 31.Golden PL, Pardridge WM. Brain microvascular P-glycoprotein and a revised model of multidrug resistance in brain. Cell Mol Neurobiol 20: 165–181, 2000. [DOI] [PubMed] [Google Scholar]
- 32.Leino RL, Gerhart DZ, Drewes LR. Monocarboxylate transporter (MCT1) abundance in brains of suckling and adult rats a quantitative electron microscopic immunogold study. Brain Res Dev Brain Res 113: 47–54, 1999. [DOI] [PubMed] [Google Scholar]
- 33.Lossinsky AS, Buttle KF, Pluta R, Mossakowski MJ, Wicniewski HM. Immunoultrastructural expression of intercellular adhesion molecule-1 in endothelial cell vesiculotubular structures and vesiculovalvular organelles in blood-brain barrier development and injury. Cell Tissue Res 295: 77–88, 1999. [DOI] [PubMed] [Google Scholar]
- 34.Lippoldt A, Kniesel U, Liebner S, Kalbacher H, Kirsh T, Wolburg H, Haller H. Structural alterations of tight junctions are associated with loss of polarity in stroke-prone spontaneously hypertensive rat blood-brain barrier endothelial cells. Brain Res 885: 251–261, 2000. [DOI] [PubMed] [Google Scholar]
- 35.Manoonkitiwongsa PS, Whitter EF, Wareesangtip W, McMillan PJ, Nava PB, Schultz RL. Calcium-dependent ATPase unlike ecto-ATPase is located primarily on the luminal surface of brain endothelial cells. Histochem J 32: 313–324, 2000. [DOI] [PubMed] [Google Scholar]
- 36.Manoonkitiwongsa PS, Schultz RL, Wareesangtip W, Whitter EF, Nava PB, McMillan PJ. Luminal localization of blood-brain barrier sodium, potassium adenosine triphosphatase is dependent on fixation. Histochem Cytochem 48: 859–865, 2000. [DOI] [PubMed] [Google Scholar]
- 37.Edmond J. Essential polyunsaturated fatty acids and the barrier to the brain: the components of a model for transport. J Mol Neurosci 16: 181–193, 2001 [DOI] [PubMed] [Google Scholar]
- 38.Zhang Y, Pardridge WM. Mediated influx of IgG molecules from brain to blood across the blood-brain barrier. J Neuroimmunol 114: 168–172, 2001. [DOI] [PubMed] [Google Scholar]
- 39.Schlachetzki F, Zhu C, Pardridge WM. Expression of the neonatal Fc receptor (FcRn) at the blood-brain barrier. J Neurochem 81: 203–206, 2002. [DOI] [PubMed] [Google Scholar]
- 40.Leino RL, Gerhart DZ, Duelli R, Enerson BE, Drewes LR. Diet induced ketosis increases monocarboxylate transporter (MCT1) levels in rat brain. Neurochem Int 38: 519–527, 2001. [DOI] [PubMed] [Google Scholar]
- 41.Hawkins RA, Peterson DR, Vina JR. The complementary membranes forming the blood-brain barrier. IUBMB Life 54: 101–107, 2002. [DOI] [PubMed] [Google Scholar]
- 42.Deguchi Y, Okutsu H, Okura T, Yamada S, Kimura R, Yuge T, Furukawa A, Morimoto K, Tachikawa M, Ohtsuki S, Hosoya K, Terasaki T. Internalization of basic fibroblast growth factor at the mouse blood-brain barrier involves perlecan, a heparan sulfate proteoglycan. J Neurochem 83: 381–389, 2002. [DOI] [PubMed] [Google Scholar]
- 43.Mori S, Takanaga H, Ohtsuki S, Deguchi T, Kang YS, Hosoya K, Terasaki T. Rat organic anion transporter 3 (rOAT3) is responsible for brain-to-blood efflux of homovanillic acid at the abluminal membrane of brain capillary endothelial cells. J Cereb Blood Flow Metab 23: 432–440, 2003. [DOI] [PubMed] [Google Scholar]
- 44.Eid T, Brines ML, Cerami A, Spencer DD, Kim JH, Schweitzer JS, Ottersen OP, de Lanerolle NC. Increased expression of erythropoietin receptor on blood vessels in the human epileptogenic hippocampus with sclerosis. J Neuropathol Exp Neurol 63: 73–83, 2004. [DOI] [PubMed] [Google Scholar]
- 45.Elfeber K, Kohler A, Lutzenburg M, Osswald C, Galla HJ, Witte OW, Koepsell H. Localization of the Na(+)-d-glucose cotransporter SGLT1 in the blood-brain barrier. Histochem Cell Biol 121: 201–207, 2004. [DOI] [PubMed] [Google Scholar]
- 46.Sanchez del Pino MM, Hawkins RA, Peterson DR. Biochemical discrimination between luminal and abluminal enzyme and transport activities of the blood-brain barrier. J Biol Chem 270: 14907–14912, 1995. [DOI] [PubMed] [Google Scholar]
- 47.Sanchez del Pino MM, Peterson DR, Hawkins RA. Neutral amino acid transport characterization of isolated luminal and abluminal membranes of the blood-brain barrier. J Biol Chem 270: 14913–14918, 1995. [DOI] [PubMed] [Google Scholar]
- 48.Cremer JE, Seville MP, Cunningham VJ. Tracer 2-deoxyglucose kinetics in brain regions of rats given kainic acid. J Cereb Blood Flow Metab 8: 244–253, 1988. [DOI] [PubMed] [Google Scholar]
- 49.Pappenheimer JR, Setchell BP. Cerebral glucose transport and oxygen consumption in sheep and rabbits. J Physiol (Lond) 233: 529–551, 1973. [DOI] [PMC free article] [PubMed] [Google Scholar]
- 50.Gjedde A, Christensen O. Estimates of Michaelis-Menten constants for the two membranes of the brain endothelium. J Cereb Blood Flow Metab 4: 241–249, 1984. [DOI] [PubMed] [Google Scholar]
- 51.Cunningham VJ, Hargreaves RJ, Pelling D, Moorhouse SR. Regional blood-brain glucose transfer in the rat a novel double-membrane kinetic analysis. J Cereb Blood Flow Metab 6: 305–314, 1986. [DOI] [PubMed] [Google Scholar]
- 52.Pardridge WM, Oldendorf WH. Kinetics of blood-brain barrier transport of hexoses. Biochim Biophys Acta 382: 377–392, 1975. [DOI] [PubMed] [Google Scholar]
- 53.Hargreaves RJ, Planas AM, Cremer JE, Cunningham VJ. Studies on the relationship between cerebral glucose transport and phosphorylation using 2-deoxyglucose. J Cereb Blood Flow Metab 6: 708–716, 1986. [DOI] [PubMed] [Google Scholar]
- 54.Gerhart DZ, LeVasseur RJ, Broderius MA, Drewes LR. Glucose transporter localization in brain using light and electron immunocytochemistry. J Neurosci Res 22: 464–472, 1989. [DOI] [PubMed] [Google Scholar]
- 55.Dermietzel R, Krause D, Kremer M, Wang C, Stevenson B. Pattern of glucose transporter (Glut 1) expression in embryonic brains is related to maturation of blood-brain barrier tightness. Dev Dyn 192: 152–163, 1992. [DOI] [PubMed] [Google Scholar]
- 56.Farrell CL, Pardridge WM. Blood-brain barrier glucose transporter is asymmetrically distributed on brain capillary endothelial lumenal and ablumenal membranes an electron microscopic immunogold study. Proc Natl Acad Sci USA 88: 5779–5783, 1991. [DOI] [PMC free article] [PubMed] [Google Scholar]
- 57.Bolz S, Farrell CL, Dietz K, Wolburg H. Subcellular distribution of glucose transporter (GLUT1) during development of the blood brain barrier in rats. Cell Tissue Res 284: 355–365, 1996. [DOI] [PubMed] [Google Scholar]
- 58.Fischbarg J, Kuang KY, Hirsch J, Lecuona S, Rogozuiaski L, Silverstein SC. Evidence that the glucose transporter serves as a water channel. Proc Natl Acad Sci USA 86: 8397–8401, 1989. [DOI] [PMC free article] [PubMed] [Google Scholar]
- 59.Fischbarg J, Kuang KY, Vera JC, Arant S, Silverstein SC, Loike J, Rosen OM. Glucose transporters serve as water channels. Proc Natl Acad Sci USA 87: 3244–3247, 1990. [DOI] [PMC free article] [PubMed] [Google Scholar]
- 60.Loike JD, Cao L, Kuang K, Vera JC, Silverstein SC, Fischbarg J. Role of facilitative glucose transporters in diffusional water permeability through J744 cells. J Gen Physiol 102: 897–906, 1993. [DOI] [PMC free article] [PubMed] [Google Scholar]
- 61.Fischbarg J, Vera JC. Multifunctional transporter models: lesson from the transport of water sugars and ring compounds by GLUTs. Am J Physiol (Lond) 268: C1077–C1089, 1995.7539214 [Google Scholar]
- 62.Wen H, Nagelhus EA, Amiry-Moghaddam M, Agre P, Ottersen OP, Nielsen S. Ontogeny of water transport in rat brain: postnatal expression of the aquaporin-4 water channel. Eur J Neurosci 11: 935–945, 1999. [DOI] [PubMed] [Google Scholar]
- 63.Loo DDF, Zeuthen T, Chandy G, Wright EM. Cotransport of water by the Na+/glucose cotransport cotransporter. Proc Natl Acad Sci USA 93: 13367–13370, 1996. [DOI] [PMC free article] [PubMed] [Google Scholar]
- 64.Zhang R, Alper SL, Thorens B, Verkman AS. Evidence from oocyte expression that the erythrocyte water channel is distinct from band 3 and the glucose transporter. J Clin Invest 88: 1553–1558, 1991. [DOI] [PMC free article] [PubMed] [Google Scholar]
- 65.Kumagai AK, Vinores SA, Pardridge WM. Pathological upregulation of inner blood-retinal barrier Glut1 glucose transporter expression in diabetes mellitus. Brain Res 706: 313–317, 1996. [DOI] [PubMed] [Google Scholar]
- 66.Hirsch JR, Loo DDF, Wright EM. Regulation of Na+/glucose cotransporter expression by protein kinases in Xenopus laevis oocytes. J Biol Chem 25: 14740–14746, 1996. [DOI] [PubMed] [Google Scholar]
- 67.Kellett GL. The facilitated component of intestinal glucose absorption. J Physiol (Lond) 531: 585–595, 2001. [DOI] [PMC free article] [PubMed] [Google Scholar]
- 68.Sone H, Deo BK, Kumagai AK. Enhancement of glucose transport by vascular endothelial growth factor in retinal endothelial cells. Invest Ophthamol Vis Sci 41: 1876–1884, 2000. [PubMed] [Google Scholar]
- 69.DeBosch BJ, Baur E, Deo BK, Hiraoka M, Kumagai AK. Effects of insulin-like growth factor-1 on retinal endothelial cell glucose transport and proliferation. J Neurochem 77: 1157–1167, 2001. [DOI] [PubMed] [Google Scholar]
- 70.Nose A, Mori Y, Uchiyama-Tanaka Y, Kishimoto N, Maruyama K, Matsubara H, Iwasaka T. Regulation of glucose transporter (GLUT1) gene expression by angiotensin II in mesangial cells involvement of HB-EGF and EGF receptor transactivation. Hypertens Res 26: 67–73, 2003. [DOI] [PubMed] [Google Scholar]
- 71.Houdali B, Nguyen V, Ammon HP, Haap M, Schechinger W, Machicao F, Rett K, Haring HU, Schleicher ED. Prolonged glucose infusion into conscious rats inhibits early steps in insulin signalling and induces translocation of GLUT4 and protein kinase C in skeletal muscle. Diabetologia 45: 356–368, 2002. [DOI] [PubMed] [Google Scholar]
- 72.Braiman L, Alt A, Kuroki T, Ohba M, Bak A, Tennenbaum T, Sampson SR. Activation of protein kinase C ζ induces serine phosphorylation of VAMP2 in the GLUT4 compartment and increases glucose transport in skeletal muscle. Mol Cell Biol 21: 7852–7861, 2001. [DOI] [PMC free article] [PubMed] [Google Scholar]
- 73.Condorelli G, Vigliotta G, Trencia A, Maitan MA, Caruso M, Miele C, Oriente F, Santopietro S, Formisano P, Beguinot F. Protein kinase C (PKC)-α activation inhibits PKC-ζ and mediates the action of PED/PEA-15 on glucose transport in the L6 muscle cells. Diabetes 50: 1244–1252, 2001. [DOI] [PubMed] [Google Scholar]
- 74.Walaas O, Horn RS, Walaas SI. The protein kinase C pseudosubstrate peptide (PKC19–36) inhibits insulin-stimulated protein kinase activity and translocation of the glucose transporter glut4 in streptolysin-O permeabilized adipocytes. FEBS Lett 413: 152–156, 1997. [DOI] [PubMed] [Google Scholar]
- 75.Perrini S, Natalicchio A, Laviola L, Belsanti G, Montrone C, Cignarelli A, Minielli V, Grano M, De Pergola G, Giorgino R, Giorgino F. Dehydroepiandrosterone stimulates glucose uptake in human and murine adipocytes by inducing GLUT1 and GLUT4 translocation to the plasma membrane. Diabetes 53: 41–52, 2004. [DOI] [PubMed] [Google Scholar]
- 76.Frank PG, Woodman SE, Park DS, Lisanti MP. Caveolin, caveolae, and endothelial cell function. Arterioscler Thromb Vasc Biol 23: 1161–1168, 2003. [DOI] [PubMed] [Google Scholar]
- 77.Virgintino D, Robertson D, Erreded M, Benagiano V, Tauer U, Roncali L, Bertossi M. Expression of caveolin-1 in human brain microvessels. Neuroscience 115: 145–152, 2002. [DOI] [PubMed] [Google Scholar]
- 78.Schlachetzki F, Pardridge WM. P-glycoprotein and caveolin-1α in endothelium and astrocytes of primate brain. Neuroreport 14: 2041–2046, 2003. [DOI] [PubMed] [Google Scholar]
- 79.Engelman JA, Zhang X, Galbiati F, Volonte D, Sotgia F, Pestell RG, Minetti C, Scherer PE, Okamoto T, Lisanti MP. Molecular genetics of the caveolin gene family implications for human cancers, diabetes, Alzheimer disease, and muscular dystrophy. Am J Hum Genet 63: 1578–1587, 1998. [DOI] [PMC free article] [PubMed] [Google Scholar]
- 80.Coloma MJ, Lee HJ, Kurihara A, Landaw EM, Boado RJ, Morrison SL, Pardridge WM. Transport across the primate blood-brain barrier of a genetically engineered chimeric monoclonal antibody to the human insulin receptor. Pharm Res 17: 266–274, 2000. [DOI] [PubMed] [Google Scholar]
- 81.Nico B, Quondamatteo F, Herken R, Marzullo A, Corsi P, Bertossi M, Russo G, Ribatti D, Roncali L. Developmental expression of ZO-1 antigen in the mouse blood-brain barrier. Brain Res Dev Brain Res 114: 161–169, 1999. [DOI] [PubMed] [Google Scholar]
- 82.Nico B, Frigeri A, Nicchia GP, Corsi P, Ribatti D, Quondamatteo F, Herken R, Girolamo F, Marzullo A, Svelto M, Roncali L. Severe alterations of endothelial and glial cells in the blood-brain barrier of dystrophic mdx mice. Glia 42: 235–251, 2003. [DOI] [PubMed] [Google Scholar]
- 83.Vorbrodt AW, Dobrogowska DH, Tarnawski M. Immunogold study of interendothelial junction-associated and glucose transporter proteins during postnatal maturation of the mouse blood-brain barrier. J Neurocytol 30: 705–716, 2001. [DOI] [PubMed] [Google Scholar]
- 84.Nitta T, Hata M, Gotoh S, Seo Y, Sasaki H, Hashimoto N, Furuse M, Tsukita S. Size-selective loosening of the blood-brain barrier in claudin-5-deficient mice. J Cell Biol 161: 653–660, 2003. [DOI] [PMC free article] [PubMed] [Google Scholar]
- 85.Matter K, Balda MS. Holey barrier claudins and the regulation of brain endothelial permeability. J Cell Biol 161: 459–460, 2003. [DOI] [PMC free article] [PubMed] [Google Scholar]
- 86.Pardridge WM. Drug and gene targeting to the brain with molecular Trojan horses. Nat Rev Drug Discov 1: 131–139, 2002. [DOI] [PubMed] [Google Scholar]
- 87.Hashizume K, Black KL. Increased endothelial vesicular transport correlates with increased blood-tumor barrier permeability induced by bradykinin and leukotriene C4. J Neuropathol Exp Neurol 61: 725–735, 2002. [DOI] [PubMed] [Google Scholar]
- 88.Cornford EM, Cornford ME. New systems for delivery of drugs to the brain in neurological disease. Lancet Neurol 1: 306–315, 2002. [DOI] [PubMed] [Google Scholar]
- 89.Nagelhus EA, Lehmann A, Ottersen OP. Neuronal and glial handling of glutamate and glutamine during hypoosmotic stress a biochemical and quantitative immunocytochemical analysis using the rat cerebellum as a model. Neuroscience 72: 743–755, 1996. [DOI] [PubMed] [Google Scholar]
- 90.Balslev Y, Saunders NR, Mollgard K. Ontogenetic development of diffusional restriction to protein at the pial surface of the rat brain an electron microscopical study. J Neurocytol 26: 133–148, 1997. [DOI] [PubMed] [Google Scholar]
- 91.Gerhart DZ, Enerson BE, Zhdankina OY, Leino RL, Drewes LR. Expression of monocarboxylate transporter MCT2 by rat brain glia. Glia 22: 272–281, 1998. [PubMed] [Google Scholar]
- 92.Rafiki A, Boulland JL, Halestrap AP, Ottersen OP, Bergersen L. Highly differential expression of the monocarboxylate transporters MCT2 and MCT4 in the developing rat brain. Neuroscience 122: 677–688, 2003. [DOI] [PubMed] [Google Scholar]
- 93.Bergersen L, Rafiki A, Ottersen OP. Immunogold cytochemistry identifies specialized membrane domains for monocarboxylate transport in the central nervous system. Neurochem Res 27: 89–96, 2002. [DOI] [PubMed] [Google Scholar]
- 94.Cornford EM, Hyman S. Blood-brain barrier permeability to small and large molecules. Adv Drug Delivery Rev 36: 145–163, 1999. [DOI] [PubMed] [Google Scholar]
- 95.Bergersen L, Waerhaug O, Helm J, Thomas M, Laake P, Davies AJ, Wilson MC, Halestrap AP, Ottersen OP. A novel postsynaptic density protein the monocarboxylate transporter MCT2 is co-localized with δ-glutamate receptors in postsynaptic densities of parallel fiber-Purkinje cell synapses. Exp Brain Res 136: 523–534, 2001. [DOI] [PubMed] [Google Scholar]
- 96.Nielsen S, Nagelhus EA, Amiry-Moghaddam M, Bourque C, Agre P, Ottersen OP. Specialized membrane domains for water transport in glial cells high-resolution immunogold cytochemistry of aquaporin-4 in rat brain. J Neurosci 17: 171–180, 1997. [DOI] [PMC free article] [PubMed] [Google Scholar]
- 97.Rash JE, Yasumura T, Hudson CS, Agre P, Nielsen S. Direct immunogold labeling of aquaporin-4 in square arrays of astrocyte and ependymocyte plasma membranes in rat brain and spinal cord. Proc Natl Acad Sci USA 95: 11981–11986, 1998. [DOI] [PMC free article] [PubMed] [Google Scholar]
- 98.Amiry-Moghaddam M, Xue R, Haug FM, Neely JD, Bhardwaj A, Agre P, Adams ME, Froehner SC, Mori S, Ottersen OP. α-Syntrophin deletion removes the perivascular but not endothelial pool of aquaporin-4 at the blood-brain barrier and delays the development of brain edema in an experimental model of acute hyponatremia. FASEB J 18: 542–544, 2004. [DOI] [PubMed] [Google Scholar]
- 99.Warth A, Kroger S, Wolburg H. Redistribution of Aquaporin-4 in human glioblastoma correlates with loss of agrin immunoreactivity from brain capillary basal laminae. Acta Neuropathol 107: 311–318, 2004. [DOI] [PubMed] [Google Scholar]
- 100.Vajda Z, Promeneur D, Doczi T, Sulyok E, Frokiaer J, Ottersen OP, Nielsen S. Increased Aquaporin-4 immunoreactivity in rat brain in response to systemic hyponatremia. Biochem Biophys Res Commun 270: 495–503, 2000. [DOI] [PubMed] [Google Scholar]
- 101.Amiry-Moghaddam M, Otsuka T, Hurn PD, Traystman RJ, Haug FM, Froehner SC, Adams ME, Neely JD, Agre P, Ottersen OP, Bhardwaj A. An α-syntrophin-dependent pool of AQP4 in astroglial end-feet confers bidirectional water flow between blood and brain. Proc Natl Acad Sci USA 100: 2106–2111, 2003. [DOI] [PMC free article] [PubMed] [Google Scholar]
- 102.Xu Z, Kandror KV. Translocation of small preformed vesicles is responsible for the insulin activation of glucose transport in adipose cells. Evidence from the in vitro reconstitution assay. J Biol Chem 277: 47972–47975, 2002. [DOI] [PubMed] [Google Scholar]
- 103.Lim SN, Bonzelius F, Low SH, Wille H, Weimbs T, Herman GA. Identification of discrete classes of endosome-derived small vesicles as a major cellular pool for recycling membrane proteins. Mol Biol Cell 12: 981–995, 2001. [DOI] [PMC free article] [PubMed] [Google Scholar]
- 104.Uphues I, Kolter T, Goud B, Eckel J. Insulin-induced translocation of the glucose transporter GLUT4 in cardiac muscle studies on the role of small-molecular-mass GTP–binding proteins. Biochem J 301: 177–182, 1994. [DOI] [PMC free article] [PubMed] [Google Scholar]
- 105.Yoshimura T, Schwab AJ, Tao L, Barker F, Pang KS. Hepatic uptake of hippurate: multiple-indicator dilution, perfused rat liver study. Am J Physiol (Lond) 274: G10–G20, 1998. [DOI] [PubMed] [Google Scholar]


