Significance
Alveolar type II (AT2) cells are a stem cell population in the lung contributing to the repair of alveolar damage and the formation of Ras-induced lung adenocarcinoma. Here we show that a critical output of Ras signaling in AT2 cells is inactivation of the ubiquitin ligase COP1, resulting in stabilization of the transcription factor ETV5. Etv5 deficiency markedly reduced mouse lung hyperplasia driven by mutant KrasG12D or lung repair following bleomycin-induced lung injury, indicating that Etv5 contributes to both tumor initiation and lung homeostasis. Deletion of Etv5 from AT2 cells expressing KrasG12D produced a gene and protein signature characteristic of differentiated AT1 cells, suggesting that ETV5 is critical for the maintenance of AT2 cell identity.
Keywords: lung cancer, Ras, Etv5, Cop1
Abstract
Alveolar type II (AT2) cell dysfunction contributes to a number of significant human pathologies including respiratory distress syndrome, lung adenocarcinoma, and debilitating fibrotic diseases, but the critical transcription factors that maintain AT2 cell identity are unknown. Here we show that the E26 transformation-specific (ETS) family transcription factor Etv5 is essential to maintain AT2 cell identity. Deletion of Etv5 from AT2 cells produced gene and protein signatures characteristic of differentiated alveolar type I (AT1) cells. Consistent with a defect in the AT2 stem cell population, Etv5 deficiency markedly reduced recovery following bleomycin-induced lung injury. Lung tumorigenesis driven by mutant KrasG12D was also compromised by Etv5 deficiency. ERK activation downstream of Ras was found to stabilize Etv5 through inactivation of the cullin-RING ubiquitin ligase CRL4COP1/DET1 that targets Etv5 for proteasomal degradation. These findings identify Etv5 as a critical output of Ras signaling in AT2 cells, contributing to both lung homeostasis and tumor initiation.
Alveolar type II (AT2) cells are a stem cell population that self renews and differentiates into alveolar type I (AT1) cells during lung homeostasis or in response to injury (1, 2). They also give rise to lung adenocarcinoma induced by oncogenic Kras (1, 3–5). AT2 cells are derived from bipotent progenitor cells at the sacculation stage (1). In the adult lung, mature AT2 cells also secrete surfactant phospholipids to maintain normal alveolar function. Sustained Kras activity stimulates the self-renewal of AT2 cells, which eventually leads to abnormal tissue growth (1). An AT2 gene-expression signature has been reported (6, 7), but it is unclear how the identity of AT2 cells is specified and maintained.
Given that Ras/MAPK signaling is essential for the self-renewal of AT2 cells and for the initiation of lung adenocarcinoma, identification of the transcription factors that are activated by Ras in AT2 cells is a step toward defining the transcriptional programs underlying AT2 stemness. The PEA3 subgroup of the ETS family of transcription factors, comprised of ETS transcription variants 1, 4, and 5 (Etv1, Etv4, and Etv5) (8), is known to be engaged by Ras/MAPK signaling. Etv4 and Etv5 are expressed in distal lung epithelium during development and are involved in branching morphogenesis and epithelial cell differentiation (9–11). Alveolar epithelial cells in the adult lung also express Etv5 (7, 12), but a critical role for Etv5 in this setting remains elusive.
PEA3 transcription factors are also implicated in tumorigenesis. Overexpression of ETV1 or ETV4 has been linked to prostate cancer (13, 14), and stabilization of ETV1 by mutant, active tyrosine kinase receptor KIT is thought to drive an oncogenic program in gastrointestinal stromal tumors (GIST) (15). ETV1, ETV4, and ETV5 are labile proteins because of their regulation by the ubiquitin–proteasome system. In GIST, ETV1 protein is stabilized by activation of the Ras/MAPK pathway through an unknown mechanism. In prostate cancers, most ETV1 mutants lack the region required for interaction with COP1 (also called “RFWD2”), which is the substrate adapter of the E3 ubiquitin ligase CRL4COP1/DET1. Consequently, these ETV1 mutants escape COP1-mediated ubiquitination and proteasomal degradation (14). These findings suggest that stabilization of PEA3 transcription factors is critical for their oncogenicity.
In addition to ETV1, ETV4, and ETV5, CRL4COP1/DET1 substrates include c-Jun (16), C/EBPα (17), and ETS1/2 (18). COP1 binds to DET1, which in turn engages the DDB1–CUL4A–RBX1 core complex that associates with an E2 ubiquitin-conjugating enzyme (16). Conserved in plants, COP1 represses photomorphogenesis until exposure to light causes COP1 to be excluded from the nucleus and apart from its nuclear substrates (19). In mammals, COP1 controls lung-branching morphogenesis (20) and functions as a tumor suppressor by targeting c-JUN or ETV1 for degradation (14, 21). How vertebrate CRL4COP1/DET1 is regulated is less clear.
Here we show that Etv5 is expressed specifically in AT2 cells and is stabilized when CRL4COP1/DET1 is inhibited by ERK signaling. Genetic deletion of Etv5 in AT2 cells revealed that Etv5 is essential for maintaining AT2 cell identity. As a consequence, Etv5 loss impairs lung recovery from bleomycin-induced damage and lung tumor initiation by oncogenic Kras. Therefore, Etv5 stabilization is a critical output of Ras signaling in AT2 cells and contributes to both lung homeostasis and tumor initiation.
Results
Etv5 Protein Is Expressed in AT2 Cells in Adult Lung.
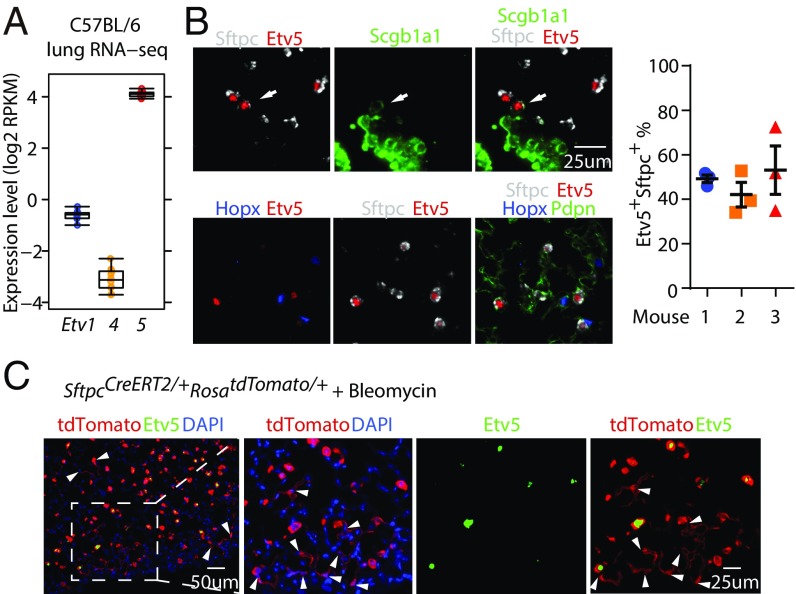
Etv5 mRNA is more abundant than Etv1 or Etv4 mRNA in normal mouse lung (Fig. 1A). Etv5 mRNA has been reported in AT2 cells (1, 7), but mRNA expression does not always correlate with the abundance of labile proteins such as Etv5 (22). By immunostaining, we detected Etv5 protein in a subset of AT2 cells expressing surfactant protein c (Sftpc) and in cells expressing both Sftpc and the secretoglobin Scgb1a1 (Fig. 1B). In contrast, Etv5 was not detected in bronchiole or AT1 cells expressing Hopx1 or Pdpn (Fig. 1B).
Fig. 1.
Expression of Etv5 in AT2 cells in adult lung. (A) Etv1, Etv4, and Etv5 gene expression in C57BL/6 mouse lung (n = 10). (B, Left) Immunostaining of wild-type mouse lung. The arrow indicates a Sftpc+Scgb1a1+Etv5+ cell. (Right) Percentage of Sftpc+Etv5+cells in total Sftpc+ cells counted in three wild-type mice. Data are shown as mean ± SEM. (C) SftpcCreERT2/+RosatdTomato/+ lung after dosing with tamoxifen for 5 d and then s.c. dosing with bleomycin for 1 wk. Arrowheads point to the nuclei of AT2-derived AT1 cells.
The differentiation of AT2 cells into the AT1 cells that mediate pulmonary gas exchange is critical for replacing damaged AT1 cells after lung injury. To evaluate AT2 cell differentiation following bleomycin-induced lung injury, we performed lineage tracing using SftpcCreERT2RosatdTomato mice that exclusively express tdTomato in their Sftpc+ AT2 cells (23, 24). We identified tdTomato+ AT1 cells that were derived from AT2 cells based on their elongated, flattened cell morphology, but they did not express Etv5 (Fig. 1C). Therefore, Etv5 expression is a defining feature of AT2 cell identity in both lung homeostasis and repair.
Etv5 Is Required to Maintain AT2 Cell Identity.
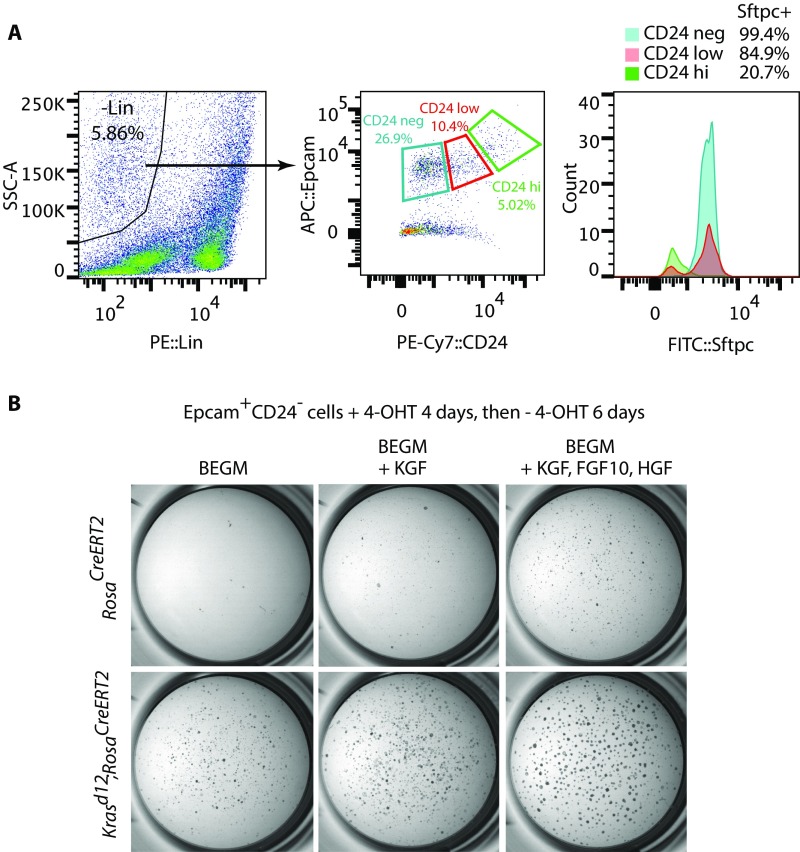
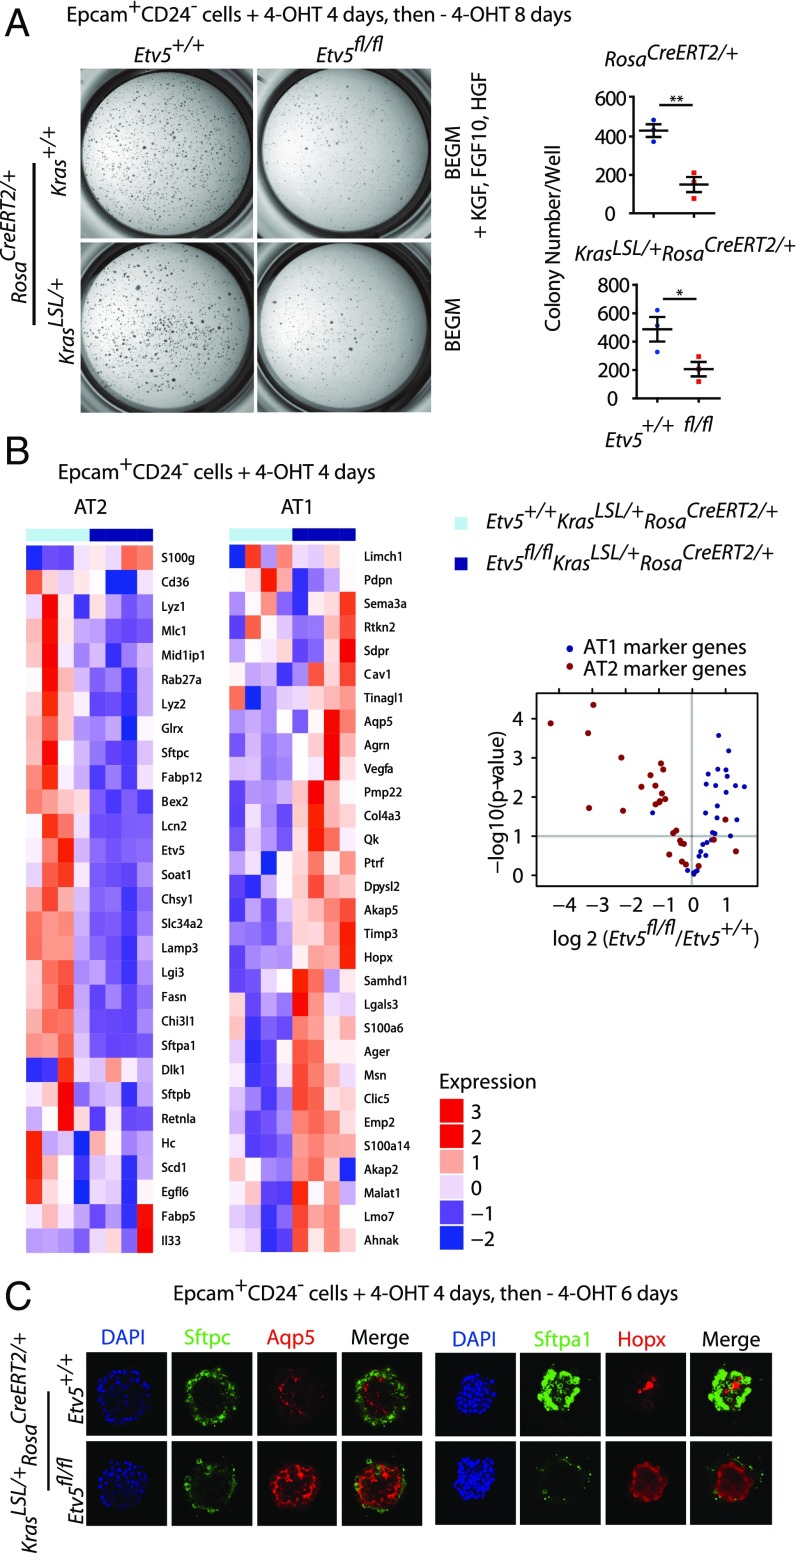
Signaling by Kras regulates the self-renewal of AT2 cells (1), so we studied the effect of Etv5 deficiency on the growth of cultured AT2 cell colonies. Lineage− CD24− Epcam+ cells (25) were isolated from adult lungs bearing tamoxifen-inducible (RosaCreERT2) (26) conditional alleles of mutant Kras (Kras.LSL.G12D) (27) and Etv5 (28). More than 99% of sorted cells expressed the AT2 cell marker Sftpc (Fig. S1A). The primary AT2 cells were cultured on Matrigel for 10–12 d total, with 4-hydroxytamoxifen (4-OHT) added on the first 4 d to induce expression of Krasd12 and to delete Etv5. Etv5+/+ cells formed compact, spherical colonies in the presence of exogenous growth factors [hepatocyte growth factor (HGF), FGF10, and keratinocyte growth factor (KGF)] or after Krasd12 induction (Fig. S1B). Colony numbers in both contexts were reduced significantly by Etv5 deficiency (Fig. 2A). To determine the molecular consequence of Etv5 deletion, we performed RNA-sequencing (RNA-seq) on Etv5+/+KrasLSL/+RosaCreERT2/+ and Etv5fl/flKrasLSL/+RosaCreERT2/+ cells after 4 d of culture in 4-OHT, when there was no detectable difference in their growth. Etv5 deficiency had a dramatic effect on the expression of AT1 and AT2 marker genes (7); AT2 marker genes were down-regulated significantly, and AT1 marker genes were up-regulated significantly (Fig. 2B). Immunostaining confirmed that Etv5-deficient colonies expressed more of the AT1 markers Aqp5 and Hopx and less of the AT2 markers Sftpa1 and Sftpc than control colonies (Fig. 2C). These data suggest that Etv5 preserves the AT2 cell phenotype and that, in the absence of Etv5, cells adopt a more AT1-like identity.
Fig. S1.
Isolation and culture of primary AT2 cells. (A) Sorting of AT2 cells by flow cytometry. Lin, lineage markers CD31, F4/80, TER-119, CD16/32, CD11b, and CD45; SSC, side-scattered light. (B) Colonies formed by AT2 cells after culture on Matrigel with or without growth factors. BEGM, bronchial epithelial cell growth medium.
Fig. 2.
Etv5 is required to maintain AT2 cell fate in vitro. (A, Left) Colonies formed by AT2 cells after culture on Matrigel with or without growth factors. (Right) Each symbol indicates cells from one mouse. Data are shown as mean ± SEM. **P < 0.01, *P < 0.05 (Student's t test). (B, Left) Heatmap shows expression of AT1 and AT2 marker genes (7) in cells sorted and then cultured with 4-OHT. RNA-seq values are scaled and centered, normalized counts to account for library size and gene length (n = 4 mice per genotype). (Right) The volcano plot indicates the effect of Etv5 deficiency on AT1 (blue) and AT2 (red) marker genes. (C) Immunostaining of colonies formed by AT2 cells after induction of Krasd12.
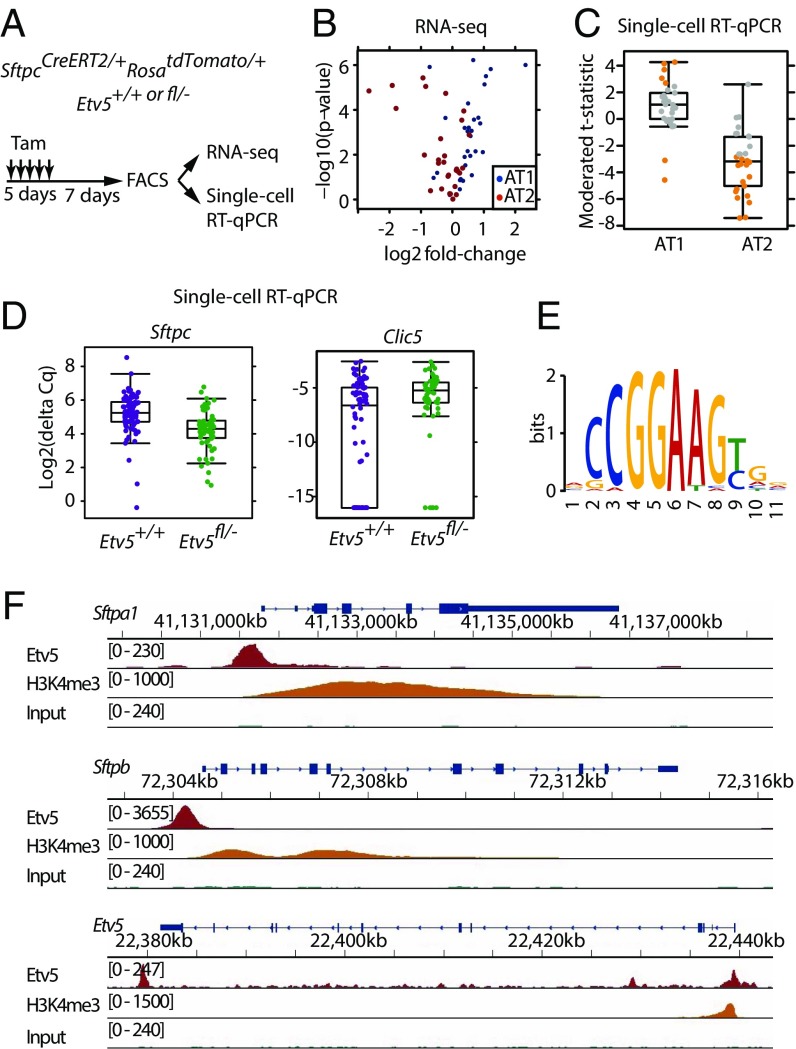
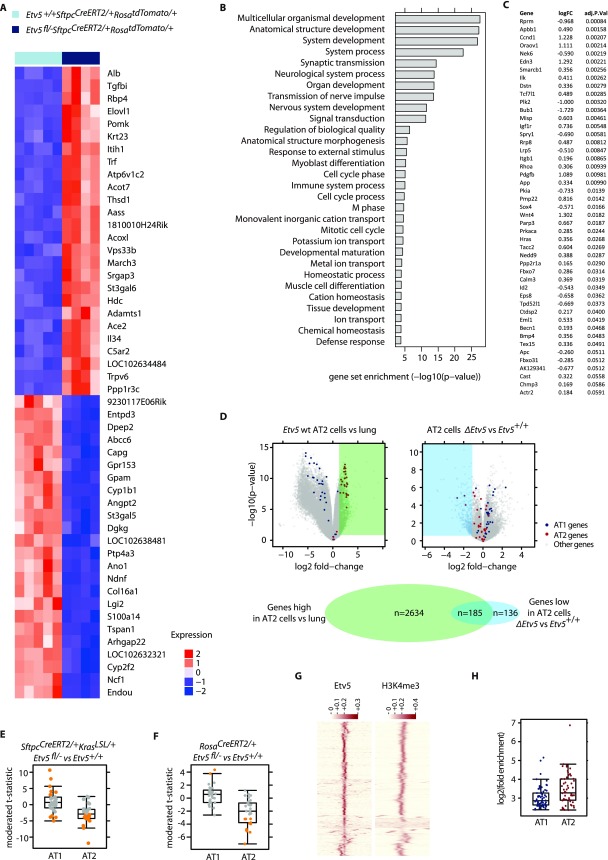
To verify that data from cultured AT2 cells reflect AT2 cell characteristics in vivo, we also examined gene expression after deleting Etv5 from AT2 cells in mice. tdTomato+ cells were isolated from SftpcCreERT2/+RosatdTomato/+ lungs after tamoxifen treatment to delete Etv5 (Fig. 3A and Fig. S2 A–C). Whole lungs were analyzed also. Reassuringly, Etv5 deletion from AT2 cells in vivo increased the expression of AT1 marker genes and decreased the expression of AT2 marker genes, as observed in vitro (Fig. 3B). There were 185 genes that were both enriched in wild-type AT2 cells (compared with whole lung) and suppressed by Etv5 deficiency (Fig. S2D). This overlap in genes was significantly larger than expected by chance (P < 2.2e-16, χ2 test). Single-cell quantitative RT-PCR (qRT-PCR) on Etv5+/+ tdTomato+ cells and ΔEtv5 tdTomato+ cells confirmed that Etv5 deficiency reduced the expression of AT2 marker genes and increased the expression of AT1 marker genes (Fig. 3 C and D). Similar changes in gene expression occurred when the tdTomato+ cells expressed Krasd12 (Fig. S2E) or when lineage− CD24− Epcam+ cells from tamoxifen-treated Etv5+/+RosaCreERT2/+ and Etv5fl/-RosaCreERT2/+ mice were compared (Fig. S2F). Collectively, these results indicate that an Etv5-dependent transcriptional program is critical for the maintenance of AT2 cell identity.
Fig. 3.
Etv5 regulates AT2 cell identity in vivo. (A) Scheme for deleting Etv5 from AT2 cells in the lungs. Tam, tamoxifen. (B) Volcano plot indicating the effect of Etv5 deficiency on AT1 (blue) and AT2 (red) marker gene expression in tdTomato+ cells isolated as in A. (C) Comparison of AT1 and AT2 marker gene expression in Etv5+/+ versus ΔEtv5 tdTomato+ Epcam+ CD24− lineage− cells by single-cell qRT-PCR. The t statistic for each gene is plotted. Orange dots indicate genes significantly changed by Etv5 deficiency (Benjamini–Hochberg adjusted P < 0.05, moderated t test). Genes that are up-regulated in ΔEtv5 tdTomato+ cells show larger positive t statistics, whereas those down-regulated show larger negative t statistics. (D) Box-and-whisker plots showing the expression of the most differentiated AT2 and AT1 genes, Sftpc and Clic5, in tdTomato+ cells by single-cell RT-PCR. (E) Consensus sequence motif identified by the MEME motif-finding software in the Etv5-binding sites found in C57BL/6 AT2 cells. (F) ChIP-Seq normalized coverage of representative AT2 marker genes.
Fig. S2.
Gene-expression changes caused by Etv5 deficiency. (A) Heat map of the top 50 most differentially expressed genes in Etv5+/+ SftpcCreERT2/+ RosatdTomato/+ tdTomato+ cells compared with Etv5fl/- SftpcCreERT2/+RosatdTomato/+ tdTomato+ cells at 7 d after the last dose of tamoxifen. (B) Gene set enrichment analysis identifying Gene Ontology Biological Process gene sets that show significant enrichment when comparing differential expression based on RNA-seq fromEtv5+/+ SftpcCreERT2/+ RosatdTomato/+ and Etv5fl/- SftpcCreERT2/+RosatdTomato/+ tdTomato+ cells. (C) Cell-cycle genes identified by Gene Ontology analysis that are significantly down-regulated in Etv5fl/− SftpcCreERT2/+RosatdTomato/+ tdTomato+ cells compared with Etv5+/+ SftpcCreERT2/+ RosatdTomato/+ cells. (D) Volcano plots indicating the difference in gene expression between tdTomato+ cells and whole-lung tissue (Left) and between ΔEtv5 and Etv5+/+ tdTomato+ cells (Right). There were 2,819 genes more highly expressed in tdTomato+ cells than in whole-lung tissue (Benjamini–Hochberg adjusted P < 0.05, fold-change >2), and 321 genes were expressed at lower levels in ΔEtv5 tdTomato+ cells than in wild-type cells (Benjamini–Hochberg adjusted P < 0.05, fold-change is less than −2). The Venn diagram shows the overlap of these two gene sets. (E) Single-cell qRT-PCR of AT1 and AT2 marker genes. Each point represents one gene and shows the t statistic comparing Etv5+/+ tdTomato+ and ΔEtv5 tdTomato+ cells isolated from tamoxifen-treated SftpcCreERT2/+KrasLSL/+ mice as in Fig. 3A. Genes that are significantly changed (Benjamini–Hochberg adjusted P < 0.05) are shown in orange. (F) Single-cell qRT-PCR of AT1 and AT2 marker genes. Each point represents one gene and shows the t statistic comparing Etv5+/+ lineage− CD24− Epcam+ and ΔEtv5 lineage− CD24− Epcam+ cells isolated from tamoxifen-treated RosaCreERT2/+ mice. Genes that are significantly changed (Benjamini–Hochberg adjusted P < 0.05) are shown in orange. (G) Heatmap showing the row scaled signal for Etv5 and H3k4me3 on 1,000 randomly selected ETV5 sites on a 5 kb+/5 kb− window. The H3k4me3 window is centered on the Etv5 binding site. (H) The graph indicates the degree of enrichment of ChIP-seq–identified peaks adjacent to the AT1 and AT2 marker genes compared with background calculated by Macs2.
We searched for direct transcriptional targets of Etv5 in AT2 cells by performing ChIP-sequencing (ChIP-seq). We identified 10,545 Etv5-binding sites that were close to transcription start sites (TSS) in primary AT2 cells from C57BL/6 mice. Of these sites, 9,610 contained the GGAA ETS core motif (Fig. 3E) and overlapped with H3K4Me3, an active promoter mark (Fig. 3F and Fig. S2G). Interestingly, Etv5 peaks were located within the promoters of both AT1 and AT2 marker genes (Fig. S2H), and thus the regulation of gene expression by Etv5 is likely complex and influenced by the presence of other factors.
Etv5 Is Required for the Proliferation of AT2 Cells Following Lung Damage.
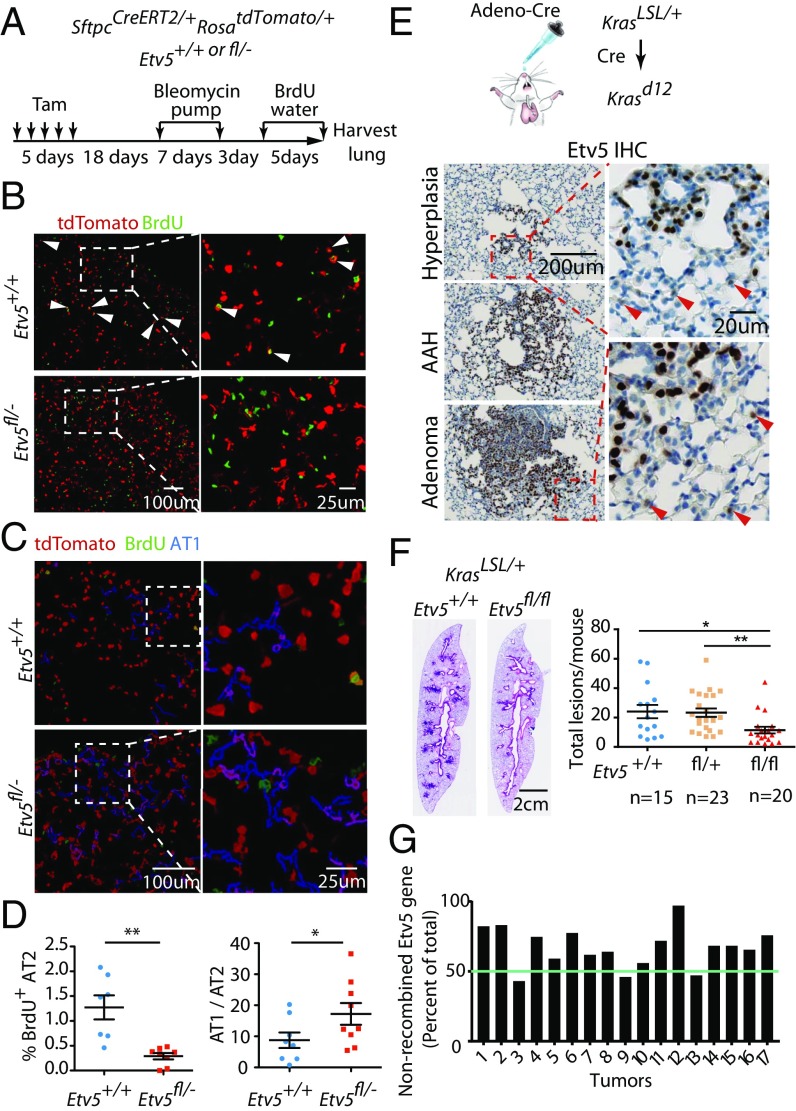
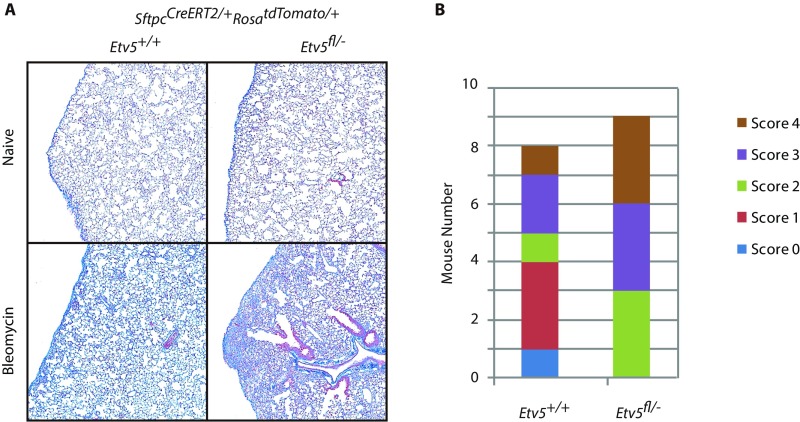
The altered gene-expression profile of Etv5-deficient AT2 cells suggested they might be more prone to differentiate into AT1 cells. When challenged with s.c. bleomycin, tamoxifen-treated Etv5fl/-SftpcCreERT2/+RosatdTomato/+ mice tended to develop more extensive and severe lung lesions than control mice (Fig. 4 A–D and Fig. S3). Lesions in Etv5 mutant lungs contained more tdTomato+ AT1 cells, and fewer AT2 cells were labeled with BrdU, which marks cells that have proliferated (Fig. 4 B–D). These data indicate that Etv5 deficiency in AT2 cells compromises their ability to divide/self-renew and favors their differentiation into AT1 cells.
Fig. 4.
Etv5 in AT2 cells is required for the repair of bleomycin-induced lung injury and for Kras-driven tumor initiation. (A) Scheme for the study of bleomycin-induced lung injury. Tam, tamoxifen. (B) Bleomycin-treated SftpcCreERT2/+RosatdTomato/+ lung showing tdTomato expression (red) and BrdU incorporation (green). Arrowheads indicate tdTomato+ BrdU+ cells. (C) Lungs in B with tdTomato+ AT1 cells pseudocolored blue after being differentiated from AT2 cells by their lower staining intensity and elongated shape. (D) Quantification of tdTomato+ BrdU+ cells and relative numbers of AT1 versus AT2 cells. Data are shown as mean ± SEM; **P < 0.01, unpaired one-tailed Student's t test with Welch's correction; *P < 0.05, unpaired one-tailed Student's t test. AT1 and AT2 cells are distinguished as in C. (E) Immunostaining of a KrasLSL/+ lung lesion 20 wk after infection with adenovirus expressing Cre. Arrowheads indicate Etv5+ cells adjacent to the lesions. AAH, atypical adenomatous hyperplasia. (F) Representative lung lesions at 20 wk after infection with adenovirus expressing Cre. The graph shows mean lesion numbers. Each dot represents one mouse. Bars indicate mean ± SEM. **P < 0.01, *P < 0.05 (Mann–Whitney test). (G) The graph indicates the extent to which the floxed Etv5 allele was retained in microdissected tumors from KrasLSL/+ Etv5fl/fl mice infected with adenovirus expressing Cre.
Fig. S3.
Etv5 deficiency impairs recovery from bleomycin-induced lung injury. (A) Trichrome staining of lungs. Fibrous connective tissue is blue. Cells are red. (B) Distribution of histologic scores of lung lesions in bleomycin-treated animals. Histologic lesions were scored according to the following matrix: 0, no histologic lesions identified; 1, focal increased cellularity with minimal to no fibrosis; 2, focal to locally extensive subpleural fibrosis with little to no extension into adjacent alveoli; 3, subpleural fibrosis and inflammation with moderate, focal, or mild multifocal extension and disruption of the alveolar architecture; 4, extensive, multifocal fibrosis and inflammation with marked disruption of the alveolar architecture. P = 0.07, Student t test.
Etv5 Is Required for Lung Tumor Initiation by Oncogenic Kras.
AT2 cells are the cells-of-origin in Kras-induced lung adenocarcinoma (1, 3–5). Therefore, we determined whether Etv5 deficiency in AT2 cells impairs Kras-driven tumor initiation. Adenovirus expressing Cre was delivered intranasally to induce Krasd12 expression in the lungs of mice with wild-type Etv5 (Etv5+/+KrasLSL/+) or floxed Etv5 alleles (Etv5fl/flKrasLSL/+). Etv5 protein was detected in early Krasd12 lesions with little hyperplastic morphology and in more advanced tumors (Fig. 4E). Etv5 deficiency, concurrent with Krasd12 expression, significantly reduced the proliferative lung lesion burden, including hyperplastic and adenomatous lesions (Fig. 4F). Seventeen adenomas that did develop in Etv5fl/fl KrasLSL/+ mice were genotyped after laser-capture microdissection. All 17 tumors retained the floxed Etv5 exons (showing 43–100% retention) (Fig. 4G), indicating that complete ablation of Etv5 prevents Kras-driven lung tumor initiation.
ERK Signaling Inhibits COP1-Mediated Degradation of Etv5.
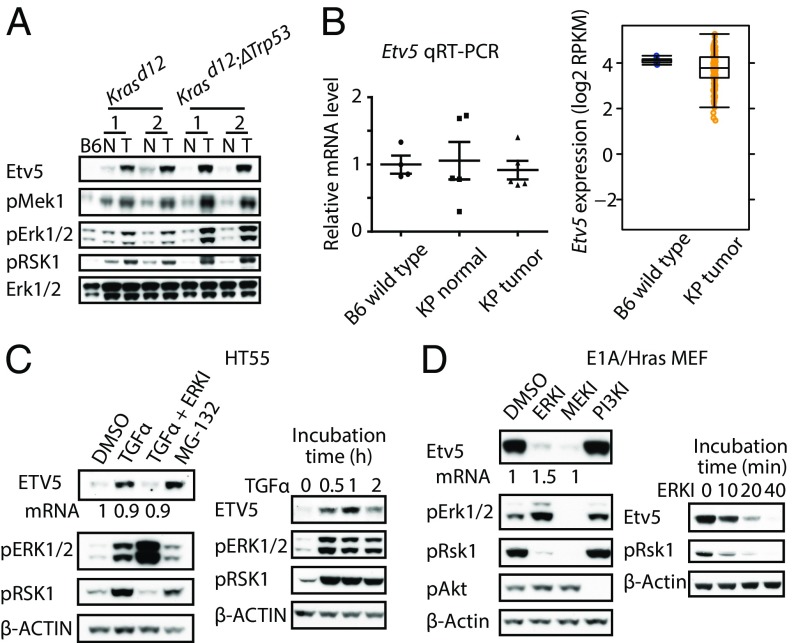
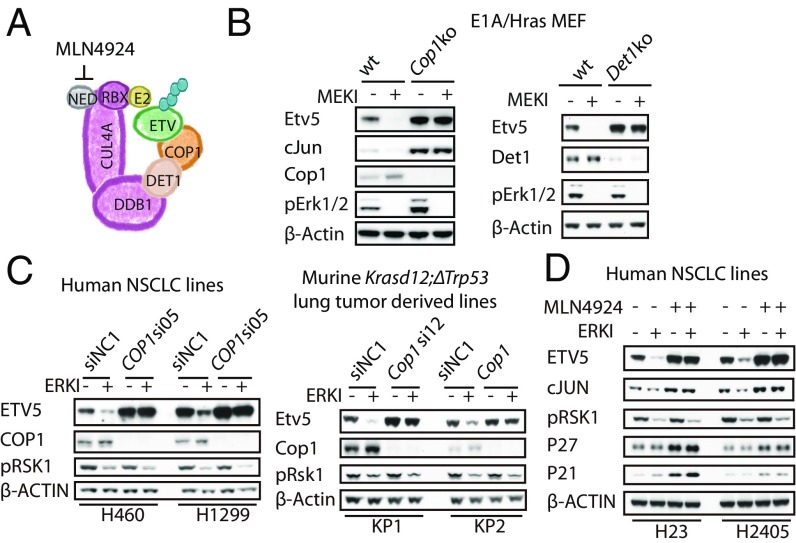
Krasd12 lung tumors overexpressed Etv5 protein compared with normal lung tissue (Figs. 4E and 5A), but they did not overexpress Etv5 mRNA (Fig. 5B). ETV5 is targeted for proteasomal degradation by CRL4COP1/DET1 (29). Therefore, we hypothesized that Ras signaling stabilized Etv5 by inactivating CRL4COP1/DET1. Indeed, human HT55 colon cancer cells treated with TGFα for 30 min to activate Ras contained more ETV5 protein but not ETV5 mRNA than cells receiving DMSO vehicle (Fig. 5C). The increase in ETV5 was similar to that induced by the proteasome inhibitor MG-132 and was prevented by ERK inhibitor 11e (Vertex). Robust expression of Etv5 in mouse embryonic fibroblasts (MEFs) transformed with E1A and HrasG12V was also suppressed by inhibiting mitogen-activated protein kinase kinase (MEK)/MAP2K7 or ERK, but not PI3K, for as little as 10 min. Importantly, the MEK and ERK inhibitors had little impact on Etv5 mRNA in the MEFs (Fig. 5D). These data suggest that activation of ERK downstream of Ras stabilizes ETV5 in cells that express the ETV5 gene.
Fig. 5.
ERK activation stabilizes ETV5. (A) Immunoblots of normal (N) and tumor (T) lung tissue from two KrasLSL/+ and two KrasLSL/+Trp53fl/fl mice after infection with adenovirus expressing Cre. B6, C57BL/6 wild-type. pRSK1 (phospho-Ribosomal protein S6 kinase alpha-1) is a readout of ERK activity. (B) Etv5 gene expression in lung tissue from wild-type (B6) mice and in normal or tumor lung tissue from KrasLSL/+Trp53fl/fl (KP) mice after infection with adenovirus expressing Cre. (C) Immunoblots of HT55 cells. Treatments shown on the left were for 1 h, with the exception of MG-132, which was added for 3 h. Numbers indicate relative ETV5 mRNA expression by real-time RT-PCR. (D) Immunoblots of E1A/Hras-transformed MEFs. Inhibitor treatments shown on the left were for 1 h. Numbers indicate relative Etv5 mRNA expression by real-time RT-PCR.
Next we tested if ERK stabilizes ETV5 by inhibiting CRL4COP1/DET1. COP1 is recruited to the DDB1–CUL4A–RBX1 core complex via the adaptor protein DET1 (Fig. 6A). Although inhibition of Ras/MAPK signaling reduced Etv5 abundance in wild-type transformed MEFs, it had no effect on Etv5 levels in similarly transformed Cop1−/− or Det1−/− MEFs (Fig. 6B). We also observed COP1-dependent degradation of ETV5 following ERK inhibition in human H460 and H1299 nonsmall cell lung cancer (NSCLC) cells and in mouse Krasd12;ΔTrp53 (KP) lung cancer cells (Fig. 6C). Cullin-based E3 ligases require neddylation for their activity, and MLN4924, an inhibitor of the Nedd8-activating enzyme (30), also prevented ETV5 degradation after ERK inhibition in human NSCLC lines (Fig. 6D). Therefore, CRL4COP1/DET1 targets ETV5 for degradation when the Ras–Raf–MEK–ERK pathway is switched off.
Fig. 6.
Active ERK stabilizes ETV5 by inhibiting the COP1 ubiquitin ligase. (A) Organization of the CRL4COP1/DET1 ubiquitin ligase. NED, Nedd8. (B) Immunoblots of E1A/Hras-transformed MEFs treated with MEK inhibitor (MEKI) for 1 h. (C) Immunoblots of H460, H1299, and Krasd12ΔTrp53 (KP1 and KP2) cells transfected with Cop1 siRNAs and then treated with ERK inhibitor (ERKI) for 1 h. SiNC1, siRNA negative control 1. (D) Immunoblots of human NSCLC lines treated with MLN4924 for 1 h before the addition of ERK inhibitor.
Phosphorylation of DET1 by ERK Inhibits CRL4COP1/DET1.
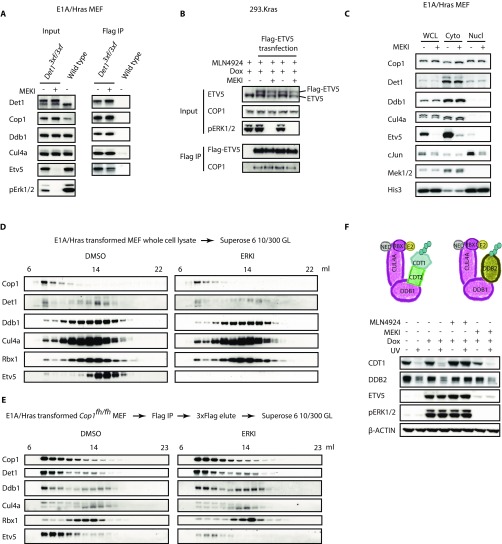
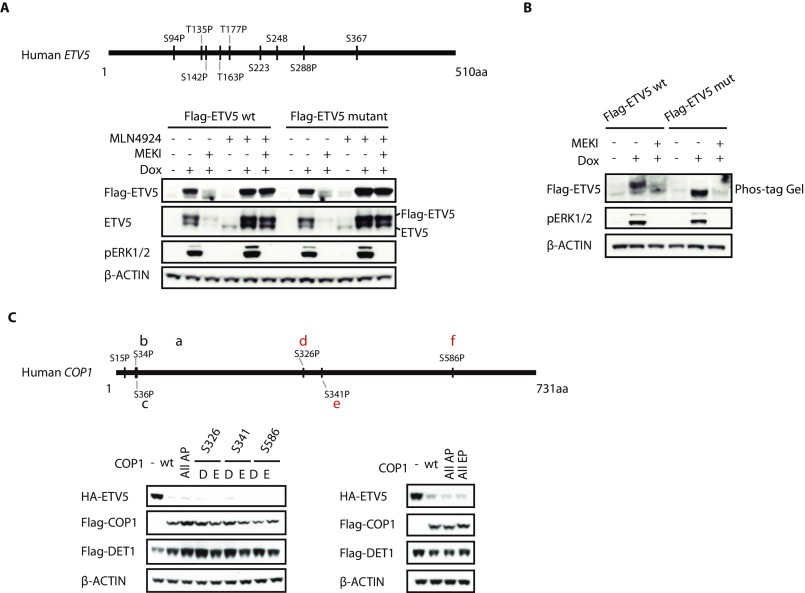
We investigated what ERK phosphorylates to inactivate CRL4COP1/DET1. ERK activity did not alter the abundance, subcellular localization, or known interactions of components of CRL4COP1/DET1 or the activity of the CRL4 core complex (Fig. S4). Therefore, we explored whether ERK phosphorylated ETV5 rather than CRL4COP1/DET1. HEK293 cells expressing KrasG12D and cRaf in response to doxycycline (hereafter called “293.Kras cells”) were transfected with either wild-type ETV5 or mutant ETV5 having all putative ERK, mitogen- and stress-activated protein kinase 1 (MSK), ribosomal S6 kinase (RSK), and PKA phosphorylation sites mutated to alanine. Phosphorylation of mutant ETV5 was impacted because it did not migrate like wild-type ETV5 in a Phos-tag acrylamide gel. However, the mutant protein was stabilized following ERK activation (Fig. S5 A and B), suggesting that ERK-dependent phosphorylation of ETV5 does not shield it from COP1-dependent degradation. In addition, the COP1 substrate c-JUN also accumulated when ERK was active (Fig. 6 B and D).
Fig. S4.
Localization, abundance, and interactions of components of the Cop1 complex and activity of the core Cullin complex are unchanged by ERK activity. (A) Immunoblots of E1A/Hras-transformed wild-type or Det13×f/3×f MEFs that were treated with 1 µM MEK inhibitor (MEKI) for 1 h. 3×Flag-DET1 was immunoprecipitated (IP) with anti-Flag beads where indicated. (B) Immunoblots of 293.Kras cells transfected with Flag-ETV5 were treated with 100 ng/mL doxycycline (Dox) overnight, then with 1 µM MLN4924 for 1 h, and then with 1 µM MEK inhibitor for another 1 h. Flag-ETV5 was immunoprecipitated with anti-Flag beads where indicated. (C) Immunoblots of E1A/Hras-transformed MEFs that were treated with 1 µM MEK inhibitor for 1 h and then were fractionated into cytosol (Cyto) and nuclei (Nucl). WCL, whole-cell lysate starting material. (D) Immunoblots of E1A/Hras-transformed MEFs treated with DMSO or 1 µM ERK inhibitor (ERKI) for 1 h and fractionated through a Superose 6 10/300 GL column. (E) Immunoblots of COP1-containing complexes affinity purified from Cop1fh/fh MEFs treated with 1 µM ERK inhibitor or DMSO for 1 h. Flag.HA-COP1 was immunoprecipitated with anti-Flag beads and eluted with 3×Flag peptide. The eluates were fractionated through a Superose 6 10/300 GL column and concentrated by acetone precipitation for Western blot analysis. (F) Immunoblots of 293.Kras cells treated with doxycycline overnight and then with MEK inhibitor or MLN4924 for 1 h before UV irradiation. CDT1, chromatin licensing and DNA replication factor 1; CDT2, chromatin licensing and DNA replication factor 2; DDB2, damage-specific DNA-binding protein 2; NED, Nedd8. Each small blue ball represents a ubiquitin in a polyubiquitin chain.
Fig. S5.
Mutagenesis analysis of ETV5 and COP1. (A) Western blots of 293.Kras cells transfected with Flag-tagged wild-type or mutant ETV5, the latter with putative ERK, MSK, RSK, and PKA phosphorylation sites mutated to alanine. Where indicated, at 1 d posttransfection, cells were treated with 100 ng/mL doxycycline (Dox) overnight, then 1 µM MLN4924 for 1 h, and then 1 µM MEK inhibitor (MEKI) for another 1 h. (B) Immunoblots of 293.Kras cells expressing Flag-tagged wild-type or mutant ETV5. Anti-Flag immunoblot samples were resolved by 7% PAGE with 100 µM Phos-tag acrylamide. (C, Lower) Immunoblots of HEK293T cells cotransfected with ETV5 (E), DET1 (D), and either wild-type or mutant COP1. All AP, all putative ERK sites mutated to alanine; All EP, all putative ERK sites mutated to glutamic acid. (Upper) Sites conserved between species are indicated in red.
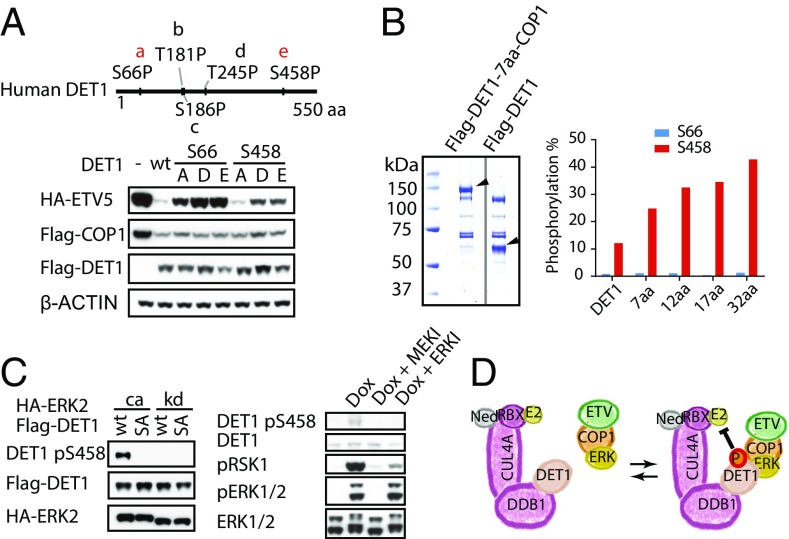
Next, we determined whether COP1 and/or DET1 were the targets of ERK signaling. COP1 contains six putative ERK sites, three of which are conserved in vertebrates. Mutation of these six sites to either alanine or phospho-mimetic residues (aspartic acid or glutamic acid) did not prevent ectopic COP1 from targeting coexpressed ETV5 for degradation (Fig. S5C). Mutagenesis of putative ERK sites in DET1 proved more informative: Replacement of DET1 Ser66 or Ser458 with phospho-mimetic residues impaired the ability of CRL4COP1/DET1 to reduce ETV5 protein abundance (Fig. 7A). We noted that an alanine substitution at Ser66, but not at Ser458, in DET1 also compromised ETV5 degradation, suggesting that Ser66 is a structurally important residue.
Fig. 7.
Phosphorylation of DET1 by ERK. (A, Lower) Immunoblots of HEK293T cells cotransfected with ETV5, COP1, and either wild-type or mutant DET1. (Upper) The schematic of DET1 indicates the position of putative ERK sites. Residues conserved through evolution are shown in red. (B, Left) Coomassie blue-stained wild-type DET1 or DET1-COP1–tethered protein that was affinity purified from 293.Kras coexpressing constitutively active (CA) ERK2. Arrowheads indicate DET1-COP1 and DET1 bands. (Right) Percentage of DET1 phosphorylated at Ser66 or Ser458 estimated by MS. aa, the number of amino acids forming the linkers between DET1 and COP1. (C, Left) Immunoblots of 293.Kras cells coexpressing wild-type or S458A mutant DET1 with constitutively active (ca) or kinase-dead (kd) ERK2. (Right) Immunoblots of 293.Kras cells after treatment with doxycycline (Dox) and then with DMSO, 1 µM MEK inhibitor (MEKI), or 1 µM ERK inhibitor (ERKI) for 1 h before harvest. (D) Model of ERK regulation of COP1 complex activity. NED, Nedd8.
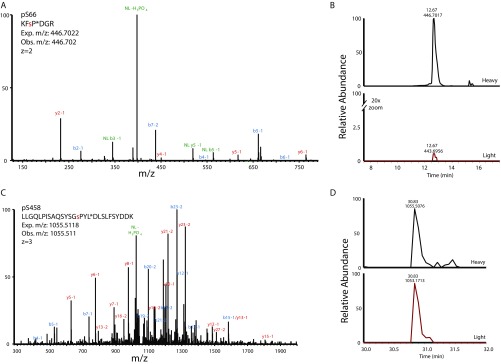
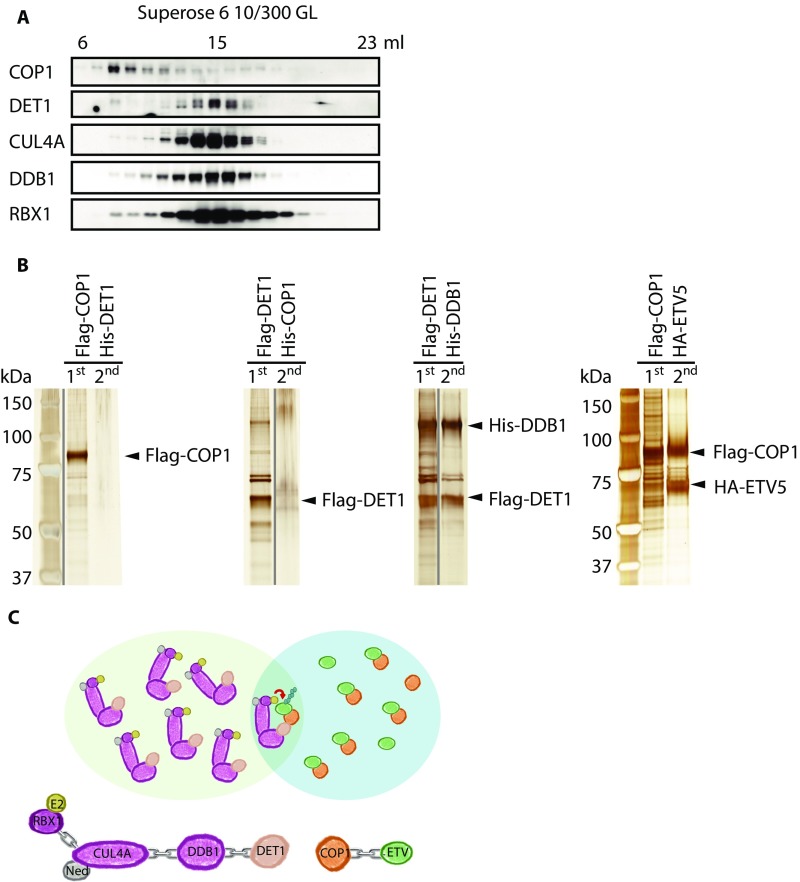
MS using absolute quantification (AQUA) peptide standards confirmed that some Flag-tagged DET1 was phosphorylated on Ser66 or Ser458 after coexpression with active ERK2 in 293.Kras cells (Fig. S6). Approximately 12% of DET1 was phosphorylated at Ser458, but less than 2% of DET1 was phosphorylated at Ser66 (Fig. 7B and Table S1). Given the apparently weak interaction between COP1 and DET1 (Fig. S7), we investigated whether tethering COP1 to DET1 with an artificial linker would increase phosphorylation on DET1 Ser458. Indeed, DET1–COP1 fusion proteins with linkers of different lengths exhibited enhanced phosphorylation at DET1 Ser458 (Fig. 7B and Table S1). By contrast, phosphorylation at DET1 Ser66 was not increased in these fusion proteins (Fig. 7B and Table S1). Further evidence that DET1 is phosphorylated on Ser458 in an ERK-dependent manner was obtained with a DET1 Ser458 phospho-specific antibody. Thus, endogenous DET1 phosphorylated on Ser458 was detected in 293.Kras cells after doxycycline treatment to activate the Ras/MAPK pathway, and this phosphorylation could be prevented by either MEK or ERK inhibition (Fig. 7C). Collectively, these data support a model wherein ERK phosphorylates DET1 at Ser458 (Fig. 7D) and this phosphorylation inactivates CRL4COP1/DET1 by an as yet unknown mechanism. ETV5 accumulates even when very little DET1 is phosphorylated, presumably because only DET1 encountering the COP1–ETV5 complex needs to be modified.
Fig. S6.
Isotopically labeled peptide standards confirm DET1 phosphorylation at Ser66 and Ser458. (A) MS/MS spectrum of isotopically labeled standard peptide representing phosphorylation on the human DET1 protein at Ser66 (pSer66). The red lowercase residue denotes the position of phosphorylation. An asterisk (P*) indicates the isotopically labeled residue. Observed (Obs.) and expected (Exp.) m/z measurements, as well as charge (z) state are shown. Ions from the b' and y' series are indicated on the spectrum in blue and red; ions demonstrating neutral loss (NL) of the phosphate are shown in green. (B) Extracted ion chromatogram (± 10 ppm) for pSer66 showing isotopically labeled standard peptide (Heavy) and the digested analyte peptide (Light). To display coelution more clearly, the y axis of the light peptide was magnified 20×. Retention time (in minutes) and observed m/z for heavy and light peptides are shown above each corresponding peak. (C) MS/MS spectrum of isotopically labeled standard peptide representing phosphorylation on the human DET1 protein at Ser458 (pSer458) with the isotope label incorporated at Leu (L*). (D) Extracted ion chromatogram (± 10 ppm) for pSer458 presented as in B.
Table S1.
Calculated abundances of peptides representing variously digested forms of the Ser66 and Ser458 loci of DET1
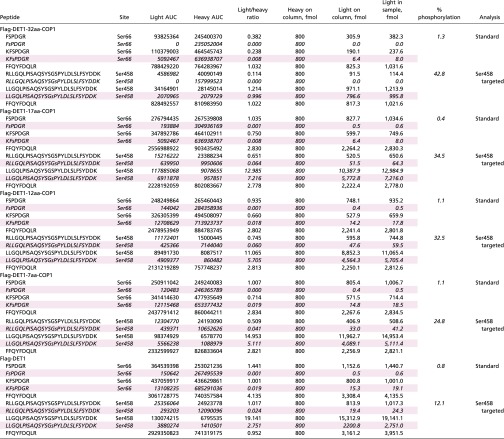 |
Peptides from the Ser66 locus were analyzed by a standard LC-MS/MS method, and those from the Ser458 site were analyzed by a targeted method specially tailored to favor hydrophobic, later-eluting features. An unmodified Det1 peptide (FFQYFDQLR) with characteristics amenable to both methods was quantified in each as a measure of consistency. Rows representing phosphorylated peptides are shaded pink. Values reported for the percent of phosphorylation were made in a locus-specific manner as Det1phos/Det1total. For the Ser66 locus, Det1total is the summed abundance of all four peptides quantified from this locus, including the two unmodified species (FSPDGR, KFSPDGR) and the two pSer66 phosphopeptides (FsPDGR, KFsPDGR; the lowercase “s” denotes the phosphorylated residue). Det1phos is the summed abundance of the two pSer66 phosphopeptides. At the Ser458 locus, Det1total is the summed abundance of the four peptides measured from this locus, i.e., the unmodified and phosphorylated versions RLLGQLPISAQSYSGSPYLDLSLFSYDDK, LLGQLPISAQSYSGSPYLDLSLFSYDDK and RLLGQLPISAQSYSGsPYLDLSLFSYDDK, LLGQLPISAQSYSGsPYLDLSLFSYDDK. Italicized sequences correspond to phosphorylated peptides.
Fig. S7.
Weak interaction between COP1 and DET1. (A) Immunoblots of HEK293T lysate fractions from a Superose 6 10/300 GL column. (B) Silver-stained proteins recovered after serial affinity purification of the indicated overexpressed tagged protein pairs from HEK293F cells. (C) Model for COP1 and DET1 residing in distinct cellular pools.
Discussion
We show that the transcription factor Etv5 is critical for maintaining AT2 cell identity. Although Etv4 and Etv5 are expressed in the distal lung epithelium of the embryo (10), adult lung expressed Etv5 more than Etv1 or Etv4 (Fig. 1A), and Etv5 was largely restricted to AT2 cells (Fig. 1B). Etv5 deletion caused a global reduction in the expression of genes associated with AT2 cells (GSE80102), including the AT2 marker genes identified by single-cell sequencing (7). In contrast, AT1 marker genes were up-regulated by Etv5 deficiency. The genes down-regulated in Etv5-deficient AT2 cells included not only those linked to AT2 cell physiology but also genes such as Id2 that mark the distal progenitor population in the developing embryonic lung (31) and genes involved in cell-cycle regulation (Fig. S2 B and C). Therefore, Etv5 probably regulates both the specialized physiological and progenitor roles of AT2 cells.
Etv5 ChIP-seq indicated that Etv5 binds to the promoters of a wide range of genes in AT2 cells (Fig. 3F). This binding probably was functionally significant, because transcription of many of these genes was dysregulated in Etv5-deficient AT2 cells (Fig. 3B and Fig. S2 D and E). Therefore, it was somewhat surprising that deletion of Etv5 from AT2 cells did not impact lung morphology or function over the next 3 mo. All the surfactant protein genes were still expressed in the mutant AT2 cells, although at a reduced level, and this reduced expression must have sustained lung function. The turnover rate of AT2 cells in normal mouse lung is also very slow (1), so defective AT2 cell replication would be difficult to detect in the absence of challenge. Bleomycin-induced lung injury is known to trigger AT2 cells to proliferate and differentiate into AT1 cells (24), and it was in the context of this damage that Etv5-deficient AT2 cells were found to differentiate into AT1 cells with less replication (Fig. 4 A–D). These data suggest that ETV5 plays a critical role in preserving the pool of AT2 cells needed to repair alveolar damage.
We also show that Etv5 is essential for lung tumor initiation by oncogenic Kras. Although it is well established that the Ras/MAPK pathway is a major driver of lung tumorigenesis, relatively little is known about the transcriptional programs that this pathway triggers. Ras signaling via ERK dramatically stabilized Etv5 in cells, whereas Etv5 was labile when ERK was inhibited (Fig. 5 C and D). Interestingly, not all Sftpc+ AT2 cells in normal wild-type mouse lung were Etv5+ by immunohistochemistry (Fig. 1B); it is possible that this observation reflects unique subsets of AT2 cells or that transient growth signals cause Etv5 abundance in AT2 cells to fluctuate. Regardless, constitutive activation of the Ras pathway appears to sustain high levels of Etv5 in the AT2 cells that give rise to tumors (Fig. 4E). Stabilization of Etv5 appears to be an early event in cell transformation, because Etv5 was readily detected even in early hyperplastic lesions (Fig. 4E). Furthermore, Etv5 must be critical for oncogenesis, because we never have identified any Etv5-deficient KrasG12D adenomas (Fig. 4G). The findings that Etv5 is stabilized downstream of ERK and specifically regulates AT2 cell biology distinguish it from other transcription factors involved in lung tumor growth, such as Nkx2-1, Foxa1/2, or Gata2, which have broader expression in lung and are not directly regulated by Ras/MAPK signaling.
ERK inhibition of CRL4COP1/DET1 enables Etv5 protein to accumulate rapidly in cells. Etv1, Etv4, and Etv5 are also phosphorylated by ERK, MSK, and RSK, and this phosphorylation boosts their transcriptional activity (32–36). It was surprising that Etv5 phosphorylation by ERK was dispensable for COP1-mediated degradation, because phosphorylation of the COP1 substrates ETS1 and ETS2 is reported to regulate their interaction with the ligase (18). Instead, DET1 was phosphorylated in an ERK-dependent manner, although how this phosphorylation inhibits the function of the ligase remains to be elucidated. Future studies will need to address whether other COP1 substrates are also subject to regulation by the Ras/MAPK pathway.
In summary, we demonstrate that Ras–Raf–MEK–ERK signaling inactivates the COP1 ubiquitin ligase complex, resulting in the accumulation of the transcription factor ETV5. This posttranslational mechanism facilitates very rapid changes in transcriptional programs in response to external cues such as growth factors. In the lung, sustained Ras activation in AT2 stem cells stabilized ETV5, and this stabilization was an essential initiating event in the development of atypical adenomatous hyperplasia. The related PEA3 transcription factor, ETV1, has a similar role in GIST (15), so it is tempting to speculate that Etv genes are key factors in maintaining the populations that give rise to other Ras-driven cancers.
Materials and Methods
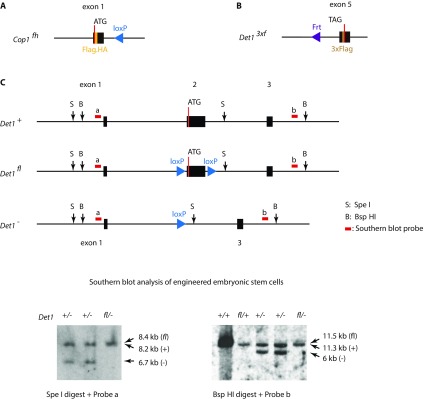
The Genentech Animal Care and Use Committee approved all experiments using mice. Mouse alleles Cop1fh, Det13xf, and Det1fl were generated by gene targeting (Fig. S8). An s.c.-implanted micro-osmotic pump was used to deliver bleomycin. KrasLSL mice intranasally infected with Adeno-Cre virus were killed at 20 wk postinfection to evaluate lung tumor burden. Primary AT2 cells were isolated by FACS from single-cell suspensions of mouse lung and were cultured on Matrigel. Detailed methods, reagents, and statistical analyses are provided in SI Materials and Methods.
Fig. S8.
Generation of Cop1fh, Det13×f, and Det1fl gene-targeted mice. (A) The Flag.HA epitope tag sequence was inserted right after the start codon of Cop1 to create the Cop1fh knockin allele. (B) The 3×Flag epitope tag sequence was inserted before the Det1 stop codon to create the Det13×f knockin allele. (C) Exon 2 of Det1 was flanked with loxP sites to create a conditional Det1 allele. Lower are Southern blots confirming targeting of the Det1 locus and generation of ES cells that are heterozygous for the Det1 floxed (fl) or knockout (−) alleles. ES cell genomic DNA was digested with the restriction enzyme indicated and hybridized to a probe sequence outside of the homology arms of the targeting vector. The locations of the probe sequences are indicated on the maps above.
SI Materials and Methods
Mice.
Mice were maintained under specific pathogen-free conditions. The KrasLSL, Etv5fl, Trp53fl, Rosa26CreERT2, Rosa26tdTomato, and SftpcCreERT2 alleles were described previously (23, 24, 26–28, 37). Intranasal infection of lungs with 5 × 10⁶ pfu Adeno-Cre (University of Iowa) was performed as described (27). Cop1fh/+, Det1fl/+, and Det13×f/+ mice were generated from gene-targeted C57BL/6 ES cells by genOway (Cop1) and Genentech (Det1) (Fig. S8). Crosses to a Cre (or Flp) recombinase deleter mouse eliminated the neomycin selection cassette flanked by loxp sites [or flippase recognition target (FRT) sites] in each strain. The following genotyping primers were used: Cop1fh genotyping primers, 5′-CGT GCA TGA CCA CGA GTT TCT G and 5′-CGG GAA CCT TAA CTC TGC AAA CAC amplified 116 bp wild-type and 226 bp knockin (KI) DNA fragments; Det13×f genotyping primers, 5′-CCT TTG AGC CAT TTG CCA T and 5′-TCG TCG GTA TTC CAG ACT GCT amplified 189 bp wild-type and 255 bp KI DNA fragments; Det1fl genotyping primers, 5′-GGG CCT CTT ACT CAG ACC ACA CTG, 5′-TGT CAG GGT CAC TGT GCA ACT GT, and 5′-GTT CGA GGC GGT GAA TGA CA amplified 221 bp wild-type, 319 bp floxed, and 431 bp knockout DNA fragments.
Laser-Capture Microdissection and PCR Analysis.
Solid adenomas with defined boundaries were dissected from H&E-stained lung sections using a PALM MicroBeam System (Zeiss). DNA was extracted with a QIAamp DNA Micro Kit (Qiagen) and analyzed by SYBR Green PCR (Invitrogen). Mixtures with different ratios of genomic DNAs from Etv5 wild-type and knockout MEFs were used as standard samples to quantify the abundance of the Etv5-knockout allele in the tumor samples. The following primers were used for PCR:
Etv5− deletion allele: 5′-GGCGTAGGTACAACAGTAAGACGAATTCCG; 5′-AGTAGAGCCACCACCAAACTCGGATCCC
Etv5fl allele: 5′-GCCCATCTGAGGGTCCATGCTAAGTGAG; 5′-GTGGCTACTGGTGACTGAGTCATCGAAC
Actb: 5′-AGGAAGTAGAAGCAGGATGGTCGTCTTG; 5′-GTGGCCTTGGCTATTCTGGAACTAGCTC.
Immunohistochemistry.
Formalin-fixed paraffin-embedded mouse lung sections (5 µm) were treated with EDTA antigen retrieval buffer (Thermo) followed by peroxidase blocking solution (Kirkegaard & Perry Laboratories) and avidin/biotin blocking agents (Vector Labs). TNB blocking buffer (Perkin-Elmer) was used before incubation with primary antibodies. Species-appropriate biotinylated secondary antibodies (Vector Labs) were applied, followed by ABC Elite HRP Reagents (Vector Labs). Biotinylated TSA amplification reagents (Perkin-Elmer) were used to visualize staining. Antibodies used for staining were Pro-Sftpc (1:4,000; Millipore AB3786), Hopx (1:600; Santa Cruz sc-302126), Scgb1a1 (1:2,000; Santa Cruz sc-9772), ETV5 (5 μg/mL; Genentech clone 4A6), RFP (1:1,000; Rockland 600-401-379), and BrdU (1:20; BD 347580). To count Sftpc+ and Etv5+Sftpc+ cells, three fields were randomly selected from one slide double-stained for Etv5 and Sftpc. Three slides from three different mice were counted.
AT2 Cell Isolation, Culture, and Staining.
Lungs from mice aged 8–15 wk were perfused with PBS and then were filled with 2 mL Dispase (BD) and 0.5 mL 1% low-melt agarose via the trachea. The lungs were digested with 1 mg/mL Collagenase/Dispase (Roche) and 10 U/mL DNase (New England Biolabs) at 37 °C for 15–20 min and then were dissociated in GentleMACS C tubes (Miltenyi Biotec). The cells were incubated with red cell lysis buffer (0.15 M NH4Cl, 10 mM KHCO3, 0.1 mM EDTA) for 1 min and then were filtered through a 40-µm strainer. Antibodies for FACS were from eBioscience: CD31-PE (1:40), CD45-PE (1:250), Epcam-APC (1:40), and CD24-PE-Cy7 (1:150). Sorting was performed in a FACSAria cell sorter (BD), and data were analyzed with FlowJo (FlowJo, LLC). The sorted cells (200 µL) were seeded at 6 × 10⁵ cells/mL into one well of a 48-well plate coated with 150 µL 100% Matrigel (Corning) and were cultured in BEGM medium (Lonza) minus hydrocortisone and with 5% charcoal-stripped FBS (Invitrogen). The growth factors supplied in the medium were from R&D Systems: mFgf7 (25 ng/mL), mHGF (30 ng/mL), and hFgf10 (50 ng/mL). The medium was changed every 2 d. For immunostaining, the sorted cells were cultured on Transwells (Corning) coated with 100% Matrigel. The Matrigel disk was fixed in 4% paraformaldehyde for 2 h and then was cut off and transferred into 24-well plates for staining. Imaging was performed with a Nikon A1R confocal microscope, and images were processed by ImageJ. Antibodies used for staining were Sftpc (1:100p Santa Cruz sc-7706), Hopx (1:100; Santa Cruz sc-30216), Sftpa1 (1:100; Santa Cruz sc-7699), and Aqp5 (1:100; Santa Cruz sc-28628).
Bleomycin-Induced Lung Injury.
A micro-osmotic pump (ALZET model 1007D, lot no.10333-14) filled with 100 U/kg bleomycin (National Drug Code 0703-3155-01, lot no. 31319025B) was implanted s.c. under anesthesia in the back of the mouse for 1 wk. Then the pump was removed, and beginning 3 d later the mouse was given drinking water containing 0.8 mg/mL BrdU for 5 d.
Whole-Slide Imaging and Quantification.
Whole-slide images were acquired with a NanoZoomer-XR automated slide-scanning platform (Hamamatsu) at a final magnification of 200×. Scanned slides were analyzed in the Matlab software package (version R2014b; MathWorks). Standard morphological operations were used to identify lung tissue labeled by DAPI staining. AT2 cells expressing tdTomato were identified using an algorithm based on a global intensity threshold and radial symmetry (38). Each tdTomato+ cell region then was scored as positive or negative for BrdU. AT1 cell areas were identified as thin regions that were dimmer than AT2 cells but brighter than background.
RNA-Seq.
AT2 cells cultured in Matrigel were incubated with cell-recovery solution (Corning) for 20 min on ice. Total RNA was extracted using RNeasy kits (Qiagen) with on-column DNase treatment. RNA (5–20 ng) was sequenced using the Illumina HiSeq. 2500 platform. Sequencing reads were aligned to the mouse genome (NCBI37) with RefSeq gene models (RefSeq v53, downloaded on 16 June 2012) using GSNAP (version 2013-10-10; research-pub.gene.com/gmap/) and the following parameters: -M 2 -n 10 -B 2 -i 1 -N 1 -w 200000 -E 1–pairmax-rna = 200000–clip-overlap. Gene-expression levels were computed by summing the number of reads mapping to exons of RefSeq genes. Differential expression between groups of samples was computed using the R limma package (8) after transformation from raw counts using the voom function. Enriched categories were selected using the gene Set Test from the R limma package (39), a mean rank test. For visualization, counts were normalized using size factors (as described by DESeq2 in ref. 40) to account for library size and gene length. For visualization purposes, reads per kilobase of transcript per million (RPKM) values were calculated for each gene in the RefSeq set.
Single-Cell qRT-PCR.
A Fluidigm 96.96 Dynamic Array IFC (integrated fluidic circuit) and a BioMark HD system were used for single-cell qRT-PCR. Lung single-cell suspensions were sorted into 96-well plates at one cell per well, and the manufacturer’s protocol for making cDNA and for PCR was followed. PCR primers were designed and synthesized by Fluidigm. Data were processed using the HTqPCR bioconductor package (41) with values scaled to the actin measurement for each sample. Differential expression was assessed using the limma package 20, as for RNA-seq described above.
ChIP-Seq.
AT2 cells (2 × 10⁷) were isolated from 10- to 12-wk-old C57BL/6 mice. Active Motif Epigenetic Services performed ChIP assays. Cells fixed with 1% formaldehyde for 11 min were quenched with 0.25 M glycine and then were swollen in lysis buffer for 30 min on ice. Chromatin was isolated after sonication to shear the DNA to an average length of 300–500 bp. Input and immunoprecipitated DNAs were treated with RNase, proteinase K, and heat for de-crosslinking, followed by ethanol precipitation. Sequencing reads were aligned to the mouse genome (NCBI37) using GSNAP (version 2013-10-10). Mapped reads then were assessed for peaks relative to the input controls using Macs2 (version 2.1.0.20150420) call peak function (42). Peak-fold enrichment was calculated using Macs2, using a sliding window across the genome and assessing read counts relative to expected background. Antibodies used for immunoprecipitation were ETV5 (Proteintech, 13011-1-AP) and H3K4me3 (Abcam ab8580).
Cell Culture.
Primary MEFs derived from embryo day (E)13.5 or E14.5 embryos were immortalized with the retroviral vectors pWZL-hygro-E1A and pBABE-puro-HrasG12V and were cultured with DMEM + 10% FBS. 293.Kras cells were derived from the Flp-In T-REx 293 cell line (Invitrogen) by integrating KrasG12D and cRaf ORFs and were cultured with DMEM/F12 + 10% tetracycline-free FBS (Clontech, 631105). HEK293T cells were cultured in DMEM + 10% FBS. Freestyle 293-F cells (Invitrogen, R790-07) were cultured according to the manufacturer’s protocol. Human and mouse lung cancer cell lines were cultured with RPMI-1640 + 10% FBS. The following compounds were used to treat cells:
-
i)
MEK inhibitor (Genentech G00033054) used at 1 µM
-
ii)
ERK inhibitor (Vertex 11e described in ref. 43) used at 1 µM
-
iii)
MLN4924 (Active Biochem A1139) used at 1 µM
-
iv)
MG132 (EMD 474791) used at 1 µM
-
v)
PI3K inhibitor (Cell Signaling Technology 9901) used at 50 µM
siRNAs and TaqMan Probe.
The following siRNA were used: hCOP1 siRNA05, CUACAAGGAUGUCUCGUAU; mCop1 siRNA12, GGUCAAAGGUCUAUCAGGA.
The mEtv5 TaqMan probe was Mm00465816_m1 (Invitrogen).
Immunoprecipitations and Western Blotting.
For most immunoprecipitations, cells were lysed in 50 mM Tris (pH 8), 150 mM NaCl, 1% Triton X-100, and 10% glycerol with a protease and phosphatase inhibitor mixture (PIERCE, 78440). Soluble lysate was precipitated with magnetic Flag beads (Sigma, M8823), HA beads (Pierce, 88837), or Ni-NTA beads (Qiagen, 36111). Beads were washed extensively in lysis buffer before elution in 200 µg/mL 3×Flag peptide, 1 mg/mL 3×HA peptide, and 500 mM imidazole or in LDS sample buffer (Invitrogen) containing 1% 2-mercaptoethanol. For Western blotting, cells were lysed in radio immunoprecipitation assay (RIPA) buffer or urea buffer [8 M urea, 1% SDS, 1% Triton X-100, 50 mM Tris (pH 7.5), 10% glycerol, 135 mM NaCl, 2 mM EDTA] with a protease and phosphatase inhibitor mixture. Antibodies used for Western blotting were β-actin (Cell Signaling Technology, 5125), COP1 (Bethyl Laboratories, A300-894), DET1 (Genentech, clone 3G5), ETV5 (Genentech, clone 4A6), Flag (Sigma, M2), ERK1/2 (Cell Signaling Technology, 4695), pERK1/2 (Cell Signaling Technology, 4370), pRSK1 (Millipore, 04-419), pAKT (Cell Signaling Technology, 4060), p21 (Cell Signaling Technology, 2947), p27 (BD, 610242), DDB1 (Cell Signaling Technology, 6998), CUL4A (Bethyl Laboratories, A300-739A), RBX1 (GeneTex, GTX63590), CDT1 (GeneTex, GTX62912), DDB2 (Cell Signaling Technology, 5416), pCREB (Millipore, 06-519), pEIF4e (Cell Signaling Technology, 9741), and peEF2k (Cell Signaling Technology, 3691). DET1 pSer458 rabbit polyclonal antibody (Yenzym Antibodies, LLC) was raised against the peptide SAQSYSG-pS-PYLDLS.
MS.
Immunoprecipitated Flag-DET1 or Flag-DET1-COP1 proteins concentrated by ultrafiltration were reduced for SDS/PAGE. Resolved proteins were stained with SimplyBlue (Invitrogen) and subjected to in-gel trypsin digestion. Gel regions of interest (i.e., corresponding to the expected molecular weight of DET1) were excised, destained, and subjected to in-gel reduction and alkylation before digestion with trypsin in 50 mM ammonium bicarbonate/5% acetonitrile (ACN) at a concentration of 8 ng/µL. Digestion was carried out overnight at 37 °C. Peptides were extracted from gel pieces twice, once with 50% ACN/0.1% trifluoroacetic acid and a second time with 100% ACN, and were combined with digests. Two picomoles of DET1 heavy isotope-labeled internal standard peptides were spiked into each sample. Each sample was subsequently split equivalently into two vials and dried by SpeedVac, generating vial set 1 and vial set 2 for LC-MS/MS on a Thermo Orbitrap-Elite mass spectrometer. Vial set 1 was resuspended in 2% acetonitrile/0.1% formic acid (FA) immediately before MS analysis and was analyzed using a standard LC-MS/MS method. LC-MS/MS was performed on a Waters nanoAcquity UPLC system connected to a Thermo Orbitrap-Elite. Samples were directly loaded onto a Waters 100 μm × 100 mm Symmetry C18 column packed with 1.7 μm BEH-130 and were separated with a 35-min linear gradient from 2 to 25% solvent B (0.1% FA, 98% ACN) at a flow rate of 1 µL/min. The Orbitrap-Elite was operated in data-dependent mode whereby a full MS scan collected at 60,000 resolution was followed by collision-induced dissociation MS/MS on the top 15 most abundant ions found in the full MS scan. Vial set 2 was resuspended in 20% ACN/0.1% FA and was analyzed using a modified 35-min LC gradient from 7 to 50% solvent B and a targeted MS method for the detection of hydrophobic RLLGQLPISAQSYSGSPYLDLSLFSYDDK and LLGQLPISAQSYSGSPYLDLSLFSYDDK sequences covering phosphorylated and nonphosphorylated species from the Ser458 locus of DET1. Tandem mass spectra were submitted for database searching using Mascot software (Matrix Science) against human sequences in the UniProt database (v.2011_12) with carbamidomethylation set as a fixed modification and phosphorylated-S/T/Y and K-GG as variable modifications. Quantification of DET peptides was performed by comparing the areas under the curve (AUCs), obtained by extracted ion chromatograms over 10 ppm windows, for light and heavy DET peptides. Estimates of the percentage of phosphorylation were made in a locus-specific manner as Det1phos/Det1total, in which Det1total was defined as the sum of all measured phosphorylated and unmodified peptide species at that locus and Det1phos was defined as the sum of all phosphorylated species measured. An unmodified peptide from Det1 spanning residues 319–330 with the sequence FFQYFDQLR was quantified in both the standard and Ser458-targeted methods to assure quantitative consistency between the two methods but was not used as part of these calculations. Variability between Det1total levels calculated at the Ser66 locus, the Ser458 locus, and from the unmodified FFQYFDQLR peptide covering residues 319–330 was noted; hence comparisons of the percentage of phosphorylation between loci should be approached cautiously. Inconsistent measurements between loci for a protein in an AQUA experiment can derive from variability in the measurement of internal standard concentrations or from unaccounted for peptide species (i.e., modifications or incomplete digestion) (44).
Statistical Analysis.
No statistical methods were used to predetermine the sample. The indicated sample size (n) represents biological replicates. Group allocation was not randomized, and outcome assessment was not performed in a blinded manner unless indicated. All samples that met proper experimental conditions were included in the analysis. Experimental data were analyzed for significance using GraphPad Prism 6. Data were subjected to the D’Agostino–Pearson omnibus normality test to determine whether they were sampled from a Gaussian distribution. Variances between groups were compared using an F test. If a Gaussian model of sampling was satisfied, an unpaired Student’s t test or a t test with Welch's correction (if variances not equal) was used. If the samples deviated from a Gaussian distribution, a Mann–Whitney test was used.
The data discussed in this publication have been deposited in NCBI’s Gene Expression Omnibus (45) and are accessible through GEO Series accession numbers GSE80101 and GSE80102.
Acknowledgments
We thank Karen O'Rourke for gene cloning and Allie Maltzman for preparing MEFs.
Footnotes
Conflict of interest statement: All authors were employees of Genentech.
Data deposition: The sequences reported in this paper have been deposited in the National Center for Biotechnology Information Gene Expression Omnibus (GEO) database (accession nos. GSE80101 and GSE80102).
This article contains supporting information online at www.pnas.org/lookup/suppl/doi:10.1073/pnas.1621177114/-/DCSupplemental.
References
- 1.Desai TJ, Brownfield DG, Krasnow MA. Alveolar progenitor and stem cells in lung development, renewal and cancer. Nature. 2014;507(7491):190–194. doi: 10.1038/nature12930. [DOI] [PMC free article] [PubMed] [Google Scholar]
- 2.Barkauskas CE, et al. Type 2 alveolar cells are stem cells in adult lung. J Clin Invest. 2013;123(7):3025–3036. doi: 10.1172/JCI68782. [DOI] [PMC free article] [PubMed] [Google Scholar]
- 3.Xu X, et al. Evidence for type II cells as cells of origin of K-Ras-induced distal lung adenocarcinoma. Proc Natl Acad Sci USA. 2012;109(13):4910–4915. doi: 10.1073/pnas.1112499109. [DOI] [PMC free article] [PubMed] [Google Scholar]
- 4.Mainardi S, et al. Identification of cancer initiating cells in K-Ras driven lung adenocarcinoma. Proc Natl Acad Sci USA. 2014;111(1):255–260. doi: 10.1073/pnas.1320383110. [DOI] [PMC free article] [PubMed] [Google Scholar]
- 5.Sutherland KD, et al. Multiple cells-of-origin of mutant K-Ras-induced mouse lung adenocarcinoma. Proc Natl Acad Sci USA. 2014;111(13):4952–4957. doi: 10.1073/pnas.1319963111. [DOI] [PMC free article] [PubMed] [Google Scholar]
- 6.Lee JH, et al. Surfactant protein-C chromatin-bound green fluorescence protein reporter mice reveal heterogeneity of surfactant protein C-expressing lung cells. Am J Respir Cell Mol Biol. 2013;48(3):288–298. doi: 10.1165/rcmb.2011-0403OC. [DOI] [PMC free article] [PubMed] [Google Scholar]
- 7.Treutlein B, et al. Reconstructing lineage hierarchies of the distal lung epithelium using single-cell RNA-seq. Nature. 2014;509(7500):371–375. doi: 10.1038/nature13173. [DOI] [PMC free article] [PubMed] [Google Scholar]
- 8.Laudet V, Hänni C, Stéhelin D, Duterque-Coquillaud M. Molecular phylogeny of the ETS gene family. Oncogene. 1999;18(6):1351–1359. doi: 10.1038/sj.onc.1202444. [DOI] [PubMed] [Google Scholar]
- 9.Liu Y, Jiang H, Crawford HC, Hogan BL. Role for ETS domain transcription factors Pea3/Erm in mouse lung development. Dev Biol. 2003;261(1):10–24. doi: 10.1016/s0012-1606(03)00359-2. [DOI] [PubMed] [Google Scholar]
- 10.Herriges JC, et al. FGF-Regulated ETV Transcription Factors Control FGF-SHH Feedback Loop in Lung Branching. Dev Cell. 2015;35(3):322–332. doi: 10.1016/j.devcel.2015.10.006. [DOI] [PMC free article] [PubMed] [Google Scholar]
- 11.Herriges JC, et al. Genome-scale study of transcription factor expression in the branching mouse lung. Dev Dyn. 2012;241(9):1432–1453. doi: 10.1002/dvdy.23823. [DOI] [PMC free article] [PubMed] [Google Scholar]
- 12.Kathuria H, Cao Y, Hinds A, Ramirez MI, Williams MC. ERM is expressed by alveolar epithelial cells in adult mouse lung and regulates caveolin-1 transcription in mouse lung epithelial cell lines. J Cell Biochem. 2007;102(1):13–27. doi: 10.1002/jcb.21270. [DOI] [PubMed] [Google Scholar]
- 13.Tomlins SA, et al. Distinct classes of chromosomal rearrangements create oncogenic ETS gene fusions in prostate cancer. Nature. 2007;448(7153):595–599. doi: 10.1038/nature06024. [DOI] [PubMed] [Google Scholar]
- 14.Vitari AC, et al. COP1 is a tumour suppressor that causes degradation of ETS transcription factors. Nature. 2011;474(7351):403–406. doi: 10.1038/nature10005. [DOI] [PubMed] [Google Scholar]
- 15.Chi P, et al. ETV1 is a lineage survival factor that cooperates with KIT in gastrointestinal stromal tumours. Nature. 2010;467(7317):849–853. doi: 10.1038/nature09409. [DOI] [PMC free article] [PubMed] [Google Scholar]
- 16.Wertz IE, et al. Human De-etiolated-1 regulates c-Jun by assembling a CUL4A ubiquitin ligase. Science. 2004;303(5662):1371–1374. doi: 10.1126/science.1093549. [DOI] [PubMed] [Google Scholar]
- 17.Keeshan K, et al. Transformation by Tribbles homolog 2 (Trib2) requires both the Trib2 kinase domain and COP1 binding. Blood. 2010;116(23):4948–4957. doi: 10.1182/blood-2009-10-247361. [DOI] [PMC free article] [PubMed] [Google Scholar]
- 18.Lu G, et al. Phosphorylation of ETS1 by Src family kinases prevents its recognition by the COP1 tumor suppressor. Cancer Cell. 2014;26(2):222–234. doi: 10.1016/j.ccr.2014.06.026. [DOI] [PMC free article] [PubMed] [Google Scholar]
- 19.Lau OS, Deng XW. The photomorphogenic repressors COP1 and DET1: 20 years later. Trends Plant Sci. 2012;17(10):584–593. doi: 10.1016/j.tplants.2012.05.004. [DOI] [PubMed] [Google Scholar]
- 20.Zhang Y, et al. E3 ubiquitin ligase RFWD2 controls lung branching through protein-level regulation of ETV transcription factors. Proc Natl Acad Sci USA. 2016;113(27):7557–7562. doi: 10.1073/pnas.1603310113. [DOI] [PMC free article] [PubMed] [Google Scholar]
- 21.Migliorini D, et al. Cop1 constitutively regulates c-Jun protein stability and functions as a tumor suppressor in mice. J Clin Invest. 2011;121(4):1329–1343. doi: 10.1172/JCI45784. [DOI] [PMC free article] [PubMed] [Google Scholar]
- 22.Suriben R, et al. β-cell insulin secretion requires the ubiquitin ligase COP1. Cell. 2015;163(6):1457–1467. doi: 10.1016/j.cell.2015.10.076. [DOI] [PubMed] [Google Scholar]
- 23.Madisen L, et al. A robust and high-throughput Cre reporting and characterization system for the whole mouse brain. Nat Neurosci. 2010;13(1):133–140. doi: 10.1038/nn.2467. [DOI] [PMC free article] [PubMed] [Google Scholar]
- 24.Rock JR, et al. Multiple stromal populations contribute to pulmonary fibrosis without evidence for epithelial to mesenchymal transition. Proc Natl Acad Sci USA. 2011;108(52):E1475–E1483. doi: 10.1073/pnas.1117988108. [DOI] [PMC free article] [PubMed] [Google Scholar]
- 25.Chen H, et al. Airway epithelial progenitors are region specific and show differential responses to bleomycin-induced lung injury. Stem Cells. 2012;30(9):1948–1960. doi: 10.1002/stem.1150. [DOI] [PMC free article] [PubMed] [Google Scholar]
- 26.Seibler J, et al. Rapid generation of inducible mouse mutants. Nucleic Acids Res. 2003;31(4):e12. doi: 10.1093/nar/gng012. [DOI] [PMC free article] [PubMed] [Google Scholar]
- 27.Jackson EL, et al. Analysis of lung tumor initiation and progression using conditional expression of oncogenic K-ras. Genes Dev. 2001;15(24):3243–3248. doi: 10.1101/gad.943001. [DOI] [PMC free article] [PubMed] [Google Scholar]
- 28.Zhang Z, Verheyden JM, Hassell JA, Sun X. FGF-regulated Etv genes are essential for repressing Shh expression in mouse limb buds. Dev Cell. 2009;16(4):607–613. doi: 10.1016/j.devcel.2009.02.008. [DOI] [PMC free article] [PubMed] [Google Scholar]
- 29.Baert JL, et al. The E3 ubiquitin ligase complex component COP1 regulates PEA3 group member stability and transcriptional activity. Oncogene. 2010;29(12):1810–1820. doi: 10.1038/onc.2009.471. [DOI] [PubMed] [Google Scholar]
- 30.Soucy TA, et al. An inhibitor of NEDD8-activating enzyme as a new approach to treat cancer. Nature. 2009;458(7239):732–736. doi: 10.1038/nature07884. [DOI] [PubMed] [Google Scholar]
- 31.El-Mahdy MA, et al. Cullin 4A-mediated proteolysis of DDB2 protein at DNA damage sites regulates in vivo lesion recognition by XPC. J Biol Chem. 2006;281(19):13404–13411. doi: 10.1074/jbc.M511834200. [DOI] [PubMed] [Google Scholar]
- 32.Hu J, McCall CM, Ohta T, Xiong Y. Targeted ubiquitination of CDT1 by the DDB1-CUL4A-ROC1 ligase in response to DNA damage. Nat Cell Biol. 2004;6(10):1003–1009. doi: 10.1038/ncb1172. [DOI] [PubMed] [Google Scholar]
- 33.Rawlins EL, Clark CP, Xue Y, Hogan BL. The Id2+ distal tip lung epithelium contains individual multipotent embryonic progenitor cells. Development. 2009;136(22):3741–3745. doi: 10.1242/dev.037317. [DOI] [PMC free article] [PubMed] [Google Scholar]
- 34.Janknecht R. Analysis of the ERK-stimulated ETS transcription factor ER81. Mol Cell Biol. 1996;16(4):1550–1556. doi: 10.1128/mcb.16.4.1550. [DOI] [PMC free article] [PubMed] [Google Scholar]
- 35.Janknecht R, Monté D, Baert JL, de Launoit Y. The ETS-related transcription factor ERM is a nuclear target of signaling cascades involving MAPK and PKA. Oncogene. 1996;13(8):1745–1754. [PubMed] [Google Scholar]
- 36.O’Hagan RC, Tozer RG, Symons M, McCormick F, Hassell JA. The activity of the Ets transcription factor PEA3 is regulated by two distinct MAPK cascades. Oncogene. 1996;13(6):1323–1333. [PubMed] [Google Scholar]
- 37.Jackson EL, et al. The differential effects of mutant p53 alleles on advanced murine lung cancer. Cancer Res. 2005;65(22):10280–10288. doi: 10.1158/0008-5472.CAN-05-2193. [DOI] [PubMed] [Google Scholar]
- 38.Veta M, et al. Automatic nuclei segmentation in H&E stained breast cancer histopathology images. PLoS One. 2013;8(7):e70221. doi: 10.1371/journal.pone.0070221. [DOI] [PMC free article] [PubMed] [Google Scholar]
- 39.Ritchie ME, et al. limma powers differential expression analyses for RNA-sequencing and microarray studies. Nucleic Acids Res. 2015;43(7):e47. doi: 10.1093/nar/gkv007. [DOI] [PMC free article] [PubMed] [Google Scholar]
- 40.Love MI, Huber W, Anders S. Moderated estimation of fold change and dispersion for RNA-seq data with DESeq2. Genome Biol. 2014;15(12):550. doi: 10.1186/s13059-014-0550-8. [DOI] [PMC free article] [PubMed] [Google Scholar]
- 41.Dvinge H, Bertone P. HTqPCR: High-throughput analysis and visualization of quantitative real-time PCR data in R. Bioinformatics. 2009;25(24):3325–3326. doi: 10.1093/bioinformatics/btp578. [DOI] [PMC free article] [PubMed] [Google Scholar]
- 42.Zhang Y, et al. Model-based analysis of ChIP-Seq (MACS) Genome Biol. 2008;9(9):R137. doi: 10.1186/gb-2008-9-9-r137. [DOI] [PMC free article] [PubMed] [Google Scholar]
- 43.Aronov AM, et al. Structure-guided design of potent and selective pyrimidylpyrrole inhibitors of extracellular signal-regulated kinase (ERK) using conformational control. J Med Chem. 2009;52(20):6362–6368. doi: 10.1021/jm900630q. [DOI] [PubMed] [Google Scholar]
- 44.Phu L, et al. Improved quantitative mass spectrometry methods for characterizing complex ubiquitin signals. Mol Cell Proteomics. 2011;10(5):M110 003756. doi: 10.1074/mcp.M110.003756. [DOI] [PMC free article] [PubMed] [Google Scholar]
- 45.Edgar R, Domrachev M, Lash AE. Gene Expression Omnibus: NCBI gene expression and hybridization array data repository. Nucleic Acids Res. 2002;30(1):207–210. doi: 10.1093/nar/30.1.207. [DOI] [PMC free article] [PubMed] [Google Scholar]


