Significance
Focal adhesion kinase (FAK) is an intensely studied protein involved in many medically relevant biological processes, including cancer. Despite the large interest in FAK, a promising strategy to target FAK therapeutically is elusive. Here, we show that a region within the FAK protein that contains autophosphorylation site tyrosine (Y) 397 is essential for FAK activity in vivo. Myosin-1E (MYO1E), an actin-dependent molecular motor protein, directly interacts with FAK to induce Y397 autophosphorylation, which, in turn, causes changes in gene expression commonly observed in aggressive cancer. Our findings are significant because they further delineate FAK function in vivo and identify the MYO1E–FAK interaction as a possible Achilles’ heel for cancer.
Keywords: focal adhesion, myosin, fibronectin, melanoma, cancer
Abstract
Focal adhesion kinase (FAK) is a nonreceptor tyrosine kinase involved in development and human disease, including cancer. It is currently thought that the four-point one, ezrin, radixin, moesin (FERM)–kinase domain linker, which contains autophosphorylation site tyrosine (Y) 397, is not required for in vivo FAK function until late midgestation. Here, we directly tested this hypothesis by generating mice with FAK Y397-to-phenylalanine (F) mutations in the germline. We found that Y397F embryos exhibited reduced mesodermal fibronectin (FN) and osteopontin expression and died during mesoderm development akin to FAK kinase-dead mice. We identified myosin-1E (MYO1E), an actin-dependent molecular motor, to interact directly with the FAK FERM-kinase linker and induce FAK kinase activity and Y397 phosphorylation. Active FAK in turn accumulated in the nucleus where it led to the expression of osteopontin and other FN-type matrix in both mouse embryonic fibroblasts and human melanoma. Our data support a model in which FAK Y397 autophosphorylation is required for FAK function in vivo and is positively regulated by MYO1E.
Focal adhesion kinase (FAK) is a nonreceptor tyrosine kinase involved in many biological processes, ranging from mesoderm development to cancer cell metastasis (1). FAK localizes to focal adhesions (2), where it becomes part of a multiprotein complex that links the extracellular matrix (ECM) to the intracellular actin cytoskeleton. FAK is also found in the nucleus, where it is believed to relay information from the cell cortex (3) and induce transcriptional changes (4). The domain architecture of FAK comprises a four-point one, ezrin, radixin, moesin (FERM) domain that is separated from a C-terminal catalytic kinase domain by the FERM-kinase linker. FAK kinase-dead (5) embryos die with mesodermal defects during late gastrulation. In contrast, mice with conditional FAK deletions in the epidermis (6) or breast epithelium (7) show resistance to carcinogenesis.
Although FAK has important biological functions, the mechanisms regulating its activity are incompletely understood. For example, it is unclear whether the FERM-kinase linker that contains autophosphorylation site tyrosine (Y) 397 is required for FAK activity in vivo (8). In its closed, inactive conformation, the FAK kinase domain is autoinhibited through interaction with the N-terminal FERM domain. Y397 is nonphosphorylated (9). Upon activation by tethering (10) or other stimuli that induce conformational change (11), the linker region is exposed and Y397 becomes autophosphorylated, leading to the recruitment of the protooncogene SRC. FAK and SRC then form a transient complex, which stabilizes FAK in its active conformation and induces changes in cell shape and focal adhesion turnover in vitro (12). However, mice with a 19-aa deletion in the FAK linker that includes Y397 develop normally until midgestation (8).
Here, we have mechanistically discerned the contributions of Y397 to FAK function in vivo. Moreover, we screened for proteins that directly interact with the FAK linker, activate FAK kinase activity, and induce Y397 autophosphorylation.
Results
FAK Y397F Embryos Die Early During Mesoderm Development.
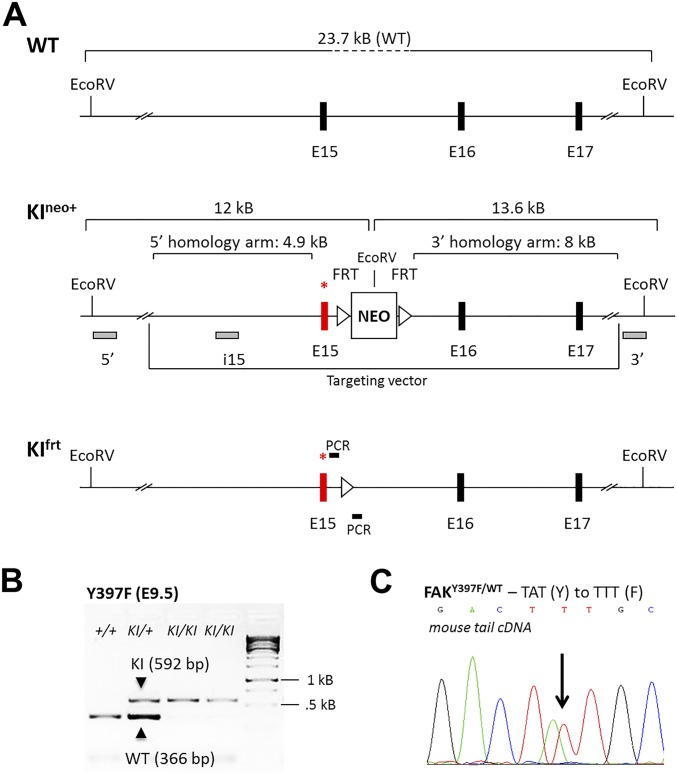
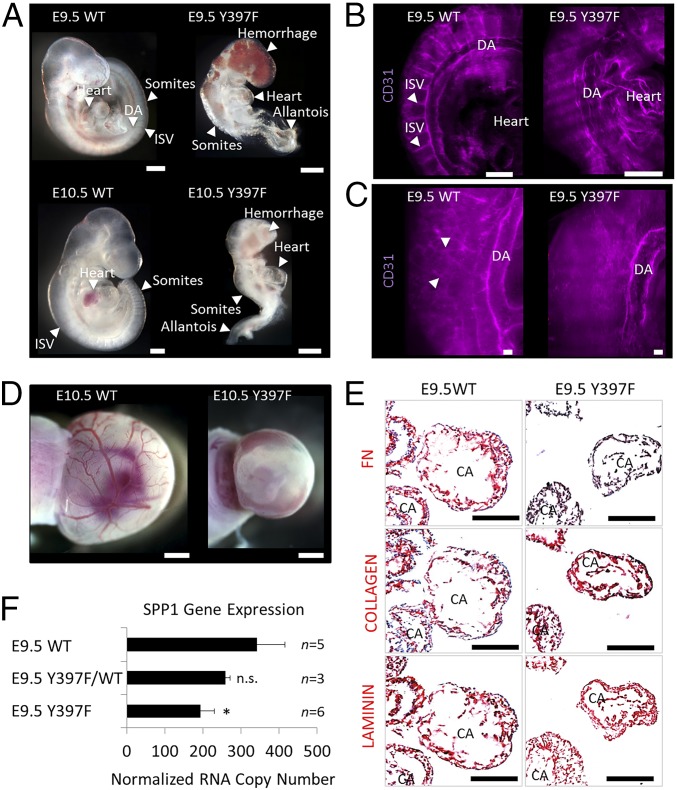
To determine the contribution of the FAK FERM-kinase domain linker to FAK function in vivo, Y397 was substituted with the nonphosphorylatable amino acid phenylalanine (F) in the germline of mice (Fig. S1). Although mice heterozygous for the Y397F mutation displayed no apparent phenotype, their intercross failed to produce live homozygous offspring (Tables S1 and S2). Timed matings revealed that the development of homozygous FAK Y397F embryos stalled at embryonic day (E) 9.5 with a phenotype characterized by hemorrhage, an unorganized somite structure, and an enlarged and unfused allantois (Fig. 1A). Whole-mount 3D imaging of CD31-immunostained blood vessels in FAK Y397F embryos demonstrated severely malformed or absent intersomitic vessels (Fig. 1B) and a lack of small vascular networks (Fig. 1C and Movies S1 and S2). FAK Y397F yolk sacs were without differentiated blood vessels (Fig. 1D).
Fig. S1.
Generation of FAKY397F knock-in (KI) mice. (A) Partial map of the FAK allele. Exon 15 (E15), which contains mutated Y397, is marked by an asterisk, before (KIneo+) and after (KIfrt) flippase-mediated deletion of the flirted (FRT) neocassette. The DNA fragment sizes obtained after EcoRV restriction digest, as well as probes (5′ and 3′ probes external to the targeting vector and the i15 internal probe) used for Southern blotting are shown. Filled boxes indicate exons, and triangles indicate FRT sites. Location of PCR primers for KIfrt mice genotyping is depicted: forward, GCTTTAGAGCACATCTGTCAC; reverse, CTGGGCTGCTTGAATAGTGGG. NEO, neomycin resistance gene; WT, wild-type. (B) Representative PCR genotyping of KIfrt embryos at E9.5 using primers flanking the FRT site. The expected PCR product size is 592 bp for the KI allele and 366 bp for the WT allele. PCR results from WT embryos (+/+), heterozygous embryos (KI/+) and homozygous embryos (KI/KI) are shown for both of the Y397F KIs. kB, kilobase. (C) Sanger sequencing of cDNA derived from the tails of heterozygous KI mice. Double peaks are indicative of base pair changes in the respective KI alleles. Y, tyrosine codon sequence; F, phenylalanine codon sequence.
Table S1.
Genotypes of embryos obtained from crosses between FAK Y397F/+ heterozygous mice derived from ES cell clone 64
| Genotype* | E9.5 | E10.5 | E11.5 | Born (P0) |
| +/+ | 38 | 33 | 12 | 229 |
| +/KI | 54 | 52 | 29 | 471 |
| KI/KI | 29 | 24 | 2 | 0 |
| No. of litters | 15 | 13 | 6 | 100 |
The total number of embryos of each genotype obtained from crosses between mice (FAK Y397F/+; ES cell clone 64) is shown at various embryonic days (E) and at birth (P0).
KI = FAKY397F.
Table S2.
Genotypes of embryos obtained from crosses between FAK Y397F/+ heterozygous mice derived from ES cell clone 354
| Genotype* | Born (P0) |
| +/+ | 21 |
| +/KI | 37 |
| KI/KI | 0 |
| No. of litters | 8 |
The total number of mice of each genotype (FAKY397F/+; ES cell clone 354) at birth (P0) is shown.
KI = FAKY397F.
Fig. 1.
FAK Y397F mutation is early embryonic lethal. (A) Bright-field images of E9.5 and E10.5 wild-type (WT) and Y397F embryos. DA, dorsal aorta; ISV, intersomitic vessel. (B) Whole-mount pictures of E9.5 WT and Y397F embryos stained for CD31 (purple). (C) Higher magnification of CD31-stained vasculature. Arrowheads point to a web of small vessels in WT embryos. (D) E10.5 control and Y397F yolk sacs. (E) Immunohistochemistry staining of E9.5 embryo frozen sections using the indicated antibodies. CA, cardiac mesoderm. (F) SPP1 RNA copy numbers as determined by quantitative PCR in E9.5 whole-embryo–derived RNA. *P = 0.002, Student’s t test. n.s., not significant. (Scale bars, 200 μm.)
The phenotype of FAK Y397F resembled the phenotype of fibronectin (FN)-deficient embryos (13). Because FAK has been shown to mediate FN expression (14) and an FN-rich matrix is critical for angiogenesis (13), we tested whether the vascular phenotype of FAK Y397F embryos was accompanied by an abnormal FN-type matrix. We found that FN protein was substantially reduced in cryosections of E9.5 FAK Y397F embryos (Fig. 1E), whereas laminin and collagen expression was unchanged (Fig. 1E). Using quantitative PCR on whole-embryo–derived RNA at E9.5 to screen for other ECM affected by FAK Y397F, we found a strong mutation-induced reduction in the expression of osteopontin (SPP1; Fig. 1F), an Arg-Gly-Asp (RGD) tripeptide-containing ligand of FN-binding integrins involved in angiogenesis and bone formation (15). Together, our data showed that the FAK FERM-kinase linker is required for normal mesoderm development and the expression of FN-type ECM.
FAK Proline-Rich Region 1 Binds Myosin 1E Through Arginine 358 and Prolines 371 and 374.
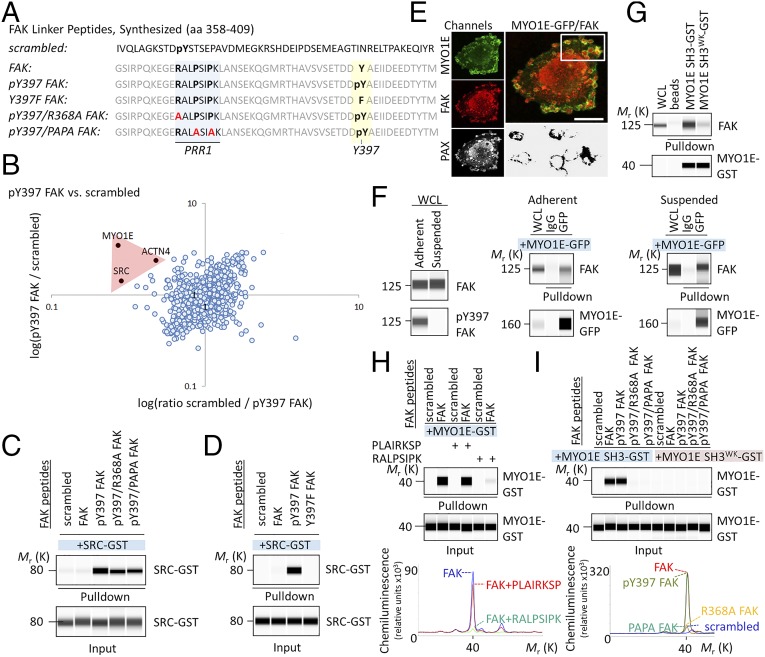
Next, we wanted to define the protein complex that forms at the FERM-kinase linker to promote FAK function through Y397 and induce FN-type ECM. To identify FAK linker interacting protein(s), we used stable isotope labeling by amino acids in cell culture (SILAC), followed by pull-down experiments with synthesized FAK linker peptide (amino acids 358–409; Fig. 2A) or scrambled peptide (to identify nonspecific interactors). Protein identification and quantification was by mass spectrometry-based proteomics. Among proteins that bound specifically to phospho-Y397 FAK peptide were SRC, actinin-4 (ACTN4), and myosin-1E (MYO1E) (Fig. 2B). Of these proteins, only MYO1E bound to nonphosphorylated FAK peptide versus scrambled peptide (Fig. S2A) and equally well to phospho-Y397 and nonphosphorylated FAK peptides (Fig. S2B). To test whether the binding of SRC, MYO1E, and ACTN4 to FAK peptides was direct or indirect, we produced GST-tagged recombinant protein and pursued in vitro binding studies. We found that recombinant GST-tagged ACTN4 did not bind FAK peptides directly. In agreement with the proteomics data, full-length SRC-GST precipitated with phospho-Y397, but not nonphosphorylated FAK peptide (Fig. 2C) or FAK Y397F peptide (Fig. 2D).
Fig. 2.
MYO1E binds FAK at PRR1. (A) Amino acid (aa) sequence of synthesized FAK peptides. (B) Scatter plot of phospho-Y397 FAK peptide versus scrambled peptide pull-down results. The log SILAC ratio of proteins identified with at least two unique peptides in each mass spectrometry run is plotted as the forward pull-down (x axis) against the reverse labeling pull-down (y axis). Specific interaction partners show inverse ratios between forward and reverse experiments, grouping them into the upper left quadrant. (C and D) Pull-down of recombinant SRC-GST by FAK peptides. (E) Immunostaining of MYO1E-GFP–expressing WM858 cells. (Lower Right) Area of MYO1E/FAK colocalization. (Scale bars, 10 μm.) (F) Coimmunoprecipitation of FAK by MYO1E-GFP from whole-cell lysates (WCL) of adherent or suspended WM858 cells. (G) Pull-down assay demonstrating MYO1E SH3 binding to FAK. A tryptophan (W) to lysine (K) mutation at position 1088 (W1088K; WK) in MYO1E SH3 prevented MYO1E SH3 binding to FAK. (H) FAK PRR1 peptide RALPSIPK, but not scrambled PLAIRKSP, blocks FAK interaction with MYO1E SH3. Chemiluminescence spectra for the indicated pull-downs are shown. (I) Pull-down of recombinant MYO1E SH3-GST by FAK peptides. Chemiluminescence spectra are shown. Immunoblots are pseudoimages generated by ProteinSimple Compass software.
Fig. S2.
MYO1E binds equally well to Y397-phosphorylated FAK peptide and nonphosphorylated FAK peptide. (A) Scatter plot of nonphosphorylated FAK FERM-kinase domain linker peptide versus scrambled peptide pull-down results using WM858 melanoma cell lysate. The log SILAC ratio of proteins identified with at least two unique peptides in each mass spectrometry run is plotted as the forward pull-down (x axis) against the reverse labeling pull-down (y axis). MYO1E binds with a high ratio to nonphosphorylated WT FAK peptide over scrambled peptide. (B) Scatter plot of Y397-phosphorylated FAK FERM-kinase domain linker peptide versus nonphosphorylated FAK peptide pull-down results using WM858 melanoma cell lysate. Forward and reverse pull-downs result in MYO1E SILAC ratios around 1, indicating equal binding of MYO1E to both peptides.
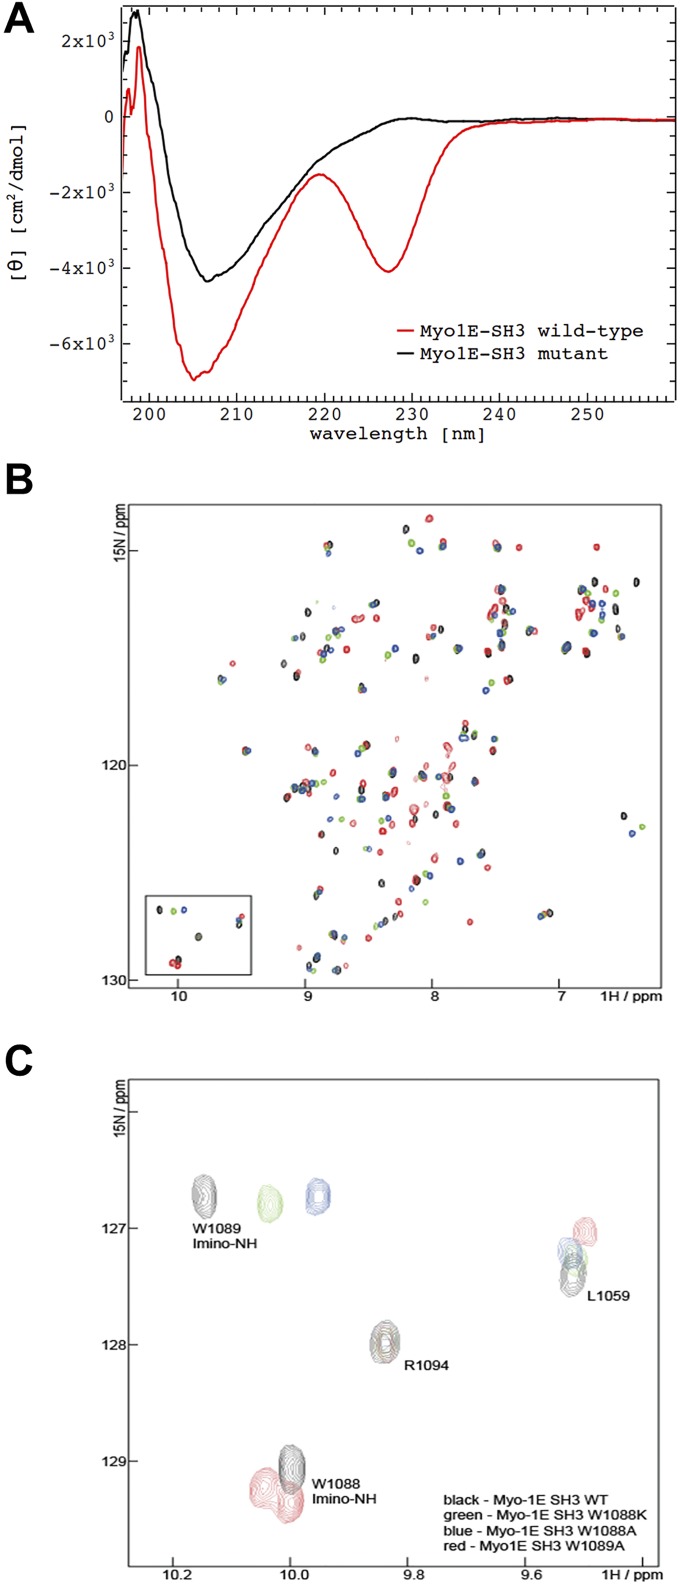
MYO1E, the third identified FAK interacting protein, is one of only two class I myosins that contain an SH3 domain (16). MYO1E has previously been shown to localize to integrin adhesions (17) and to colocalize with paxillin in cancer cell invadosomes (16), where it promotes receptor-mediated endocytosis (18). In WM858 melanoma cells, a BRAFV600E cell line that expresses high amounts of FN and SPP1 (19), MYO1E organized into rosette-like structures surrounding a paxillin core (Fig. 2E). FAK and MYO1E colocalized in a confocal plane at the interface of the core and rosette (Fig. 2E). Endogenous FAK from adherent or suspended cells coimmunoprecipitated with full-length MYO1E irrespective of FAK Y397 phosphorylation (Fig. 2F) and was pulled down by recombinant GST-tagged wild-type MYO1E SH3, but not by mutated MYO1E SH3, harboring a tryptophan (W)-to-lysine (K) mutation at position 1088 (W1088K; Fig. 2G). The folding of this mutant was confirmed by circular dichroism and NMR (Fig. S3). Moreover, recombinant MYO1E SH3 bound directly to the synthesized and bead-immobilized FAK linker (amino acids 358–409; Fig. 2H). This interaction was almost completely disrupted by the addition of RALPSIPK (Fig. 2H), an octapeptide uniquely found in FAK proline-rich region 1 (PRR1) and sufficient to bind MYO1E SH3 (Fig. S4). No effects on MYO1E SH3 binding could be observed upon addition of the scrambled PLAIRKSP peptide (Fig. 2H). Because these findings indicated that MYO1E binds PRR1 of FAK, we next synthesized peptides with point mutations in critical PRR1 residues: mutations in arginine (R) 368, which is thought to form a salt bridge with E1070 of MYO1E, and in prolines (P) 371/374, which likely adopt a polyproline type II helical structure that interacts with the MYO1E SH3 domain. Results showed that the R368A mutation, as well as the PP371/374AA (PAPA) mutation, inhibited FAK binding to wild-type MYO1E SH3 (Fig. 2I).
Fig. S3.
Assessment of folding of recombinant MYO1E SH3 domains by circular dichroism and NMR. (A) Circular dichroism spectra of recombinant WT and W1088K MYO1E SH3 domains (after GST-tag removal). Results indicate folded proteins. (B and C) Assignment of the tryptophane side-chain imine peaks: NMR spectra of MYO1E SH3 WT (black), W1088A (blue), 1088K (green), and 1089A (red) in the absence of peptide. (B) Overlay of the spectra in the imino region demonstrates that the bottom imino peak is absent in the spectra of W1088A and W1088K, thus indicating that this peak corresponds to W1088. Vice versa, the top imino peak is absent in W1089A. In this mutant, the W1088A peak displays peak splitting, which can be attributed to the poorer spectral quality of this mutant. (C) Overlay of the whole spectra of Myo-1E SH3 WT and tryptophane mutants. The spectra of W1088A and W1088K display well-dispersed peaks that partially overlap with the WT protein. This finding indicates that these mutants are well folded and adopt the same fold as the WT protein. The spectrum of W1089A (red) displays poorer spectral quality and some peak splitting.
Fig. S4.
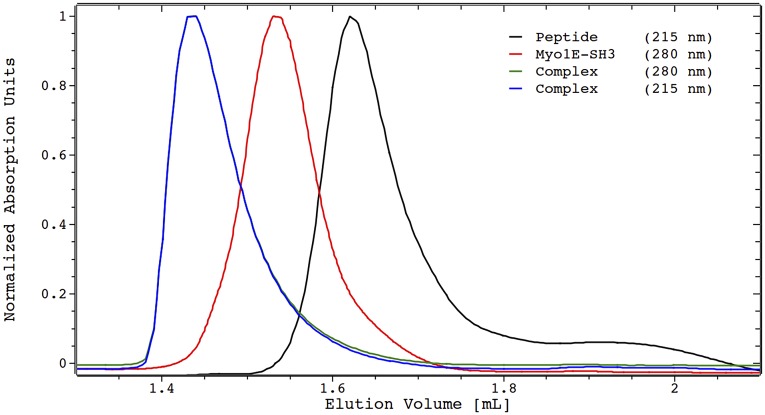
Analytical SEC demonstrates complex formation between the recombinant MYO1E-SH3 domain (after GST-tag removal) and RALPSIK peptide in solution.
Structural Analysis of the MYO1E SH3–FAK PRRI Interaction.
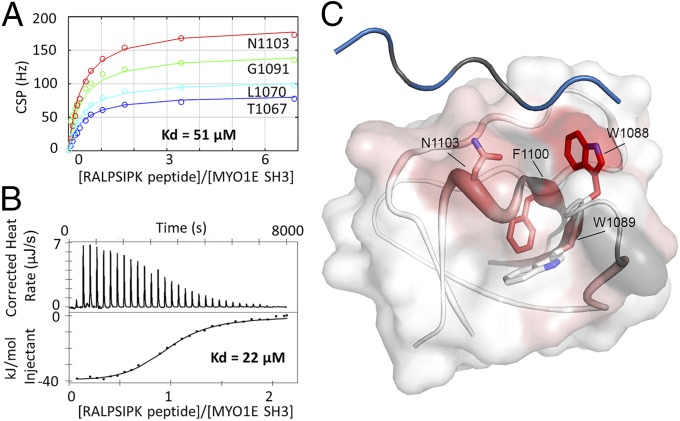
We next used NMR spectroscopy and isothermal titration calorimetry (ITC) to determine the dissociation constant (Kd) of the MYO1E SH3–FAK PRR1 interaction. Recombinant 15N-labeled apo MYO1E SH3 showed a very high-quality NMR spectrum with well-dispersed peaks indicating a folded and monomeric protein. Upon addition of RALPSIPK peptide, peaks affected by the interaction shifted due to changes in the environment of affected amino acids. The chemical shift perturbations (CSPs) of four peaks observed during titration were used to determine the Kd of the interaction at 51 μM (Fig. 3A). The Kd determined by NMR was then used to define the setup of two independent ITC experiments, which yielded a Kd of 22 ± 1 μM (Fig. 3B), confirming the order of magnitude of the affinity of this interaction. These affinities were similar to the affinities of the SRC SH3–FAK PRR1 interaction with reported Kds between 32 and 63 μM depending on method (20). To investigate the mode of interaction between FAK PRR1 and MYO1E SH3, we assigned the peaks in the 1H15N spectrum; we then quantified the CSPs and mapped them on the structure of human MYO1E SH3 [Protein Data Bank (PDB) ID code 2XMF] (Fig. 3C). Although CSPs are spread throughout the domain, the part of the protein most affected by the binding clusters to one region, exemplified by the strong shifts in residues W1089, F1100, N1102, and N1103. Additionally, we assigned the peaks corresponding to the side chain imines of W1088 and W1089 (Fig. S3B), and found that the side chain of the crucial residue, W1088, displays a very large CSP, even though the perturbation of the backbone amide is only moderate. This binding surface is in accordance with the canonical binding surface of proline-rich peptides on SH3 domains, located in-between the RT loop and the n-Src loop on the C-terminal helix. Superposition of the MYO1E SH3 domain with the structure of the SRC SH3 domain in complex with a class 1 peptide confirms this mode of interaction. This model underlines the importance of peptide residues R368, P371, and P374 for the interactions that were observed in pull-down experiments.
Fig. 3.
Structural analysis of the RALPSIPK–MYO1E interaction. (A) Quantification of CSPs as determined by NMR during peptide titration based on four resonances (L1070, G1091, N1003, and T1067). The combined fit yields an affinity of Kd = 51 μM. (B) ITC experiment of MYO1E SH3 with RALPSIPK peptide. The experimental Kd determined by ITC is 22 ± 1 μM with thermodynamic parameters of dH = −43.0 ± 2.2 kJ/mol (n = 0.94 ± 0.02) and dS = −55 ± 8 J/(mol * K). (C) CSPs on MYO1E SH3 upon binding of RALPSIPK peptide and modeled class 1 peptide. CSPs are mapped on the crystal structure of MYO1E SH3 (PDB ID code 2XMF). Increasing color and diameter of the cartoon indicate higher CSP of the corresponding backbone amide. Additionally, the CSP of the tryptophane imides is depicted as the color of the surface representation. Prolines are depicted in gray because they do not appear in the NMR 1H15N spectra. The position of the depicted class 1 peptide is derived from the structure of chicken SRC SH3 domain in complex with a proline-rich peptide by superimposing the MYO1E SH3 with the chicken SRC SH3 domain (PDB ID code 1RLQ).
Myosin 1E Induces FAK Kinase Activity and Downstream SPP1 Expression in Fibroblasts.
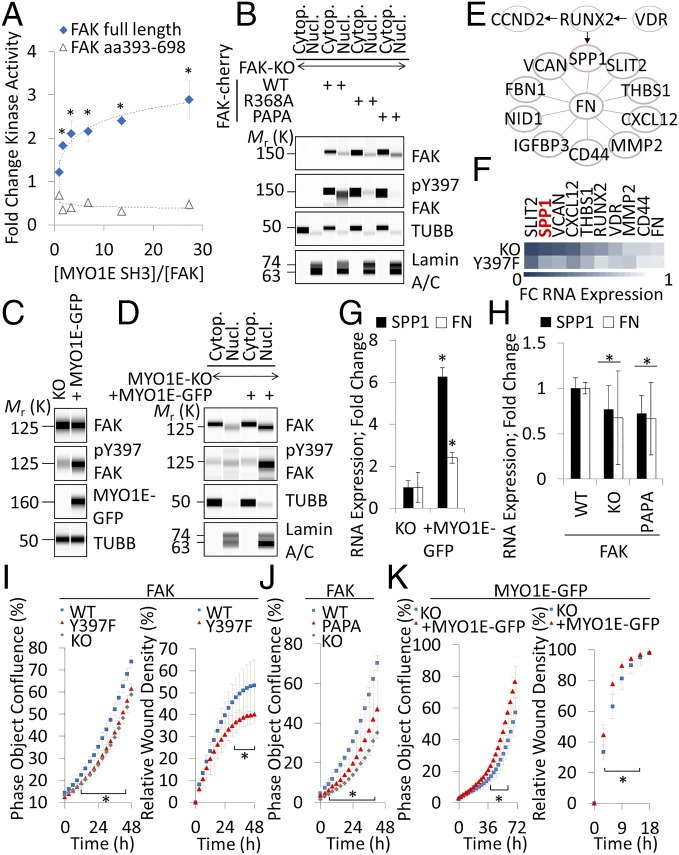
To test whether MYO1E SH3 induces FAK kinase activity, we performed in vitro FAK kinase reactions in the presence of 1:2 titrated MYO1E SH3. When MYO1E SH3 was incubated with full-length FAK, kinase activity increased several fold (Fig. 4A). An increase in kinase activity was not observed when MYO1E SH3 was incubated with FAK kinase domain (amino acids 393–698) devoid of FAK PRR1 (Fig. 4A). To test whether FAK PRR1 induces FAK Y397 autophosphorylation in cells, we reconstituted FAK-null fibroblasts with PRR1-mutated FAK. Immunoblots revealed a significant reduction in phospho-Y397 FAK with the PAPA or R368A mutation. When separating nuclear from cytoplasmic fractions, R368A or PAPA-induced reductions in phospho-Y397 FAK were in the nuclear compartment (Fig. 4B). Conversely, reexpression of MYO1E in MYO1E-null fibroblasts increased FAK Y397 phosphorylation (Fig. 4C). Specifically, MYO1E promoted the nuclear accumulation of total and phospho-Y397 FAK (Fig. 4D).
Fig. 4.
MYO1E activates FAK to induce SPP1 expression in fibroblasts. (A) In vitro FAK kinase activity of full-length recombinant FAK versus FAK kinase domain only (aa 393–698) in the presence or absence of 1:2 titrated recombinant MYO1E SH3 (mean ± SEM, n = 4; *P < 0.05 versus no MYO1E SH3). (B) Effects of FAK PRR1 mutations on nuclear (Nucl.) and cytoplasmic (Cytop.) FAK in transiently transfected fibroblasts. (C) Immunodetection of the indicated antigens in stably MYO1E-GFP–reconstituted MYO1E-null mouse embryonic fibroblasts. (D) Nuclear versus cytoplasmic localization of FAK in MYO1E-null (KO) or WT MYO1E-GFP–reconstituted fibroblasts. (E) Network of differentially regulated FN-associated genes. Arrows and lines indicate a functional relationship as determined by STRING. (F) Color-coded ratios of mRNA expression as quantified by RNA sequencing in FAK-null (KO) or Y397F-reconstituted fibroblasts over WT. FC, fold change. RNA expression of the indicated genes in MYO1E-null (KO) or WT MYO1E-GFP–reconstituted fibroblasts (G) or FAK-null fibroblasts transiently reconstituted with WT or PAPA FAK (H) is shown. Gene expression was determined by quantitative PCR (mean ± SD, n ≥ 4; *P < 0.05). (I–K) Phase object confluence or Matrigel invasion of the indicated reconstituted and nonreconstituted KO fibroblasts (mean ± SD, n = 4; *P < 0.05, Student’s t test). Immunoblots are pseudoimages generated by ProteinSimple Compass software.
Because phospho-Y397 FAK was abundant in the nucleus of MYO1E-reconstituted cells, we next tested whether FAK Y397 promoted the expression of FN-type ECM as observed in FAK Y397F embryos. Total sequencing of RNA from FAK-null or FAK-reconstituted wild-type or Y397F fibroblasts yielded ∼41,000 sequenced genes. Two hundred seventy-two genes were in a union of genes differentially expressed in FAK-null versus wild-type fibroblasts and FAK wild-type versus Y397F fibroblasts (Dataset S1). One hundred one genes had lower expression in FAK-null and Y397F cells compared with FAK wild-type cells, and thus depended on Y397 for their up-regulation; functional association analysis of these 101 genes by STRING (string-db.org) revealed an FN-centered cluster (Fig. 4E). One of the most highly FAK-induced genes was SPP1 (Fig. 4F). In line with these data, reexpression of MYO1E in MYO1E-null fibroblasts induced SPP1/FN mRNA (Fig. 4G), whereas SPP1/FN mRNA was reduced in the presence of FAK PAPA compared with wild-type FAK (Fig. 4H). Consistent with the role of FN and SPP1 in promoting cell proliferation and invasion, FAK Y397F fibroblasts grew less confluently and invaded less well into Matrigel than wild-type controls (Fig. 4I). Likewise, FAK PAPA fibroblasts grew less confluently than wild-type controls (Fig. 4J). Conversely, MYO1E-reconstituted fibroblasts grew more confluently and invaded faster into Matrigel than MYO1E-null controls (Fig. 4K).
MYO1E/FAK Induces SPP1 Promoter Activity and Proliferation in Melanoma Cells.
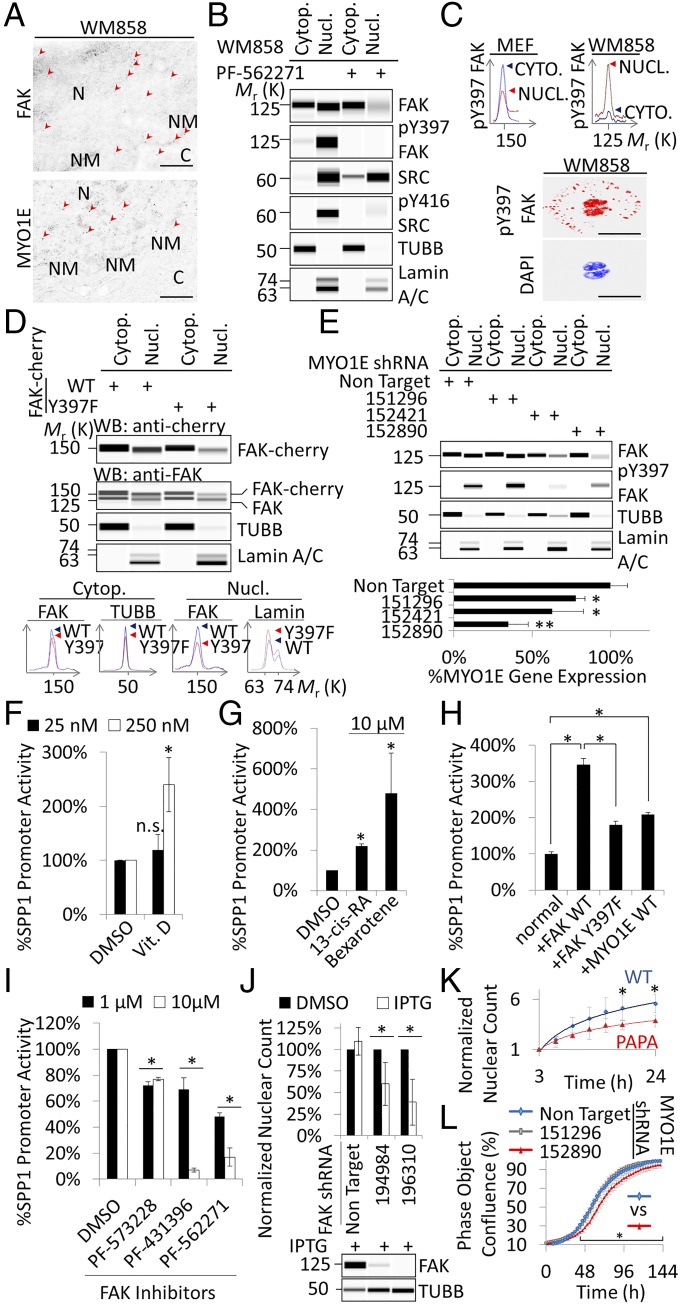
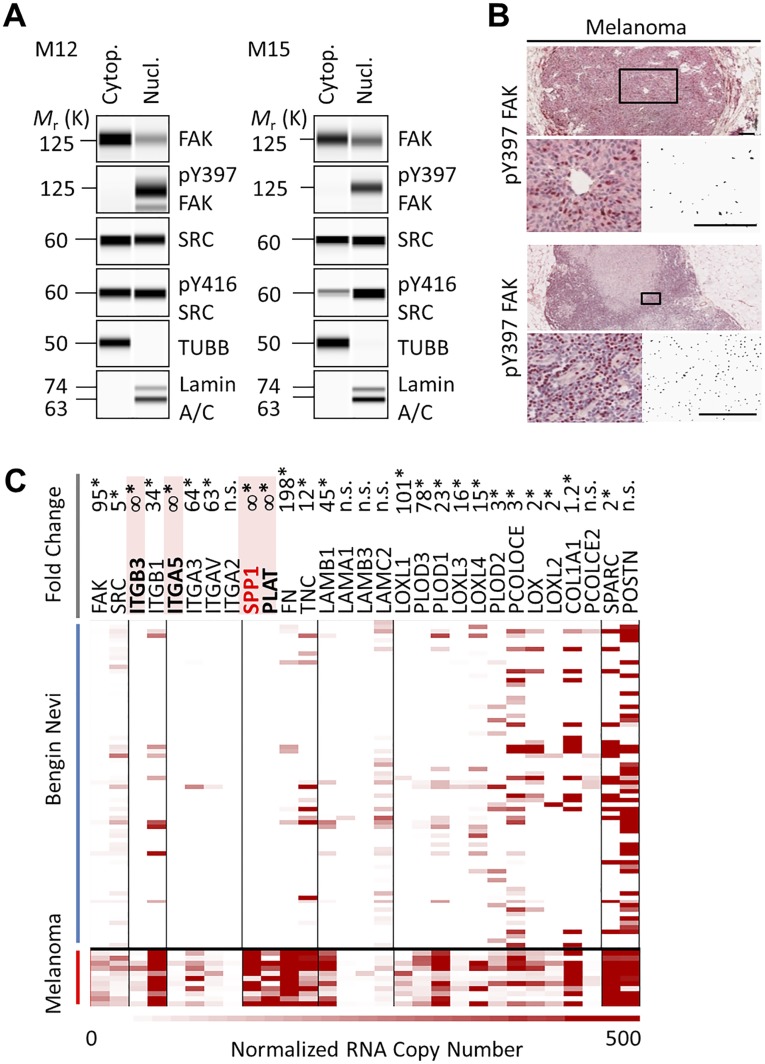
FAK and MYO1E could be visualized in the cytoplasm and nucleus of WM858 melanoma cells by postembedding immunogold electron microscopy (Fig. 5A). In these SPP1/FN high-expressing cancer cells (19), the nuclear-to-cytoplasmic phospho-Y397 FAK ratio was high (Fig. 5B) compared with wild-type FAK-cherry reconstituted mouse embryonic fibroblasts (Fig. 5C). High levels of nuclear phospho-Y397 FAK were also observed in patient-derived melanoma xenograft cell lines M12 and M15 and patient-derived in-transit cutaneous melanoma metastases (Fig. S5). To test whether Y397 phosphorylation promotes FAK nuclear accumulation, WM858 cells were treated with the FAK kinase inhibitor PF-562271, which prevented FAK Y397 phosphorylation. We found that nuclear FAK was reduced in the presence of PF-562271, as was nuclear SRC (Fig. 5B). Moreover, in WM858 cells that expressed wild-type or Y397F FAK-cherry, nuclear Y397F was reduced compared with wild type (Fig. 5F), indicating that the Y397F mutation interferes with nuclear FAK accumulation. Likewise, total and phospho-Y397 nuclear FAK was reduced in cells with reduced MYO1E mRNA due to effective MYO1E shRNA derived from RNAi Consortium (TRC) clones 152421 and 152890 versus ineffective shRNA from clone 151296 and nontargeting control shRNA (Fig. 5G).
Fig. 5.
MYO1E/FAK drives SPP1 expression and proliferation in melanoma cells. (A) Immunogold electron microscopy micrographs of WM858 cells. Arrowheads point to areas of electron-dense immunolabeling. C, cytoplasm; N, nucleus; NM, nuclear membrane. (Scale bar, 0.5 μm.) (B) Analysis of nuclear and cytoplasmic protein extracts from WM858 cells in the presence or absence of 2.5 μM PF-562271. (C, Top) Phospho-Y397 FAK chemiluminescence spectra of fractionated lysates of the indicated cell types. MEF, mouse embryonic fibroblast. (C, Bottom) WM858 cell stained for phospho-Y397. Note high levels of phospho-Y397 FAK in the nucleus. (Scale bars, 40 μm.) (D) Analysis of nuclear and cytoplasmic protein extracts from WM858 cells carrying stable WT or Y397F FAK-cherry. Chemiluminescence spectra for the indicated subcellular fractions, antibodies, and cells are shown. WB, Western blot. (E) Effects of MYO1E shRNA-mediated knockdowns on FAK levels in WM858 cells. Knockdown efficacy was determined by quantitative PCR (mean ± SD, n = 3; *P < 0.05, **P < 0.001 versus nontargeting shRNA). SPP1 promoter activity after overnight exposure of Dual-Glo cells to vitamin (Vit.) D (F) or retinoids (G) is shown (mean ± SD, n = 3; *P < 0.05). n.s., not significant. (H) SPP1 promoter activity in normal (unmodified) Dual-Glo cells or cells with stable expression of the indicated FAK or MYO1E constructs (mean ± SD, n = 16; *P < 0.001). (I) SPP1 promoter activity after exposure of Dual-Glo cells to FAK inhibitors (mean ± SD, n = 3; *P < 0.05). (J) Proliferation of WM858 cells as determined by automated counting of fluorescent nuclei in the presence or absence of shRNA targeting FAK, inducible by isopropyl β-d-1-thiogalactopyranoside (IPTG) (mean ± SD, n = 3; *P < 0.05). TUBB, β-tubulin. (K) Proliferation of WM858 cells depleted of endogenous FAK by shRNA TRCN196310 and transiently reconstituted with murine FAK-cherry (mean ± SD, n ≥ 3; *P < 0.05). (L) Proliferation of WM858 cells in the presence or absence of MYO1E shRNA (mean ± SEM, n = 12; *P < 0.05). Immunoblots are pseudoimages generated by ProteinSimple Compass software.
Fig. S5.
(A–C) Nuclear localization of phospho-Y397 FAK correlates with FN-type gene expression in melanoma. Cytop. cytoplasm; Nucl., nuclear.
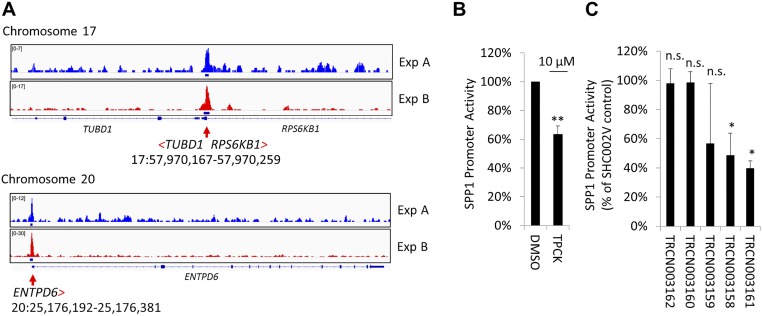
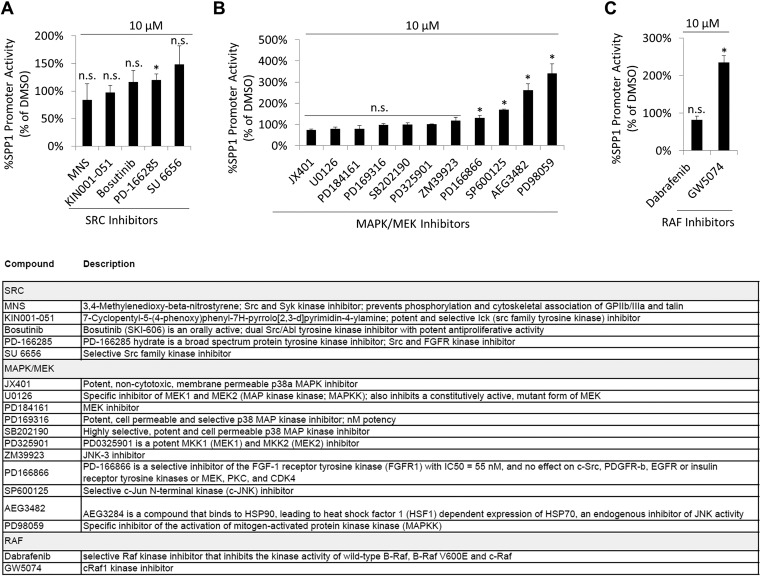
To investigate whether nuclear FAK promotes FN-type ECM expression in WM858 cells, we performed six chromatin immunoprecipitation with massively parallel DNA sequencing (ChIP-seq) experiments. These experiments revealed that FAK associates with the consensus binding sequence GCGC[AC]TGCGC. This binding sequence is highly similar to the optimal binding site for nuclear respiratory factor 1 (NRF1), (T/C)GCGCA(C/T)GCGC(A/G) (Fig. S6), which coregulates promoter activity of SPP1 family genes (21). To test whether FAK drives SPP1 promoter activity, we tagged the endogenous SPP1 promoter in WM858 cells with a dual-luciferase reporter (Dual-Glo cells). Firefly luciferase was introduced to assay SPP1 promoter activity, and Renilla luciferase was coupled to the CMV promoter as a loading control. As expected, the SPP1 promoter was activated by vitamin D, because it was shown to harbor vitamin D response elements (22) (Fig. 5H). Retinoic acid receptor agonists, reported previously to induce SPP1 (23), also induced SPP1 promoter activity (Fig. 5I), as did stable overexpression of FAK wild type-cherry and MYO1E-GFP (Fig. 5J). We then performed an unbiased screen of pharmaceutically active compounds to identify compounds that inhibit SPP1 promoter activity. We found that the structurally related FAK kinase inhibitors PF-431396 and PF-562271 were among a handful of drugs that strongly inhibited SPP1 promoter activity (Fig. 5K). Another structurally unrelated FAK inhibitor, PF-573228, was less potent. Interestingly, neither SRC kinase inhibitors nor small-molecule inhibitors of mitogen-activated or rapidly accelerated fibrosarcoma kinases (RAFs) inhibited SPP1 promoter activity (Fig. S7).
Fig. S6.
FAK ChIP-seq in WM858 melanoma cells. We sought to determine whether FAK associates with specific promoters in WM858 cells by using ChIP-seq. Three FAK antibodies detected 182 partially overlapping peaks in six ChIP-seq experiments, and 74 were detected in two independent experiments. (A) Exemplary promoter regions identified with high fidelity and within 2 kb of the transcription start site are shown and include the RPS6KB1 promoter. Based on 182 peaks detected, we determined the following consensus binding sequence: GCGC[AC]TGCGC. This binding sequence is highly similar to the optimal binding site for nuclear respiratory factor 1 (NRF1), (T/C)GCGCA(C/T)GCGC(A/G), which activates the expression of key metabolic genes. (B) To test whether the RPS6KB1 gene product, ribosomal S6 Kinase 1 (S6K1), helps drive SPP1 promoter activity, we exposed WM858 Dual-Glo cells to N-p-Tosyl-l-phenylalanine chloromethyl ketone (TPCK), a p70S6 kinase inhibitor. TPCK inhibited SPP1 promoter activity by ∼40%. SPP1 promoter activity after overnight TPCK treatment of WM858 cells is shown (mean ± SD; n = 3; **P < 0.001). (C) Likewise, two of five RPS6KB1-directed TRC shRNAs significantly inhibited SPP1 promoter activity. Effects of various TRC clone-derived RPS6KB1 shRNAs on SPP1 promoter activity are shown (mean ± SD; n = 2; *P < 0.05). n.s., not significant.
Fig. S7.
MAPK pathway does not drive SPP1 expression in WM858 melanoma cells. SPP1 promoter activity after exposure of WM858 Dual-Glo cells to SRC inhibitors (A), MAPK/MEK inhibitors (B), or RAF inhibitors (C) overnight is shown (mean ± SD; n = 3; *P < 0.05). A brief description of compounds used is provided. P values, Student’s t test.
SPP1 promotes melanoma cell proliferation and tumor growth (24). Exposure of WM858 or M12 cells to PF-562271 inhibited proliferation, as determined by automated counting of fluorescently labeled nuclei with a half-maximal effective concentration of 0.3 ± 0.1 μM. Likewise, isopropyl β-d-1-thiogalactopyranoside–inducible shRNA targeting FAK in WM858 cells inhibited proliferation (Fig. 5L). When FAK-depleted cells were transiently reconstituted with either wild-type or PAPA mutant murine FAK, wild-type cells proliferated faster (Fig. 5M). Moreover, knockdown of MYO1E using effective shRNA TRCN152890, but not ineffective shRNA TRCN151296 or nontargeting control shRNA, inhibited proliferation of WM858 cells (Fig. 5N). Together, these data are consistent with a model where upon MYO1E interaction with FAK in melanoma cells, FAK becomes activated and accumulates in the nucleus to induce SPP1 promoter activity and proliferation. In line with this model, nuclear phospho-Y397 FAK–positive cutaneous melanoma expressed higher levels of SPP1 than nuclear phospho-Y397 FAK–negative precursor tissue (Fig. S5). Moreover, in cutaneous melanoma, mitotic rate is an independent adverse predictor of survival (25), indicating a possible role for MYO1E/FAK-driven cancer cell proliferation in prognostically important processes.
Discussion
In the present study, we found that FAK function in vivo critically depends on the release of FAK kinase autoinhibition and dependent Y397 autophosphorylation. Moreover, FAK kinase activity is induced by a direct interaction of MYO1E and FAK. Once the FAK kinase domain is released from autoinhibition, SRC binds to phospho-Y397, thereby stabilizing the release of autoinhibition (9). Full catalytic activity in turn leads to nuclear accumulation of FAK, and transcription of FAK target genes such as SPP1 and FN.
We identified MYO1E as a FAK PRR1 interactor. In contrast to SRC, MYO1E binds the FERM-kinase linker in the absence of phospho-Y397. MYO1E SH3-mediated autoinhibition of MYO1E motor function (26) may be released by MYO1E binding to FAK. MYO1E binding to FAK then tethers FAK to actin, which may promote endocytosis (18) and could explain why FAK function is tightly linked to actomyosin dynamics and integrin endocytosis (10, 27). Upon FAK Y397 autophosphorylation, SRC binds FAK through SH2 domain interaction, which, in turn, releases SRC SH3 to interact with FAK PRR1, thereby possibly replacing MYO1E. Simultaneous binding of SRC SH2 and SH3 to FAK linker profoundly increases affinity versus SH2 binding alone (20). In the absence of phospho-Y397, the affinity of MYO1E SH3 for FAK PRR1 octapeptide RALPSIPK is only marginally higher than the affinity of SRC SH3. However, in peptide pull-down experiments using full-length nonphosphorylated FAK linker peptide, SRC is not easily precipitated (via its SH3 domain) in the absence of Y397 phosphorylation. This finding suggests that the affinity of full-length SRC for FAK linker is lower than the affinity of recombinant SRC SH3 (28), specifically in the absence of SH2 binding to phospho-Y397, or that MYO1E and FAK interact at additional sites outside of the RALPSIPK sequence either directly or indirectly that have yet to be determined.
The ability of MYO1E/FAK to influence matrix composition is consistent with in vivo MYO1E/FAK mutant phenotypes. Normal epidermis, which is avascular and does not depend on FN receptors and ligands, is unaffected by changes in MYO1E or FAK function (6, 29). On the other hand, complex mesenchymal processes such as neovascularization require the induction of an FN-based ECM (30) and are affected by FAK (31) or MYO1E loss of function (29). Cancer cells produce an FN-rich fibrotic matrix to facilitate metastasis, and both FAK (4, 7) and MYO1E (32) promote carcinogenesis in murine cancer models. In addition, MYO1E protects kidney podocytes from mechanical stress-induced injury, as does SPP1, which may be induced by FAK (33, 34). Moreover, keloid formation (i.e., a wound-healing reaction with excessive scar formation) has been associated with MYO1E (35) and FAK function (36). MYO1E/FAK-induced SPP1 may play a role in keloid formation because SPP1 is known to drive tissue fibrosis (37).
Melanoma expresses high levels of SPP1 and other FN-type ECM, which, in turn, promotes metastasis (19, 38). Consistent with a role of nuclear phospho-Y397 FAK in driving SPP1 expression, we found high levels of phospho-Y397 FAK in the nucleus of patient-derived melanoma tissues and cell lines. In mouse embryonic fibroblasts, phospho-Y397 FAK was abundant in the cytoplasm. Other authors have reported a predominantly cytoplasmic localization of phospho-Y397 FAK [e.g., in human umbilical vein endothelial cells (3)]. The molecular basis for this discrepancy is not well understood but may involve MYO1E. Future research must address the mechanisms that drive the nuclear shuttling of FAK to provide additional insight into medically relevant processes that rely on ECM remodeling.
Materials and Methods
Patient Material, Mouse Work, and Cell Lines.
All animal studies were approved by the Institutional Animal Care and Use Committee at the Mayo Clinic. Patient studies were approved by the Mayo Foundation Institutional Review Board. A consent waiver was obtained based on US Department of Health and Human Services regulations. Details on plasmids, constructs, cell lines, transient and stable transfection/transduction techniques, timed matings, embryo isolation, whole-mount 3D imaging of embryos, quantitative microfluidic PCR, gene expression by RNA sequencing, proliferation and Matrigel invasion assays, immunocytochemistry, immunohistochemistry, ChIP-seq, and FAK kinase assays are provided in SI Materials and Methods.
Pharmaceutically Active Compounds and Antibodies.
Details on drugs and antibodies are provided in SI Materials and Methods.
SILAC-Based Peptide Pull-Downs.
SILAC labeling of WM858 melanoma cells was by 13C6 l-lysine and 13C6, 15N4 l-arginine. Proteins were precipitated as described previously (39).
NMR Spectroscopy.
NMR spectra were recorded at 25 °C on a Bruker AVIII-600 spectrometer with a room temperature probe head. Details on NMR and the expression and purification of recombinant proteins are provided in SI Materials and Methods.
ITC.
Binding constants were determined using a NanoITC instrument (TA Instruments). Details are provided in SI Materials and Methods.
Nuclear Extractions.
Separation of the nuclear fraction from the cytoplasmic fraction of cells was achieved using a kit (40010; Active Motif) and following the manufacturer’s instructions. Details on coimmunoprecipitation, GST pull-downs, and microfluidic Western blots by ProteinSimple are provided in SI Materials and Methods.
Statistics.
Statistical analysis was performed using GraphPad Prism software (version 6.05; GraphPad Software). Statistical significance was determined as indicated.
SI Materials and Methods
Mouse Strains and Patient Material.
Targeting of embryonic stem cells and mouse chimera production was through the Mayo Clinic Transgenic Core Facility.
Formalin-fixed, paraffin-embedded primary biopsy material was obtained from the Mayo Clinic tissue archive. A discovery cohort of patients (38) was used for a focused examination of the differences in adhesion gene expression between benign cutaneous nevi and melanoma in-transit metastases. This study was approved by the Mayo Foundation Institutional Review Board (11-6390) as a minimal risk study. A patient consent waiver was obtained.
Pharmaceutically Active Compounds and Antibodies.
All pharmaceutically active compounds were acquired from Sigma–Aldrich except PF-562271, which was purchased from Selleck (S2890). The following antibodies were used for immunoprecipitation and/or microfluidic Western blot analysis by ProteinSimple (PS), immunohistochemistry (IHC), or immunofluorescence (IF): CD31 (553371, MEC13.3; BD Biosciences; 1:500 for IF), FN (ab2413; Abcam; 1:100 for IHC), Collagen IV (ab6586; Abcam; 1:100 for IHC), Laminin (ab11575; Abcam; 1:100 for IHC, 1:400 for IF), FAK (06-543; EMD Millipore; 1:50 for PS; 1:100 for IF), paxillin (610051, 349; BD Biosciences; 1:100 for IF), phospho-FAK Y397 (AF4528; R&D Systems; 1:200 for PS), phospho-FAK Y397 (44-624G; Thermo Fisher Scientific; 1:100 for IHC), β-tubulin (ab15568; Abcam; 1:50 for PS), SRC (2109, 36D10; Cell Signaling Technology; 1:50 for PS), phospho-SRC Y416 (2101; Cell Signaling Technology; 1:10 for PS), GFP (ab290; Abcam; 1:500 for PS), GST (MA4-004, 8-326; Thermo Fisher Scientific; 1:100 for PS), and Lamin A/C (2032S; Cell Signaling Technology; 1:100 for PS).
NMR Spectroscopy.
NMR spectra were recorded at 25 °C on a Bruker AVIII-600 spectrometer with a room temperature probe head. NMR samples were prepared in 25 mM Hepes (pH 7.5) and 200 mM NaCl in 90% H2O/10% D2O. A titration experiment was carried out by adding increasing amounts of unlabeled RALPSIPK peptide to a 125 μM MYO1E SH3 sample to a molar excess of 1:7. Assignment experiments were recorded on 13C15N-labeled samples at a protein concentration of 4 mM. Assignment was carried out by a combination of HNCA, HNCOCA, HNCO, and CCONH spectra, and all backbone resonances could be assigned unambiguously. NMR data were processed using the NMRPipe-NMRDraw software suite, and figures displaying NMR spectra were produced using NMRViewJ (www.onemoonscientific.com). The binding affinity was determined by fitting a single-site model to the CSP data using an in-house written script. CSPs were calculated as given by:
ITC.
Binding constants were determined using a NanoITC instrument (TA Instruments) at 25 °C in buffer containing 25 mM Hepes (pH 7.5) and 200 mM NaCl. RALPSIPK peptide was injected into MYO1E SH3 with stirring at 250 rpm. Measurements were carried out at 1.4 mM MYO1E SH3 and 16 mM peptide and at 0.38 mM MYO1E SH3 and 2.8 mM peptide, respectively. Data were corrected for dilutional heat of the peptide, processed, and integrated using the NanoAnalyze suite (TA Instruments). A single-site model was used for curve fitting in NanoAnalyze.
Plasmids and Constructs.
A mammalian expression vector harboring cherry-tagged FAK cDNA (cherry-C1-FAK-HA) was a gift from Anna Huttenlocher, University of Wisconsin School of Medicine and Public Health, Madison, WI (Addgene plasmid 35039). Point mutations were introduced by site-directed mutagenesis using the Quikchange II XL Kit (200521; Agilent Technologies). For stable expression in cell lines, cDNA was cloned into the lentiviral expression vector LV022 (Applied Biological Materials). For recombinant expression of GST-tagged MYO1E, we used plasmid pGEX-5X-3 (GE Healthcare Life Sciences). For recombinant expression of GST-tagged ACTN4, we used plasmid pBP-His-GST (PV567919; Applied Biological Systems).
Primary Cells and Cell Lines.
MYO1E-null fibroblasts (lot 3-7) were derived from MYO1E-deficient mice (29) and immortalized using SV40 whole gene (106 IU/mL) delivered by lentivirus (G203; Applied Biological Materials) overnight. The p53−/− FAK knockout mouse embryonic fibroblasts (MEFs; CRL-2644) were purchased from the American Type Culture Collection. WM858 melanoma cells (p53−/−) were purchased from Meenhard Herlyn (Wistar Institute). M12 melanoma cells (BRAFV600E, NRASWT, KRASWT; p53-positive) and M15 melanoma cells (BRAFWT, NRASQ61K, KRASWT; p53-positive) were obtained from patient-derived melanoma brain metastases and maintained as patient-derived xenografts. All cell lines were tested for mycoplasma and viral contamination by the RapidMAP 21 test (Taconic) or the Mayo IMPACT Profile (IDEXX BioResearch). Cell lines were cultured in DMEM containing 10% FBS.
To generate WM858 Dual-Glo human melanoma cells (i.e., WM858 cells with a dual-luciferase–tagged endogenous SPP1 promoter), exon 2 (ENSE00003680042) of SPP1 was targeted for a double-strand break using a custom-made zinc finger nuclease (CSTZFN; Sigma–Aldrich). Specifically, the predicted 42-bp zinc finger nuclease-binding site (capital letters) and cutting site (lowercase letters) were as follows: 5′-CTCCTAGGCATCACCTGTgccataCCAGTGAGTACAGTTGCA-3′. A donor vector with 500-bp homology arms was cloned so that the SPP1 sequence downstream of the endogenous SPP1 ATG start codon (4: 87,976,896; GRCh38.p7) was replaced with luc2P reporter gene, a luciferase gene that contains hPEST, a protein destabilization sequence cloned from pGL4.15[luc2P/Hygro] (E6701; Promega Corporation). Immediately downstream of luc2P, our donor vector contained a mammalian selectable marker for hygromycin, followed by a CMV promoter-driven hRluc Renilla luciferase gene, intended as a loading control. Correct insertion of the donor cassette downstream of the SPP1 ATG start codon was confirmed by PCR and DNA sequencing. Activity of the SPP1 promoter-driven firefly luciferases and the CMV promoter-driven Renilla luciferase was assayed using the Dual-Glo protocol (E2940; Promega Corporation). The firefly signal was normalized to the Renilla signal and then further normalized to a treatment control. Cells were cultured in the presence of 250 μg/mL Hygromycin B (H0654; Sigma–Aldrich). The luciferase signal was measured using white, flat-bottomed, 96-well plates (CLS3362; Sigma–Aldrich), a Varioskan Flash multimode reader (Thermo Scientific) in luminometric measurement mode, a measurement time of 10 s per well, and SkanIt software version 2.4.3.37.
To generate WM858 melanoma cells with MYO1E shRNA or nontargeting control shRNA, WM858 cells were infected with lentiviral particles containing shRNA derived from the TRC clones TRCN0000151296, TRCN0000152421, and TRCN0000152890 or from nontargeting control in pLKO.1-puro-CMV-tGFP vector. For targeting RPS6KB1, cells were infected with lentiviral particles containing shRNA derived from the TRC clones TRCN0000003162, TRCN0000003161, TRCN0000003160, TRCN0000003159, and TRCN0000003158 or from nontargeting control pLKO.1-puro-CMV-U6 vector. For targeting, PTK2/FAK cells were infected with lentiviral particles containing shRNA derived from TRC clones TRCN0000194984 and TRCN0000196310 or from nontargeting control pLKO–puro–isopropyl β-d-1-thiogalactopyranoside (IPTG)–1XLacO vector. Of note the PTK2/FAK-targeting shRNA TRCN0000121207, TRCN0000121318, and TRCN0000121129 were ineffective in WM858 melanoma cells. To induce effective knockdown, cells were cultured in the presence of 50 μM IPTG for at least 5 d. All cells were selected using 0.5 μg/mL puromycin.
Transient and Stable Transfection/Transduction.
For transient transfection of WM858 cells, we used Lipofectamine 2000 or 3000 (Thermo Fisher Scientific) according to the manufacturer’s protocol. To generate stable cell lines, cells were infected with lentivirus in 2 mL of complete medium containing 8 μg/mL polybrene and a virus multiplicity of infection of 2–20. Selection was by 1–1.5 μg/mL puromycin.
Timed Matings and Embryo Isolation.
In all mating procedures, female mice were exposed to male mice overnight. Identification of a vaginal plug the next morning was used to determine E0.5. Staged embryos (E8.5–E16.5) were dissected in ice-cold PBS. Embryos were observed under an Olympus SZX12 Microscope. Small pieces of tail or paw were digested in PBS containing proteinase K at 56 °C for 90 min. Proteinase K was heat-inactivated at 80 °C for 30 min. Two microliters of the sample was used to set up a PCR assay for genotyping.
Whole-Mount 3D Imaging of CD31 in Embryos.
Whole-mount 3D imaging of CD31 was performed as previously described (40). To allow for deep penetration of laser light and confocal sectioning, embryos were dehydrated by increasing methanol concentrations, cleared in benzyl alcohol/benzyl benzoate (1:2). Images were obtained with a Zeiss LSM780 confocal microscope using ZEN software (release 8.0).
Coimmunoprecipitation and GST Pull-Downs.
For coimmunoprecipitation of FAK, 500 μg of WM858 melanoma cell protein lysate containing GFP-tagged MYO1E in Mammalian Protein Extraction Reagent (MPER; 78501; Thermo Fisher Scientific) was diluted in an equal volume of PBS (28372; Thermo Fisher Scientific) and incubated with Protein G-coated magnetic beads (88847; Thermo Fisher Scientific), which were preincubated with 10 μg of rabbit GFP antibody (ab290; Abcam) or 10 μg of rabbit IgG (12-370; EMD Millipore). Incubation was overnight at 4 °C with gentle rotation. Beads were washed in PBS-diluted MPER (4:1 ratio) gently three times, eluted in PS loading buffer, and run on a Wes microfluidic Western blotting system. For GST pull-down of FAK, 10 μg of recombinant GST-tagged MYO1-SH3 domain [GST-MYO1E(SH3)] or GST-tagged tryptophan (W)-to-lysine (K) mutation at position 1088 (W1088K) mutated SH3 domain [GST-MYO1E(SH3WK)] was incubated with glutathione magnetic beads (88821; Thermo Fisher Scientific) for 1 h at 4 °C with gentle rotation. Beads were then incubated with cell lysate as described above at 4 °C with gentle rotation overnight, washed in PBS, eluted in PS loading buffer, and run on a Wes microfluidic Western blotting system.
Expression and Purification of Recombinant Proteins.
Purified GST-tagged SRC was purchased from Sigma–Aldrich (S1076). GST-tagged Myo1E SH3 domain (wild type or W1088K mutated) in vector pGEX-5X-3 (18) or GST-tagged ACTN4 in vector pBP-His-GST (PV567919; Applied Biological Systems) was expressed in Escherichia coli Rosetta 2 cells. Protein-containing bacterial supernatant was applied to a GST Trap FF column (5 mL; GE Healthcare Life Sciences), washed, and eluted. The GST-tagged Myo1E SH3 domain was dialyzed [20 mM Tris, 50 mM NaCl, 2 mM CaCl2 (pH 8.0)] and digested with Factor Xa from New England Biolabs (P8010) at 4 °C for 16 h using 1 μg of the protease to cleave 1 mg of fusion protein. The cleaved protein was isolated by size exclusion chromatography (SEC; SD200/16/60) with SEC buffer [20 mM Hepes, 200 mM NaCl (pH 7.5)] and concentrated to 6 mg/mL. Complex formation was observed on an ETTAN system equipped with a Superdex 200 PC 3.2/30 column using a protein concentration of 1 mg/mL and a 1.6-fold molar excess of the peptide. For circular dichroism measurement, the sample was diluted with deionized water to yield a final concentration of 0.3 mg/mL. Circular dichroism spectroscopy was performed using a JASCO J-720 spectropolarimeter. The mean of 10 protein spectra (300 nm to 190 nm) was corrected by subtracting the buffer spectrum, and the calculated mean residue weight ellipticity was plotted using SciDAVis.
For 15N-labeled protein, a tobacco etch virus (TEV) protease cleavage site was introduced between the GST-tag and Myo1E SH3 domain. This construct was expressed in E. coli Rosetta 2 cells using M9 minimal medium supplied with 15N ammonium chloride as the sole nitrogen source and 13C glucose as the carbon source for double-labeled samples. Fusion protein was affinity-purified as described above. After addition of 1 mM DTT and TEV protease, the protein was incubated overnight at 30 °C to cleave the GST-tag. Pure Myo1E SH3 domain was obtained by SEC (SD75/16/60) with SEC buffer.
For pull-downs, synthetic peptides were immobilized on 100 μL of Dynabeads MyOne Streptavidin C1 (65001; Invitrogen) for 1 h at 4 °C and then incubated with 2 μg of recombinant GST-tagged MYO1E protein on a rotator overnight at 4 °C. For competition experiments, 2 μg of MYO1E-GST and 150 μg of synthesized, unconjugated RALPSIPK peptide (FAK amino acids 368–375) or 2 μg of MYO1E-GST and 150 μg of unconjugated scrambled PLAIRKSP peptide were incubated with FAK peptide (amino acids 358–409) coupled to Dynabeads overnight at 4 °C. Beads were washed twice. Protein was eluted by boiling at 95 ° in PS loading buffer for 5 min. Eluates were separated using PS capillaries.
Microfluidic Western Blotting.
Western blots were performed as Simple Western assays using the Wes system (PS), a combination of capillary electrophoresis and immunodetection techniques, following the manufacturer’s protocols. Quantification of chemiluminescence was based on peak height after correction for a baseline signal. Raw data were generated by Compass software (version 2.5.8–2.7.1, build ID 0201-0826). Compass is the control and data analysis application for Simple Western instruments.
Quantitative Microfluidic PCR.
RNA from patient biopsy-derived paraffin sections was extracted and processed as previously described (38). RNA from mouse embryos was isolated using the RNeasy Plus Mini Kit (74134; Qiagen). One microgram of total RNA was transcribed into cDNA using the iScript cDNA Synthesis Kit (170-8891; Bio-Rad). All cDNA derived from paraffin sections or fresh-frozen material was preamplified using TaqMan Preamp Master Mix (4391128; Applied Biosystems). Quantitative reverse transcriptase PCR was then performed using the Fluidigm BioMark HD system and dynamic array-integrated fluid circuits (Fluidigm). Absolute SPP1 and FN RNA copy numbers in mouse embryos or MEFs were determined using copy number standards (38) and normalized to 106 copies of housekeeping genes (ACTB and RPL8). For some experiments, absolute copy numbers were normalized to a control group. The following primers were used for mouse-derived cDNA amplification by quantitative PCR: ACTB (1)-forward, GGCTACAGCTTCACCACCAC; ACTB (1)-reverse, TAATGTCACGCACGATTTCC; ACTB (2)-forward, TGACCCAGATCATGTTTGAGA; ACTB (2)-reverse, GTACATGGCTGGGGTGTTG; RPL8-forward, AGGCAAAGAGGAACTGCTG; RPL8-reverse, GGATGCTCCACAGGATTCAT; SPP1-forward, TGACCCATCTCAGAAGCAGA; SPP1-reverse, TTCTTCAGAGGACACAGCATTC; FN-forward, GTAGGAGAACAGTGGCAGAA; and FN-reverse, GTGCAGGAGCAAATGGC.
Gene Expression by Next-Generation Sequencing.
FAK MEF RNA was isolated using the RNeasy Plus Mini Kit. RNA sequencing was performed as previously described (38). Briefly, RNA-derived cDNA libraries were prepared using the TruSeq RNA Library Prep Kit v2 (Illumina). Concentration and size distribution of the resulting libraries were determined on an Agilent Bioanalyzer DNA 1000 chip and confirmed by Qubit fluorometry (Life Technologies). Unique indexes were incorporated at the adaptor ligation phase for three-plex sample loading. Libraries were loaded onto paired-end flow cells to generate cluster densities of 700,000 per square millimeter following Illumina’s standard protocol. The flow cells were sequenced as 51 paired-end reads on an Illumina HiSeq 2000 system. The samples were processed through the Mayo RNA-sequencing analysis pipeline, MAP-RSeq. Raw and normalized (reads per kilobase of gene per million mapped reads) gene expression read counts were obtained per sample. Differential gene expression analysis was carried out using the freely available edgeR Bioconductor software package (bioconductor.org). Because scaling by total lane counts can bias estimates of differential expression, edgeR uses trimmed mean normalization on raw read counts to determine whether genes are differentially expressed using the negative binomial method. The Benjamini–Hochberg correction is used to control for multiple testing to obtain a false discovery rate.
Proliferation and Matrigel Invasion Assays.
For proliferation analysis, cells were seeded at low densities (2,500–5,000 cells per well). Cells were incubated using an IncuCyte ZOOM (Essen Bioscience). Cell growth based on percent confluence was determined from phase contrast images. For proliferation assays based on automated counting of fluorescent nuclei, cells were first infected with the NucLight Red reagent (4476; Essen Bioscience) and selected using 1 μg/mL puromycin to obtain a stable nuclear red fluorescent label. Invasion assays were performed by seeding cells at a density of 30,000 cells per well on a thin coating of Matrigel (0.1 mg/mL, standard formulation; Corning) in 96-well ImageLock microplates (4379; Essen BioScience). Cells were then allowed to grow confluent. Before scratching, cell proliferation was inhibited by 30 min of exposure to 10 μg/mL mitomycin C (M4287; Sigma–Aldrich). Monolayers were scratched using the WoundMaker pin tool (4493; Essen BioScience). Medium was changed, and cells were covered in 2 mg/mL Matrigel diluted in complete medium. Relative wound density was calculated using the IncuCyte Scratch Wound Cell Migration Software Module (9600-0012; Essen Bioscience).
Immunocytochemistry and IHC.
For immunocytochemistry, cells were cultured on LAB-TEK II chamber slides (154453; Thermo Scientific), fixed for 10 min in 4% paraformaldehyde (PFA) at room temperature, and stained with a BOND-MAX autostainer (Leica Biosystems). Briefly, slides were washed with 1× Bond Wash solution (Leica Biosystems), and cells were permeabilized for 10 min with 0.1% Triton X-100 in PBS. After washing and blocking with 3% BSA in PBS for 60 min, slides were incubated with a 1:100 dilution of primary antibody in Bond Primary Antibody Diluent (Leica Biosystems) for 90 min. Slides were washed three times for 2 min each time and incubated with a 1:100 dilution of secondary antibody in Bond Primary Antibody Diluent for 60 min. After three 2-min wash steps, DAPI staining was performed for 10 min. Images were collected at room temperature by confocal microscopy (Zeiss LSM780) with a 40×/1.0-N.A. objective using ZEN software (release 8.0). Colocalization of MYO1E/FAK was highlighted using the ZEN software colocalization algorithm using arbitrary cutoffs. For IHC on paraffin sections using phospho-FAK Y397 antibody (44-624G), sections were baked, dewaxed, and exposed to EDTA-based pH 9.0 solution (AR9640; Leica Biosystems) using a BOND-MAX autostainer. Antibody detection was by alkaline phosphatase-linked polymers (DS9390; Leica Biosystems). For IHC on frozen sections using laminin, collagen, or FN antibodies, epitope retrieval was not required. Antibody detection was by secondary Alexa 488-conjugated antibody (1:200 dilution). Stained paraffin sections were digitalized with an Aperio ScanScope (Leica Biosystems). For FAK phospho-Y397–stained slides, an overview and a maximum magnification image were imported into Microsoft Powerpoint (version 14) per case. To generate contrasted images of FAK phospho-Y397 versus background, maximum magnification images were converted to 75% black and white, brightness was set to 50%, and contrast was set to 100%.
Postembedding Immunogold Electron Microscopy.
Cells were fixed in 4% PFA + 2% sucrose. Following fixation, channels were rinsed with 0.1 M phosphate buffer (pH 7.0), dehydrated through a graded series of ethanol, and embedded in LR Gold Resin (EMS). Ultrathin sections (0.09 μm) were labeled with FAK (06-543; EMD Millipore) or GFP antibodies (ab290; Abcam) and with 10 nm of gold-conjugated IgG secondary antibodies (EMS). Micrographs were acquired using a JEOL1400 Plus transmission electron microscope operating at 80 kV.
ChIP-Seq.
DNA–protein complexes in WM858 melanoma cells were cross-linked using fresh 1% formaldehyde for 10 min at room temperature, followed by glycine quenching (125 mM for 5 min at room temperature). Approximately 106 cells were harvested and lysed by incubating in 10 mM Tris⋅HCl (pH 7.5), 10 mM NaCl, and 0.5% Nonidet P-40 lysis buffer for 10 min at 4 °C. Chromatin was first fragmented using micrococcal nuclease at 2000 gel units/mL (New England Biolabs) in 20 mM Tris⋅HCl (pH 7.5), 15 mM NaCl, 60 mM KCl, and 1 mM CaCl2 digestion buffer at 37 °C. After 20 min, the reaction was stopped with 100 mM Tris⋅HCl (pH 8.1), 20 mM EDTA, 200 mM NaCl, 2% Triton X-100, and 0.2% sodium deoxycholate buffer. The chromatin was further fragmented using a Bioruptor sonicator (Diagenode) set at the “high” setting. Fragment sizes were determined using an Advanced Analytical Technologies Fragment Analyzer Automated CE System. Chromatin preparations were reacted with antibodies against FAK (06-543, EMD Millipore; C20, Santa Cruz Biotechnology) or mCherry (ab183628; Abcam) overnight at 4 °C and precipitated using Protein G agarose beads (Roche Diagnostics). After elution of DNA–protein complexes, cross-links were reversed by proteinase K digestion overnight at 62 °C and DNA was purified using the Qiagen PCR Purification Kit. Sequencing libraries were constructed using the NuGEN Ovation Ultralow DR Multiplex System 1-8 (NuGEN Technologies). Briefly, the DNA fragments underwent end repair, barcoded sequencing adapter ligation, purification (Agencourt RNAClean XP beads; Beckman Coulter), and PCR amplification (13 cycles). Final ChIP libraries were sequenced (paired-end, 51 bases per read) on the Illumina HiSeq 2000 platform. Data were analyzed using the HiChIP pipeline. Briefly, paired-end reads were mapped by the Burrows-Wheeler Aligner (BWA) software package, and pairs with one or both ends uniquely mapped were retained. Peaks were called for these samples using the MACS2 software package at a false discovery rate of ≤1%. For data visualization, Bedtools was used in combination with in-house scripts to generate a normalized tag density profile at a window size of 200 bp and step size of 20 bp. Data were visualized using Integrative Genomics Viewer (IGV). The peaks called by MACS2 for all of the samples were multi-intersected using Bedtools to obtain a list of shared peaks that were detected in more than one ChIP experiment. The list of peaks was filtered to remove peaks in the blacklist regions, which may be false peaks because of satellites, telomere repeats, and centromere repeats [blacklist regions from the Encyclopedia of DNA Elements (ENCODE)]. Retained peaks were assigned to genes if they were present in ±2 kb around the translation start site. The MEME Suite was used to discover novel DNA-binding motifs from the peak regions, which were called outside the blacklist regions. The peak region for this analysis was obtained from ±100-bp regions around each peak center. The width of the motif was constrained between 7 and 10 bp.
FAK Kinase Assay.
To assay kinase activity, we used the ADP-Glo Kinase Assay method (V9101; Promega) in combination with the FAK Kinase Enzyme System (V1971; Promega), which included recombinant FAK kinase domain amino acids 393–698 using the manufacturer’s instructions. Full-length recombinant FAK from baculovirus-infected Sf9 cells was obtained from Abcam (ab105909). A 10% ATP-to-ADP conversion at a 100 μM concentration using full-length FAK (SB10 value) at room temperature and 90 min of incubation was achieved by 65 ng of enzyme. To calculate the percentage of enzyme activity, we first subtracted the signal of the negative control (no enzyme and no MYO1E SH3) from sample signals. The 100% kinase activity signal (no MYO1E SH3) was used to calculate fold change in the presence of MYO1E SH3 titration.
Supplementary Material
Acknowledgments
We thank Reinhard Fässler for valuable discussions and Vincent Truffault for assistance in recording NMR spectra. This work was funded by the Mayo Clinic. It was further supported by Lucille and Smith Gibson, William K. Brokken, Arnold and Kit Palmer, and the Gerstner Family. Additional funding was through the German Research Foundation (Grant KFO-274). J.N.S. is supported by the National Cancer Institute of the NIH under Award P50CA108961. M.K. is supported by the National Institute of Diabetes and Digestive and Kidney Diseases of the NIH under Award R01DK083345 and a grant from the Carol M. Baldwin Breast Cancer Research Fund of CNY, Inc.
Footnotes
The authors declare no conflict of interest.
This article is a PNAS Direct Submission.
This article contains supporting information online at www.pnas.org/lookup/suppl/doi:10.1073/pnas.1614894114/-/DCSupplemental.
References
- 1.Ilić D, et al. Reduced cell motility and enhanced focal adhesion contact formation in cells from FAK-deficient mice. Nature. 1995;377:539–544. doi: 10.1038/377539a0. [DOI] [PubMed] [Google Scholar]
- 2.Schiller HB, Friedel CC, Boulegue C, Fässler R. Quantitative proteomics of the integrin adhesome show a myosin II-dependent recruitment of LIM domain proteins. EMBO Rep. 2011;12:259–266. doi: 10.1038/embor.2011.5. [DOI] [PMC free article] [PubMed] [Google Scholar]
- 3.Lim ST, et al. Nuclear FAK promotes cell proliferation and survival through FERM-enhanced p53 degradation. Mol Cell. 2008;29:9–22. doi: 10.1016/j.molcel.2007.11.031. [DOI] [PMC free article] [PubMed] [Google Scholar]
- 4.Serrels A, et al. Nuclear FAK controls chemokine transcription, Tregs, and evasion of anti-tumor immunity. Cell. 2015;163:160–173. doi: 10.1016/j.cell.2015.09.001. [DOI] [PMC free article] [PubMed] [Google Scholar]
- 5.Lim ST, et al. Knock-in mutation reveals an essential role for focal adhesion kinase activity in blood vessel morphogenesis and cell motility-polarity but not cell proliferation. J Biol Chem. 2010;285:21526–21536. doi: 10.1074/jbc.M110.129999. [DOI] [PMC free article] [PubMed] [Google Scholar]
- 6.McLean GW, et al. Specific deletion of focal adhesion kinase suppresses tumor formation and blocks malignant progression. Genes Dev. 2004;18:2998–3003. doi: 10.1101/gad.316304. [DOI] [PMC free article] [PubMed] [Google Scholar]
- 7.Lahlou H, et al. Mammary epithelial-specific disruption of the focal adhesion kinase blocks mammary tumor progression. Proc Natl Acad Sci USA. 2007;104:20302–20307. doi: 10.1073/pnas.0710091104. [DOI] [PMC free article] [PubMed] [Google Scholar]
- 8.Corsi JM, et al. Autophosphorylation-independent and -dependent functions of focal adhesion kinase during development. J Biol Chem. 2009;284:34769–34776. doi: 10.1074/jbc.M109.067280. [DOI] [PMC free article] [PubMed] [Google Scholar]
- 9.Lietha D, et al. Structural basis for the autoinhibition of focal adhesion kinase. Cell. 2007;129:1177–1187. doi: 10.1016/j.cell.2007.05.041. [DOI] [PMC free article] [PubMed] [Google Scholar]
- 10.Shi Q, Boettiger D. A novel mode for integrin-mediated signaling: Tethering is required for phosphorylation of FAK Y397. Mol Biol Cell. 2003;14:4306–4315. doi: 10.1091/mbc.E03-01-0046. [DOI] [PMC free article] [PubMed] [Google Scholar]
- 11.Cai X, et al. Spatial and temporal regulation of focal adhesion kinase activity in living cells. Mol Cell Biol. 2008;28:201–214. doi: 10.1128/MCB.01324-07. [DOI] [PMC free article] [PubMed] [Google Scholar]
- 12.Mitra SK, Hanson DA, Schlaepfer DD. Focal adhesion kinase: in command and control of cell motility. Nat Rev Mol Cell Biol. 2005;6:56–68. doi: 10.1038/nrm1549. [DOI] [PubMed] [Google Scholar]
- 13.George EL, Georges-Labouesse EN, Patel-King RS, Rayburn H, Hynes RO. Defects in mesoderm, neural tube and vascular development in mouse embryos lacking fibronectin. Development. 1993;119:1079–1091. doi: 10.1242/dev.119.4.1079. [DOI] [PubMed] [Google Scholar]
- 14.Cicchini C, et al. TGFbeta-induced EMT requires focal adhesion kinase (FAK) signaling. Exp Cell Res. 2008;314:143–152. doi: 10.1016/j.yexcr.2007.09.005. [DOI] [PubMed] [Google Scholar]
- 15.Duvall CL, Taylor WR, Weiss D, Wojtowicz AM, Guldberg RE. Impaired angiogenesis, early callus formation, and late stage remodeling in fracture healing of osteopontin-deficient mice. J Bone Miner Res. 2007;22:286–297. doi: 10.1359/jbmr.061103. [DOI] [PubMed] [Google Scholar]
- 16.Ouderkirk JL, Krendel M. Myosin 1e is a component of the invadosome core that contributes to regulation of invadosome dynamics. Exp Cell Res. 2014;322:265–276. doi: 10.1016/j.yexcr.2014.01.015. [DOI] [PMC free article] [PubMed] [Google Scholar]
- 17.Schiller HB, Fässler R. Mechanosensitivity and compositional dynamics of cell-matrix adhesions. EMBO Rep. 2013;14:509–519. doi: 10.1038/embor.2013.49. [DOI] [PMC free article] [PubMed] [Google Scholar]
- 18.Krendel M, Osterweil EK, Mooseker MS. Myosin 1E interacts with synaptojanin-1 and dynamin and is involved in endocytosis. FEBS Lett. 2007;581:644–650. doi: 10.1016/j.febslet.2007.01.021. [DOI] [PMC free article] [PubMed] [Google Scholar]
- 19.Hoek KS, et al. Metastatic potential of melanomas defined by specific gene expression profiles with no BRAF signature. Pigment Cell Res. 2006;19:290–302. doi: 10.1111/j.1600-0749.2006.00322.x. [DOI] [PubMed] [Google Scholar]
- 20.Thomas JW, et al. SH2- and SH3-mediated interactions between focal adhesion kinase and Src. J Biol Chem. 1998;273:577–583. doi: 10.1074/jbc.273.1.577. [DOI] [PubMed] [Google Scholar]
- 21.Narayanan K, et al. The CCAAT enhancer-binding protein (C/EBP)β and Nrf1 interact to regulate dentin sialophosphoprotein (DSPP) gene expression during odontoblast differentiation. J Biol Chem. 2004;279:45423–45432. doi: 10.1074/jbc.M405031200. [DOI] [PubMed] [Google Scholar]
- 22.Noda M, et al. Identification of a DNA sequence responsible for binding of the 1,25-dihydroxyvitamin D3 receptor and 1,25-dihydroxyvitamin D3 enhancement of mouse secreted phosphoprotein 1 (SPP-1 or osteopontin) gene expression. Proc Natl Acad Sci USA. 1990;87:9995–9999. doi: 10.1073/pnas.87.24.9995. [DOI] [PMC free article] [PubMed] [Google Scholar]
- 23.Kaji H, et al. Retinoic acid induces osteoclast-like cell formation by directly acting on hemopoietic blast cells and stimulates osteopontin mRNA expression in isolated osteoclasts. Life Sci. 1995;56:1903–1913. doi: 10.1016/0024-3205(95)00165-3. [DOI] [PubMed] [Google Scholar]
- 24.Philip S, Bulbule A, Kundu GC. Osteopontin stimulates tumor growth and activation of promatrix metalloproteinase-2 through nuclear factor-κ B-mediated induction of membrane type 1 matrix metalloproteinase in murine melanoma cells. J Biol Chem. 2001;276:44926–44935. doi: 10.1074/jbc.M103334200. [DOI] [PubMed] [Google Scholar]
- 25.Thompson JF, et al. Prognostic significance of mitotic rate in localized primary cutaneous melanoma: An analysis of patients in the multi-institutional American Joint Committee on Cancer melanoma staging database. J Clin Oncol. 2011;29:2199–2205. doi: 10.1200/JCO.2010.31.5812. [DOI] [PMC free article] [PubMed] [Google Scholar]
- 26.Stöffler H-E, Bähler M. The ATPase activity of Myr3, a rat myosin I, is allosterically inhibited by its own tail domain and by Ca2+ binding to its light chain calmodulin. J Biol Chem. 1998;273:14605–14611. doi: 10.1074/jbc.273.23.14605. [DOI] [PubMed] [Google Scholar]
- 27.De Franceschi N, et al. Selective integrin endocytosis is driven by interactions between the integrin α-chain and AP2. Nat Struct Mol Biol. 2016;23:172–179. doi: 10.1038/nsmb.3161. [DOI] [PMC free article] [PubMed] [Google Scholar]
- 28.Xu W, Doshi A, Lei M, Eck MJ, Harrison SC. Crystal structures of c-Src reveal features of its autoinhibitory mechanism. Mol Cell. 1999;3:629–638. doi: 10.1016/s1097-2765(00)80356-1. [DOI] [PubMed] [Google Scholar]
- 29.Krendel M, et al. Disruption of Myosin 1e promotes podocyte injury. J Am Soc Nephrol. 2009;20:86–94. doi: 10.1681/ASN.2007111172. [DOI] [PMC free article] [PubMed] [Google Scholar]
- 30.Zhou X, et al. Fibronectin fibrillogenesis regulates three-dimensional neovessel formation. Genes Dev. 2008;22:1231–1243. doi: 10.1101/gad.1643308. [DOI] [PMC free article] [PubMed] [Google Scholar]
- 31.Furuta Y, et al. Mesodermal defect in late phase of gastrulation by a targeted mutation of focal adhesion kinase, FAK. Oncogene. 1995;11:1989–1995. [PubMed] [Google Scholar]
- 32.Ouderkirk-Pecone JL, et al. Myosin 1e promotes breast cancer malignancy by enhancing tumor cell proliferation and stimulating tumor cell de-differentiation. Oncotarget. 2016;7:46419–46432. doi: 10.18632/oncotarget.10139. [DOI] [PMC free article] [PubMed] [Google Scholar]
- 33.Endlich N, et al. Analysis of differential gene expression in stretched podocytes: Osteopontin enhances adaptation of podocytes to mechanical stress. FASEB J. 2002;16:1850–1852. doi: 10.1096/fj.02-0125fje. [DOI] [PubMed] [Google Scholar]
- 34.Mele C, et al. PodoNet Consortium MYO1E mutations and childhood familial focal segmental glomerulosclerosis. N Engl J Med. 2011;365:295–306. doi: 10.1056/NEJMoa1101273. [DOI] [PMC free article] [PubMed] [Google Scholar]
- 35.Velez Edwards DR, Tsosie KS, Williams SM, Edwards TL, Russell SB. Admixture mapping identifies a locus at 15q21.2-22.3 associated with keloid formation in African Americans. Hum Genet. 2014;133:1513–1523. doi: 10.1007/s00439-014-1490-9. [DOI] [PMC free article] [PubMed] [Google Scholar]
- 36.Wong VW, et al. Focal adhesion kinase links mechanical force to skin fibrosis via inflammatory signaling. Nat Med. 2011;18:148–152. doi: 10.1038/nm.2574. [DOI] [PMC free article] [PubMed] [Google Scholar]
- 37.Mori R, Shaw TJ, Martin P. Molecular mechanisms linking wound inflammation and fibrosis: Knockdown of osteopontin leads to rapid repair and reduced scarring. J Exp Med. 2008;205:43–51. doi: 10.1084/jem.20071412. [DOI] [PMC free article] [PubMed] [Google Scholar]
- 38.Meves A, et al. Tumor Cell adhesion as a risk factor for sentinel lymph node metastasis in primary cutaneous melanoma. J Clin Oncol. 2015;33:2509–2515. doi: 10.1200/JCO.2014.60.7002. [DOI] [PMC free article] [PubMed] [Google Scholar]
- 39.Meves A, et al. Beta1 integrin cytoplasmic tyrosines promote skin tumorigenesis independent of their phosphorylation. Proc Natl Acad Sci USA. 2011;108:15213–15218. doi: 10.1073/pnas.1105689108. [DOI] [PMC free article] [PubMed] [Google Scholar]
- 40.Yokomizo T, et al. Whole-mount three-dimensional imaging of internally localized immunostained cells within mouse embryos. Nat Protoc. 2012;7:421–431. doi: 10.1038/nprot.2011.441. [DOI] [PMC free article] [PubMed] [Google Scholar]
Associated Data
This section collects any data citations, data availability statements, or supplementary materials included in this article.


