Significance
Several decades elapse between liver cancer initiation and the appearance of tumors, and there are rarely overt clues that presage the appearance of disease. There is an acute need for biomarkers of incipient carcinogenesis when the disease is clinically addressable. This work used high-fidelity DNA sequencing and a mouse model to reveal high-resolution mutational spectra of the liver carcinogen aflatoxin B1 in histopathologically normal liver as early as 10 wk after exposure. The spectrum, which is mirrored in human liver tumors, persisted through carcinoma development more than a year later. Identification of tumor mutational spectra in a manipulable animal model affords opportunities for the efficient testing of strategies relevant to early detection, prevention, and management of human cancer.
Keywords: duplex sequencing, mycotoxins, cancer, mutagenesis, mouse model
Abstract
Aflatoxin B1 (AFB1) and/or hepatitis B and C viruses are risk factors for human hepatocellular carcinoma (HCC). Available evidence supports the interpretation that formation of AFB1-DNA adducts in hepatocytes seeds a population of mutations, mainly G:C→T:A, and viral processes synergize to accelerate tumorigenesis, perhaps via inflammation. Responding to a need for early-onset evidence predicting disease development, highly accurate duplex sequencing was used to monitor acquisition of high-resolution mutational spectra (HRMS) during the process of hepatocarcinogenesis. Four-day-old male mice were treated with AFB1 using a regimen that induced HCC within 72 wk. For analysis, livers were separated into tumor and adjacent cellular fractions. HRMS of cells surrounding the tumors revealed predominantly G:C→T:A mutations characteristic of AFB1 exposure. Importantly, 25% of all mutations were G→T in one trinucleotide context (CGC; the underlined G is the position of the mutation), which is also a hotspot mutation in human liver tumors whose incidence correlates with AFB1 exposure. The technology proved sufficiently sensitive that the same distinctive spectrum was detected as early as 10 wk after dosing, well before evidence of neoplasia. Additionally, analysis of tumor tissue revealed a more complex pattern than observed in surrounding hepatocytes; tumor HRMS were a composite of the 10-wk spectrum and a more heterogeneous set of mutations that emerged during tumor outgrowth. We propose that the 10-wk HRMS reflects a short-term mutational response to AFB1, and, as such, is an early detection metric for AFB1-induced liver cancer in this mouse model that will be a useful tool to reconstruct the molecular etiology of human hepatocarcinogenesis.
Hepatocellular carcinoma (HCC) is the third leading cause of cancer death worldwide, responsible for ∼700,000 deaths each year (1). Despite ample epidemiological evidence for multiple chemical and viral risk factors, and opportunities to mitigate such risks, HCC remains a particularly deadly disease because it is relatively asymptomatic until the disease reaches a very late stage. These considerations highlight the acute need for early detection of mutagenic processes that initiate and/or promote carcinogenesis in the liver.
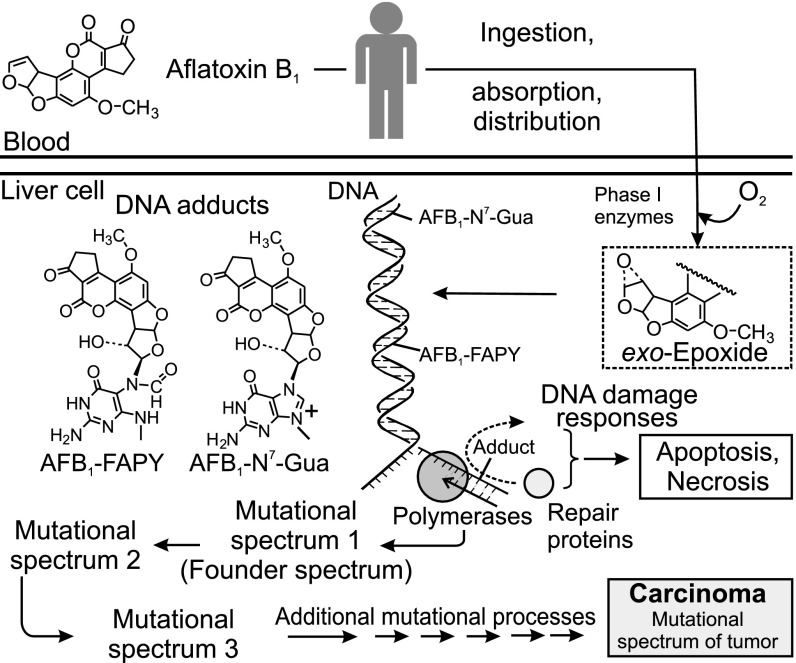
The fungal toxin aflatoxin B1 (AFB1) represents one of the most prevalent causative agents of HCC, especially in parts of the world where people consume staple grains contaminated with the food spoilage fungus, Aspergillus flavus, and are concurrently infected with hepatitis viruses (2–4). AFB1 consumption and HCC are epidemiologically linked in much of the developing world, including Southeast Asia, China, and sub-Saharan Africa (5). AFB1 (Fig. 1) is a potent mutagen and carcinogen (International Agency for Research on Cancer class I). Upon ingestion, it is rapidly absorbed from the digestive tract, transported to the liver, and absorbed by liver cells. There, the toxin is converted by phase I enzymes, such as cytochrome P450 1A2 and 3A4 (6, 7), into metabolites that include the exo-epoxide, which is the primary chemical precursor to AFB1-mediated mutagenic and carcinogenic events. This epoxide intercalates 5′ to guanine targets in DNA before covalent bonding with the guanyl N7 atom (8), ultimately forming a stereospecific AFB1-N7-Gua adduct (Fig. 1). A wide variation in adduct formation efficiency occurs across sequence space, which may reflect the mechanistic details of intercalation and reaction of the epoxide with guanines in different sequence contexts (9). The imidazole ring of the initial cationic adduct is vulnerable to facile hydrolysis, leading to the ring-opened AFB1 formamidopyrimidine (FAPY) adduct, a persistent lesion that appears to stabilize the DNA helix, making it more refractory to repair than its parent, AFB1-N7-Gua (10, 11). Owing to its persistence and high inherent mutability, the AFB1-FAPY adduct likely accounts for the majority of the mutations induced by aflatoxin (12); when traversed by replicative or translesion polymerases, the AFB1-FAPY adduct causes primarily G→T mutations. This defining mutation of AFB1 has been documented following replication in vitro (12, 13), in cell culture (14), in animal models (15, 16), and even in human specimens (17, 18).
Fig. 1.
Role of AFB1 in development of HCC. AFB1 is activated by metabolism to form an electrophilic epoxide, which binds to DNA to form mutagenic AFB1-DNA adducts. The two adducts shown, AFB1-N7-Gua and AFB1-FAPY, are mutagenic in vivo and cause the type of mutation that is seen most frequently in HCCs (the G:C→T:A transversion). Shortly after dosing, it is proposed that a “founder” or “exposure” mutational spectrum forms. As the tissue ages, subsequent mutational processes continue to mature the founder spectrum into the mutational spectrum seen in end-stage cancer.
Other risk factors synergize with AFB1 to induce HCC. The incidence of HCC is particularly high in populations that, in addition to exposure to dietary AFB1, are carriers of hepatitis B or C virus. Mechanisms underlying the carcinogenic synergy between toxin exposure and viral infection, shown to be in excess of 60-fold (19, 20), are not fully understood. One possible explanation is that chronic infection-mediated inflammation, along with inflammation from local AFB1-induced necrosis, can result in the production of reactive oxygen species (21). Reactive oxygen-induced damage is thus superimposed on AFB1 damage to the genome in tissues exposed to the toxin. Moreover, inflammation may induce low-fidelity bypass polymerases and/or cause failed attempts at DNA repair (22), which would induce additional mutations. Ultimately, the mutational portrait of an end-stage tumor likely reflects the contributions from the several aforementioned mutagenic processes (Fig. 1), starting from the founder mutational spectrum induced by AFB1 (spectrum 1 in Fig. 1), which is diversified and enriched with additional mutations (spectra 2 and 3 in Fig. 1) from inflammatory and/or viral processes throughout malignant progression.
A well-established animal model for studying carcinogenicity of environmental agents, including AFB1, is the B6C3F1 mouse (23); a transgenic variant of this mouse (λ-gptΔ B6C3F1) was developed to measure the amounts and types of mutations that arise in its guanine phosphoribosyltransferase (gpt) mutational target. Although this approach allows for robust estimations of mutational frequencies, the biased nature of the selection process makes it nonoptimal for construction of high-resolution mutational spectra (HRMS) that reveal the sequence context dependence of mutagenic processes. The present work expanded the utility of this mouse model to characterize the acquisition and evolution of mutational spectra during hepatocarcinogenesis. Our approach focused analysis on an expanded mutational target (6.4 kb) by using the recently developed duplex sequencing (DS) protocol (24). Unlike conventional next-generation sequencing, which is limited in its accuracy by the high rate of sequencing-introduced artifacts, DS employs molecular barcoding of both strands of DNA independently and a high sequencing depth, which affords increases of three to four orders of magnitude in sequencing fidelity over conventional sequencing technology. A similar strategy of molecular barcoding and strand amplification to establish a consensus sequence of DNA fragments has identified rare mutations in genomic DNA of normal and cancer tissues (25). This accuracy allowed for the detection of relatively rare mutations that occur early following mutagen exposure (e.g., 10 wk after dosing), as well as the dissection of the mutational complexity and the degree of clonality of later stage tumors that arise from the carcinogenic process.
By applying the DS strategy to the AFB1-treated mouse model, HRMS were obtained that provide insight into the mutational processes operative during the development of HCC. The AFB1-specific mutational spectrum that appeared early after carcinogen administration, and persisted until tumors developed over a year later, displayed strong similarity to mutational spectra seen in a frequent genetically related subset of human liver cancers. The discovery of cancer-associated exposure mutational spectra that appear long before the signs of malignancy will benefit the cancer epidemiology and prevention communities.
Results
Liver Tumor Induction in B6C3F1 Mice by a Single Exposure to AFB1.
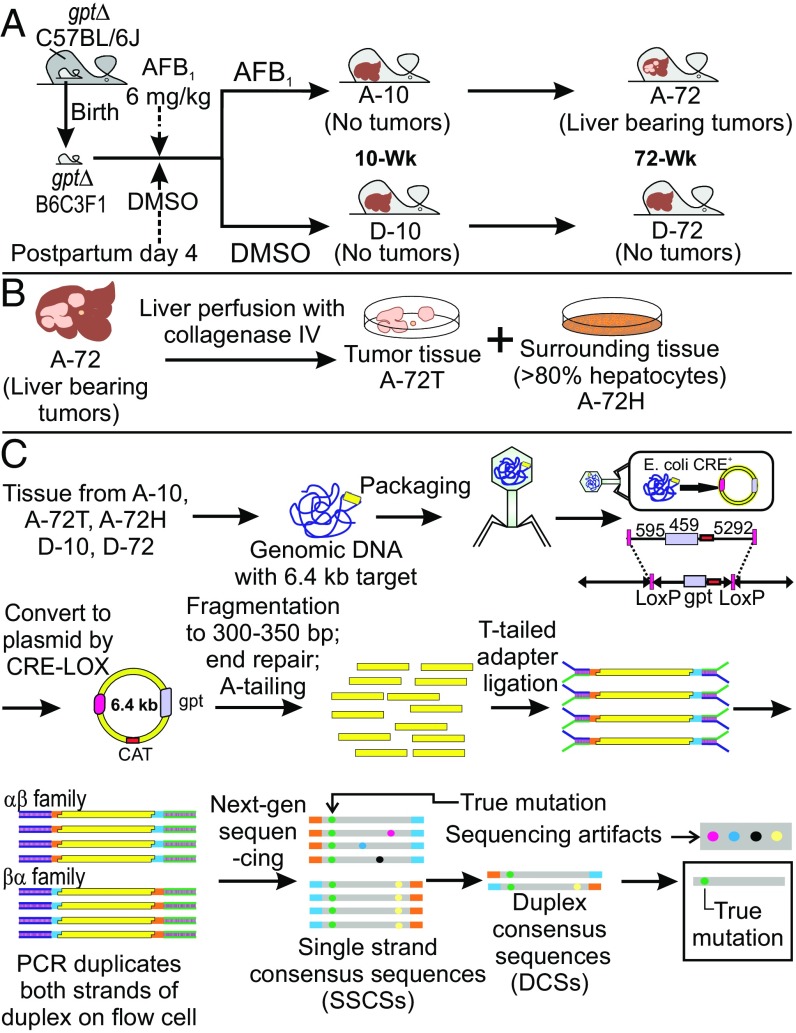
The carcinogenesis model used involved treatment of 4 d-old gptΔ B6C3F1 male mice with a 6-mg/kg dose of AFB1 dissolved in DMSO (Fig. 2A). The genetic consequences of carcinogen exposure were evaluated at 10 wk, at which time no signs of pathogenesis were evident, and at 72 wk, when grossly visible tumors were present. Collagenase perfusion allowed separation of tumor sectors from surrounding tissue. Mutational spectra at 10 wk are designated A-10 (AFB1-treated) and D-10 (DMSO-treated). Spectrum A-72T (T, tumor) is derived from isolated liver tumors, whereas spectrum A-72H (H, hepatocytes) is from a hepatocyte fraction surrounding the tumors from 72-wk-old AFB1-treated animals (Fig. 2B). Lastly, D-72 denotes the spectrum of 72-wk-old livers from DMSO-treated control animals (Fig. 2A).
Fig. 2.
Experimental work flow. (A) Male gptΔ B6C3F1 mice were treated as neonates with AFB1 and killed at either 10 wk (A-10) or 72 wk (A-72) of age. D-10 and D-72 are the corresponding DMSO solvent controls. (B) Liver tissues from killed mice at 72 wk of age were subjected to collagenase perfusion, and hepatocytes or tumor cells were isolated (A-72H and A-72T, respectively; D-72 is the corresponding DMSO control). (C) Overview of the DS method used to identify mutational spectra obtained from the mice shown in A and B. Adapted from Schmitt et al. (24). Details are provided in the main text. CAT, chloramphenicol acetyl transferase.
Use of DS to Generate HRMS of AFB1-Treated Mouse Livers.
The method in Fig. 2C shows how the conventional transgenic gptΔ B6C3F1 mouse model was meshed with DS to reveal HRMS attributable to AFB1. The gptΔ B6C3F1 mouse contains 40 copies of a λ-phage vector carrying the gpt gene on chromosome 17 (26). The mutations in the gpt cluster were isolated by recovery of λ-sequences from the mouse liver via phage λ-packaging and infection of resultant phage into bacteria, where CRE-LOX recombination formed plasmids that include the gpt gene within the 6.4-kb plasmid sequence. In the traditional application of the assay, mutations in the gpt gene are phenotypically enumerated by 6-thioguanine resistance and characterized by conventional DNA sequencing. However, the traditional gpt assay results are limited in that mutations are detected only if they disrupt the functionality of the GPT protein; thus, only a biased set of mutations (i.e., a selected spectrum) in relatively few sequence contexts can be identified (15, 16). By contrast, the DS strategy (Fig. 2C) circumvents these limitations by tagging and sequencing each of the complementary strands of DNA independently. True mutations (green dots in Fig. 2C) are identified computationally, after sequencing, as mutations that existed at the same site in each of the independent strands that entered the sequencing run. One advantage of the new assay is the enlargement of the genetic target from 459 bp to 6,382 bp. Second, the DS method allows readout of mutations at all nucleotides in the target, not just those mutations selectable in the conventional gpt assay. The gpt assay is biased toward detection of mutations that affect the functional domains of the gpt enzyme (e.g., the active site), and those biases confound attempts to identify mutagen-induced mutational landscapes in tissues exposed to exogenous or endogenous genotoxic agents. Fig. S1 shows a “selected” mutational spectrum of AFB1 from Woo et al. (16), which is strikingly different in landscape compared with the unselected spectra presented herein. The ability to define unbiased mutational spectra is fundamental to definition of the causative mutational processes underlying mutational landscapes.
Fig. S1.
The 6-thioguanine–selected mutational spectrum of AFB1 in the gpt coding sequence of the λ-gptΔ B6C3F1 mouse. The spectrum was generated from the data of Woo et al. (16) plotted in three-base contexts as done in the present paper (e.g., Fig. 3A). Mice were treated with 6 mg/kg AFB1 at day 4 of life and killed at 10 wk for mutation analysis by a protocol that selected for mutants that confer resistance to 6-thioguanine. A total of 131 mutants are plotted.
The DS methodology (Fig. 2C) was applied to DNA extracted from each of the tissue samples detailed in Fig. 2 A and B (i.e., A-10, A-72T, A-72H, D-10, D-72). DS was performed to a median depth of coverage of ∼15,000 reads per base. The total number of nucleotides sequenced and total number of point mutations observed are shown in Table 1. In all samples, it was observed that certain mutations occurred repeatedly at the same nucleotide position in the 6.4-kb target. For purposes of the analyses below, these mutations were considered clonal in origin, resulting from a single mutagenic event that was subsequently amplified during cell division; these presumably clonal mutations were counted only once per biological replicate. The basis for this decision was the observation that despite the high mutagenicity of AFB1 (Table 1), the probability of the same mutation occurring independently at the same site in two separate liver cells or in the same cell in two separate copies of the 6.4-kb target is only ∼0.01% (Supplemental Notes, Note 1). The relevance of clonal mutations is further considered in Supplemental Notes, Note 2. The tally of unique mutations thus obtained for each sample (Table 1) was then grouped into the six possible types of point mutation (Table 2).
Table 1.
DS aggregate output for each of the animal samples analyzed
| Sample | No. of animals | Total mutations | Unique mutations | Percent unique | Percent clonal | Total nucleotides sequenced (×106 bp) | Mutant fraction (×10−6) |
| A-10 | 4 | 804 | 397 | 49.4 | 50.6 | 128.8 | 3.08 |
| D-10 | 6 | 1,439 | 153 | 10.6 | 89.4 | 566.6 | 0.27 |
| A-72H | 2 | 224 | 197 | 87.9 | 12.1 | 52.9 | 3.72 |
| A-72T | 4 | 6,221 | 324 | 5.2 | 94.8 | 1,620.0 | 0.20 |
| D-72 | 2 | 540 | 142 | 26.3 | 73.7 | 747.3 | 0.19 |
Table 2.
Relative proportions of point mutations in the spectra displayed in Fig. 3
| Sample | G:C→T:A, % | G:C→C:G, % | G:C→A:T, % | A:T→T:A, % | A:T→G:C, % | A:T→C:G, % | G:C→T:A in 5′-CGC-3′ sites,* % |
| A-10 | 69 | 12 | 13 | 2 | 2 | 2 | 25 |
| D-10 | 36 | 32 | 13 | 5 | 7 | 7 | 2 |
| A-72H | 59 | 13 | 23 | 3 | 2 | 0 | 25 |
| A-72T | 41 | 21 | 24 | 6 | 4 | 4 | 5 |
| D-72 | 32 | 28 | 20 | 9 | 8 | 3 | 1 |
The underlined G is the position of the mutation.
Duplex Consensus Sequencing Detects an AFB1-Specific Mutational Spectrum at 10 Wk After Carcinogen Administration.
One objective of this work was to use the resolution of DS analysis to capture the unique mutagenic profile of AFB1 exposure shortly after dosing. The liver at 10 wk postdosing, when measurements were made, is phenotypically normal and indistinguishable from the DMSO-treated control; it takes over a year for tumors to develop in this single-dose animal model of HCC.
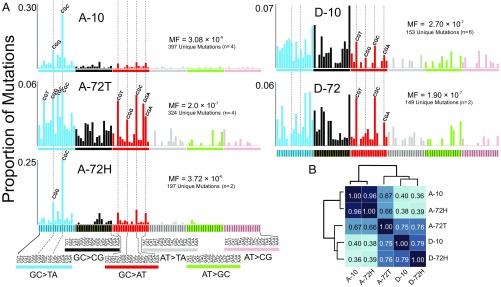
Consistent with previous studies (16), AFB1-treated animals had an 11-fold higher frequency of unique mutations [mutation frequency (MF) = 3.08 × 10⁻⁶] relative to the DMSO controls (MF = 2.70 × 10⁻⁷). Additionally, as expected from the mechanism of AFB1-induced DNA damage, the spectrum at 10 wk after toxin administration (A-10) showed a preponderance of G:C→T:A transversion mutations, whereas the DMSO control (D-10) featured a more diverse collection of transitions and transversions (Table 2).
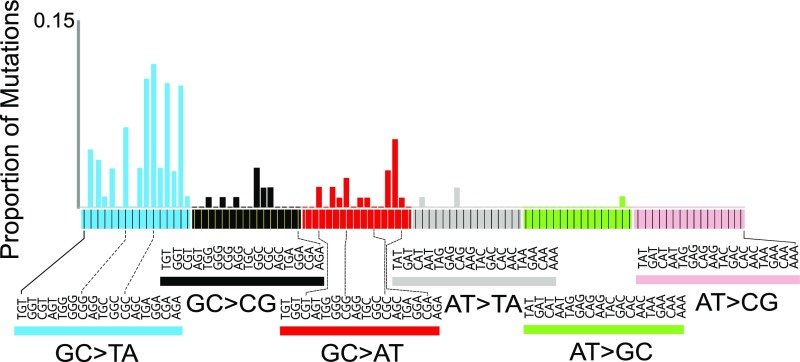
DS analysis also allowed for a more in-depth, fine-grained analysis of mutational spectra, including the influence of sequence context. When the point mutations were enumerated in all 96 possible three-base contexts (with the central base being the one at which the mutation occurred), and their proportion was normalized to the relative frequency of each sequence context in the 6.4-kb target (Fig. S2), a characteristic high-resolution AFB1 exposure mutational spectrum emerged (Fig. 3A). Whereas the expected G:C→T:A mutations dominated the mutational spectrum 10 wk after AFB1 administration, they were nonuniformly distributed across the different sequence contexts. As one example, fully 25% of all mutations were G:C→T:A occurring in the 5′-CGC-3′ context (the underlined G is the position of the mutation). By contrast, mutations in the DMSO control spectrum D-10 were more evenly distributed across the trinucleotide sequence contexts, encompassing G→T and G→C transversions, as well as G→A transitions (Fig. 3A and Table 2), with only 2% of the total mutations corresponding to the 5′-CGC-3′→5′-CTC-3′ genetic change.
Fig. S2.
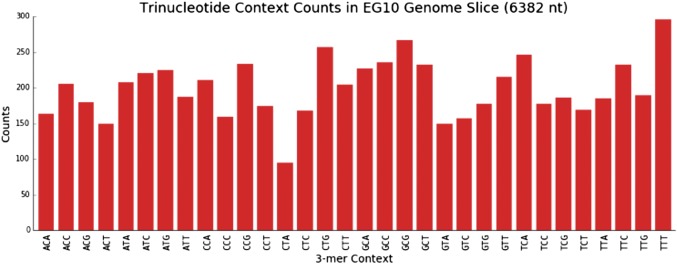
Relative frequency of each trinucleotide sequence context in the 6.4-kb sequencing target. The occurrence of each trinucleotide context was tallied in the λ-EG10 6.4-kb sequencing target. Of the 43 = 64 possible trinucleotide contexts, only 32 are shown; each sequence count also includes the occurrences of its reverse complementary sequence (e.g., ACA denotes the counts for both ACA and its complementary TGT trinucleotide sequences).
Fig. 3.
(A) HRMS of mice 10 and 72 wk after treatment with AFB1. The MF distributions enumerate base substitutions in each of the 96 possible three-base contexts (the center base in each context is the site of the mutation). Sample designations are presented in Fig. 2. (B) Cosine similarity provides a quantitative metric to express how similar the HRMSs are to one another.
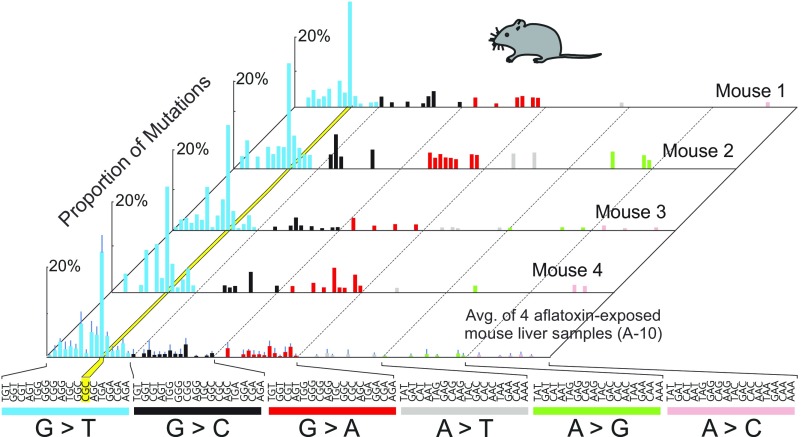
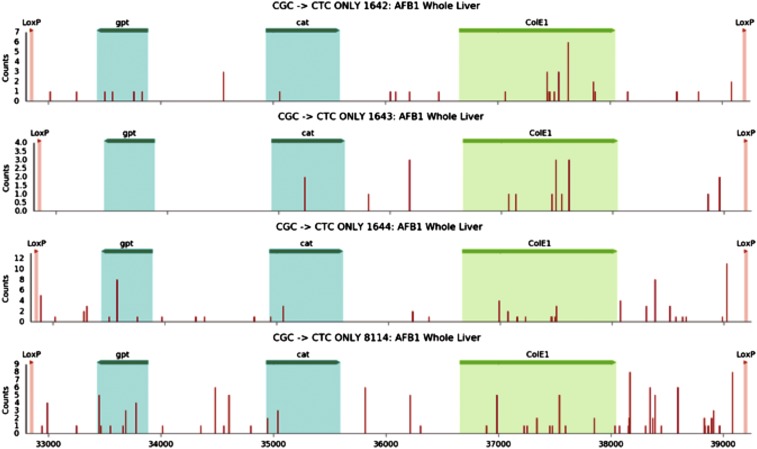
The observed 10-wk AFB1-induced mutational spectrum was highly reproducible. Animal-to-animal (n = 4) and sequencing run-to-run relative errors in the mutational spectral data were ∼4% (Fig. S3). Each of the four AFB1-treated animals analyzed at 10 wk showed the prominent G→T hotspot at the CGC sequence (yellow band in the Fig. S3). Importantly, the individual mutations that contributed to that peak were unique to each mouse and uniformly distributed among the CGC sites across the 6.4-kb cluster (Fig. S4).
Fig. S3.
Mutational patterns derived from the livers of AFB1-treated mice 10 wk after carcinogen administration. Spectra from four biological replicates are shown to demonstrate the reproducibility of the method. The yellow stripe highlights the G:C→T:A hotspot in the 5′-CGC-3′ context. The underlined G is the position of the mutation. Averaged data are shown in the bottom spectrum, along with error bars denoting SD. Avg., average.
Fig. S4.
Distribution of CGC→CTC mutations in the 6.4-kb target sequence observed at 10 wk for each of the individual mice treated with AFB1. The numbers 1642, 1643, 1644, and 8114 denote individual mice. The areas marked as gpt, cat, and ColE1 represent features of the EG10 fragment and are highlighted only for orientation purposes. The red bars indicate the position where a CGC→CTC mutation was observed. The areas marked as gpt, cat, and ColE1 represent the locations of the corresponding genes within the 6.4-kb EG10 fragment for orientation purposes.
Analysis of AFB1-Induced Mutational Spectra in Liver Tumors and Surrounding Hepatocytes at 72 Wk.
This work tested the possibility that tissue that evolves into HCC accumulates, over time, an expanded set of genetic changes that complement those changes present at 10 wk after AFB1 exposure. Livers bearing tumors from 72-wk-old animals originally exposed to AFB1 were separated into tumor tissue and adjacent hepatocyte fractions (Fig. 2B) and analyzed separately, producing the HRMS denoted A-72T and A-72H, respectively (Fig. 3A).
The spectrum from the hepatocyte fraction surrounding the tumor at 72 wk recapitulated the distinctive features of the early-onset A-10 spectrum, whereas the spectrum of the tumor, A-72T, was much more complex. The G→T in the CGC context characteristic of A-10 and A-72H remained the most abundant G→T mutation present in the A-72T tumor spectrum, reinforcing the notion that this CGC context was an AFB1-specific mutational hotspot. However, although still dominated by G→T mutations (Table 2), the tumor showed enhanced mutational diversity. One notable feature was the periodicity of G:C→A:T mutations (red bars in Fig. 3A), which is reminiscent of signature 1 from the work of Stratton and coworkers (27); this feature is usually attributed to the deamination of 5-methylcytosine in methylated 5′-CpG-3′ sites and constitutes an example of an AFB1 adduct-independent mutational process that may be operating during tumor development. The DMSO control mutational spectra at 10 wk (D-10) and 72 wk (D-72) were similar to one another (Fig. 3A). They were also similar to the tumor spectrum (A-72T), with a few notable exceptions, namely, that the G→T mutation in the CGC sequence context hotspot is a major peak in the AFB1-initiated tumor (A-72T) but is essentially absent in the controls (Fig. 3A and Table 2). Similarly, the G→T in the CGG context is present in tumor and other AFB1-treated tissues (A-10 and A-72H), but it is not a significant feature of the control HRMS.
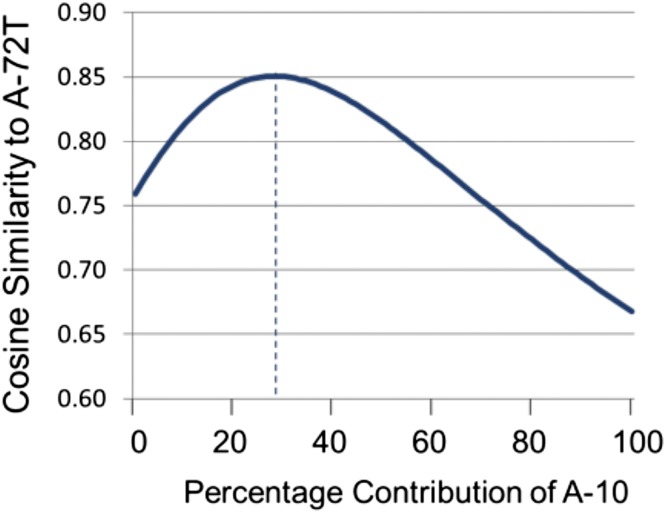
The relationships among the collected HRMS were evaluated by unsupervised clustering using the metric of cosine similarity (Fig. 3B). As expected based on the qualitative similarities observed by visual inspection, the spectra at 10 and 72 wk after AFB1 administration (A-10 and A-72H, respectively) were highly similar (0.96 cosine similarity, where 1.00 denotes identity). The DMSO controls (D-10 and D-72) were also similar to one another (0.79 cosine similarity). The AFB1-treated tumor spectrum (A-72T) clustered more closely with the DMSO controls (0.75–0.76 cosine similarity) than it did with either of the two AFB1-treated nontransformed tissues (A-10 and A-72H; 0.66–0.67 cosine similarity). However, when considering only the G→T portion of the spectra (blue bars in Fig. 3A), the AFB1-initiated tumor A-72T shows an enhanced cosine similarity of 0.73–0.78 with A-10 and A-72H. Moreover, if one compares linear combinations between the A-10 and D-10 spectra with the A-72T tumor spectrum, a maximum of 0.85 cosine similarity is reached for a combination of 29% A-10 and 71% D-10 (Fig. S5). This result substantiates the interpretation that the tumor spectrum at 72 wk is a composite, reflecting substantial mutagenic contributions from the “pure” AFB1 spectrum (i.e., A-10), “spontaneous” mutagenic processes (i.e., those processes captured in the DMSO controls), and likely additional mutagenic processes involved in tumor development.
Fig. S5.
Comparison of A-72T with linear combinations of A-10 and D-10 spectra by cosine similarity. Linear combinations of A-10 and D-10 spectra were compared with the tumor spectrum A-72T using cosine similarity. The extreme values reflect the cosine similarity between A-72T and D-10 (0.76) when the A-10 contribution is 0% and between A-72T and A-10 (0.66) when the A-10 contribution is 100%. The linear combination composed of 29% A-10 and 71% D-10 (denoted with the dotted line) gave the maximum cosine similarity with A-72T, which was 0.85.
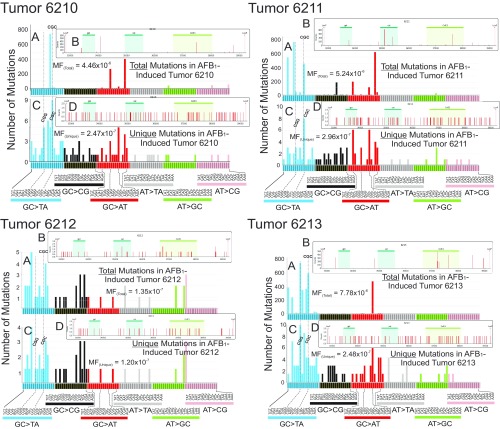
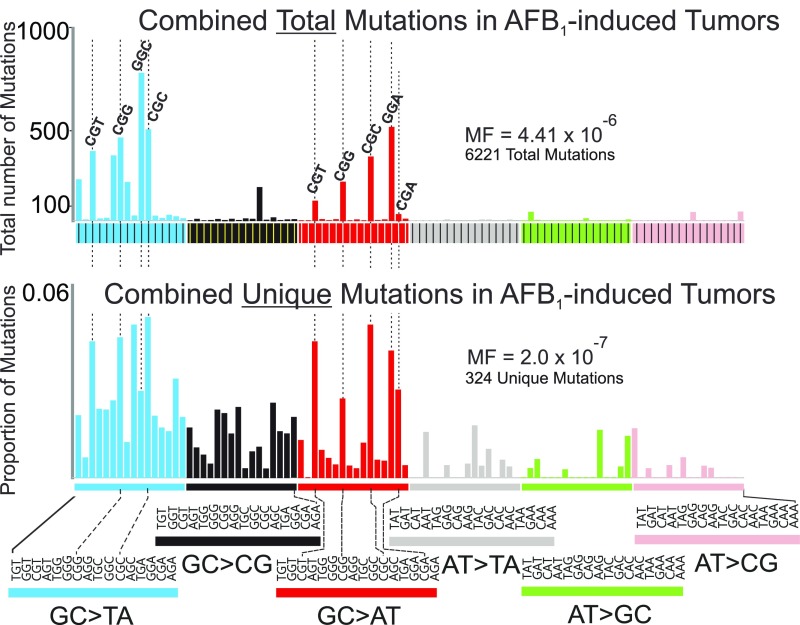
Additional clues regarding mutational processes captured by A-72T can be gleaned when considering the total number of mutations in each tumor, rather than just the unique mutations. Although this study was not designed to investigate clonal expansion of mutations in tumors, the high sequencing depth of DS revealed that the tumor tissues contained a large proportion of mutations that occurred at only a few sites within the 6.4-kb sequenced segment (Supplemental Notes, Note 2). Given the low probability of sibling mutations happening by chance (Supplemental Notes, Note 1), these data are consistent with the model of HCC evolution as a process of clonal expansion of cells during accelerated replicative growth. Mutations that occurred early in a few initiated cells would propagate in the tumor, generating hundreds or even thousands of repeat copies; by contrast, mutations that occurred late in tumor growth (i.e., during the last few cell divisions) would have a low clonality. Fig. S6 shows the aggregate sequence data (total number of mutations) for each of the four tumors both as the distribution of mutations across the 6.4-kb target and as the distribution of mutations across the 96 possible triplet sequence contexts. Looking at the summary data (Fig. S7), it is remarkable that the mutations substantially amplified (i.e., more than 100 copies) by clonal expansion were mainly G:C→T:A and G:C→A:T mutations. The clonal G→T mutations were found primarily at GGC and CGC sites, suggesting an AFB1 origin (Fig. 3A), whereas the clonal G→A mutations occurred predominantly in CGN sequence contexts, suggesting a spontaneous origin (e.g., signature 1 in ref. 27). The ostensibly mixed origin of these early mutations observed in the AFB1-induced tumors lends further credence to the notion that the tumor spectrum A-72T reflects multiple mutagenic processes, an important one of which includes AFB1 adduct-induced mutagenesis.
Fig. S6.
Distribution of total number of mutations, and the number of unique mutations, in each of the tumor samples from the AFB1-treated mice at 72 wk. The numbers 6210, 6211, 6212, and 6213 denote individual tumor-bearing mice. Total base substitution mutations were plotted by their three-base contexts (A) as well as by the respective positions and intensities of those mutations within the 6.4-kb transgene analyzed in the λ-gptΔ B6C3F1 mouse (B). The areas in B marked as gpt, cat, and ColE1 represent features of the EG10 fragment and are highlighted only for orientation purposes. The vertical bars in B indicate the position where a mutation was observed; the multiplicity of each mutation is represented by the height of each bar (relative to the scale shown on the y axis). In each case, unique mutations in three-base contexts (C) and across the 6.4-kb transgene (D) are plotted. In three of the four mice (6210, 6211, and 6213), there are mutations with a high clonality, because they occur hundreds of times; mouse tumor 6212 showed less evidence of clonality. All sequenced mutations are included in A and B. As shown in Table 1, up to 95% of the mutations were clonal in origin in the tumor samples; the mutational spectrum in which clonal mutations (mutations that occurred repeatedly at the same nucleotide position in the 6.4-kb target) were counted only once is shown in C and D.
Fig. S7.
Distribution of the total number of mutations and unique mutations in the four AFB1-induced tumors. This composite figure was compiled from data on individual tumors presented in Fig. S6.
The A-10 HRMS Constitutes a Biomarker of Exposure to AFB1 that Recapitulates the Mutagenic Landscape of AFB1-Induced Human HCC.
Exome sequencing of human HCC by Schulze et al. (28) recently revealed the mutational portraits of 243 tumors. The complexities and idiosyncrasies of human life make it difficult to attribute the etiology of an end-stage tumor to specific causes, be they genetic or environmental. Nevertheless, clustering analysis based on genetic and other criteria revealed a subgroup of tumors that these authors posited to have been induced by exposure to AFB1. This conclusion was based on (i) the prevalence of G→T mutations in these tumors, (ii) the hepatitis B-positive status of many members of the cohort (viral hepatitis synergizes with AFB1 in the most severe cases of HCC), and (iii) metadata that suggested likely exposure to dietary AFB1. Cohort members were nonsmokers (smoking, like AFB1, causes G→T mutations) and lacked alcoholic hepatitis as a risk factor.
Our work used an animal model in which AFB1 was the sole agent to induce HCC, and thus provided A-10 as a definitive “exposure mutational spectrum” of this toxin. Accordingly, A-10 is a suitable reference spectrum for evaluating the HCC samples from humans who are presumed, but not known with certainty, to have been exposed to the toxin. The utilization of an experimentally derived spectrum as a biomarker of exposure for AFB1 significantly diminishes the uncertainty involved in assigning the environmental etiology of a given human tumor.
We combined the mutational data for the 243 human HCCs described by Schulze et al. (28) with more recent data for an additional 71 HCCs from the Catalogue of Somatic Mutations in Cancer (COSMIC), The Cancer Genome Atlas, and INSERM repositories. For each HCC sample, the mutations were tallied and organized by the trinucleotide sequence context in which they occurred using available patient-specific reference genome information. The resulting mutational spectra were subsequently normalized by the frequency of occurrence of each trinucleotide sequence context relevant for each sample (e.g., for samples acquired by whole-exome sequencing, the frequency of trinucleotides in the human exome was used). Following the addition of the HRMS spectrum from AFB1-treated liver 10 wk after toxin administration (A-10; Fig. 3A) to this dataset, an unsupervised clustering analysis was performed using cosine similarity and a weighted pair group method with arithmetic mean analysis. It was our hypothesis that the tumor samples dominated by mutations induced by AFB1 would cluster together with our A-10 AFB1 exposure HRMS.
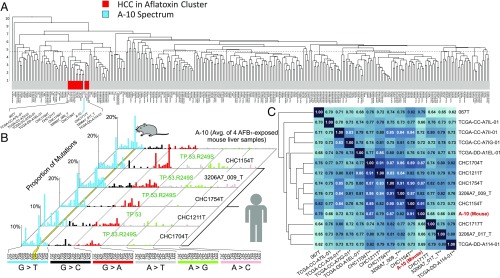
The results of the unsupervised clustering analysis revealed a group of 13 human tumors that cluster with the A-10 spectrum (red/blue box in Fig. 4A). The five human HCC spectra most similar to the A-10 murine spectrum (on the basis of cosine similarity; the central cluster in Fig. 4C) are shown individually alongside A-10 in Fig. 4B, and visual inspection reveals the similarity between these six spectra. The characteristic features of A-10 are prominent features in each of the five human spectra: (i) the abundance of G:C→T:A mutations, dominated by the mutation in the CGC sequence context in most cases; (ii) a comparatively minor fraction of G:C→A:T mutations; and (iii) the absence of significant amounts of other types of mutations. Importantly, four of the five human samples in our cluster of Fig. 4B were present in a five-sample group identified by Schulze et al. (28) as MSig2. MSig2 is the principal dataset used to construct the computationally derived mutational signature anticipated for AFB1-exposed humans, called Signature 24 (28).
Fig. 4.
Comparison of the mutational patterns of human liver cancer with the murine AFB1 exposure spectrum. (A) Dendrogram showing the results of unsupervised clustering of 314 human HCCs and murine spectrum A-10. The red cluster indicates the 13 human HCC samples with closest cosine similarity to A-10 (the blue vertical stripe). (B) HRMS of A-10 and the mutational spectra of the five human HCCs most similar to A-10 identified in A. The yellow stripe highlights the G:C→T:A hotspot in the 5′-CGC-3′ context. All five humans harbored TP53 mutations, and four specifically carried the TP53.R249S mutation. (C) Cosine similarity matrix of the red cluster from A with the murine spectrum A-10. The numbers in the matrix (also the darkness of the shade of blue) indicate the cosine similarity between compared samples. Asterisks on the bottom of the matrix indicate TP53 status (*known mutation in TP53, but not at position 249; **TP53.R249S mutation; no asterisk indicates TP53 wild type or status unknown).
The cosine similarity matrix for all 13 tumor spectra, as well as for A-10, is shown in Fig. 4C. The mouse spectrum 10 wk after AFB1 administration, A-10, is embedded deep in the dendrogram tree of the cluster, which underscores how closely its features match the features of its human neighbors. Additionally, as anticipated above, the five human spectra of Fig. 4B show especially high cosine similarities (0.79–0.91) to the mouse 10-wk spectrum, A-10 (Fig. 4C).
Discussion
It has been a long-standing goal of cancer genetics to provide insights into the evolutionary changes that portend tumor development before overt clinical symptoms appear. This goal is especially crucial for hepatocarcinogenesis, because liver tumors show few clinical symptoms until the disease has reached a late, usually fatal, stage. Early-onset biomarkers might enable intervention to eliminate or curtail development of the disease. Our work used DS to sequence DNA at very high depth, revealing the HRMS of AFB1 shortly after toxin administration. The spectrum 10 wk after exposure, A-10, is an early biomarker for AFB1 exposure. Given the particularities of the single-dose carcinogen model used (early carcinogen exposure followed quickly by rounds of replication that converted the mutagenic adducts into mutations), the A-10 spectrum is anticipated to reflect primarily the unique mutagenic imprint of AFB1 exposure. Although A-10 reflects, at minimum, prior AFB1 exposure, it is also permanent in that this signature is still clearly visible in nontumor cells of the liver at the point in time when tumors are abundant.
The level of detail in the mutational spectra of AFB1-treated liver allows chemical insight into the events that generate specific features of the mutational patterns. The G:C→T:A dominance in the spectra was expected due to the mutational properties of individual AFB1-DNA adducts (all of which occur at guanines) (12, 13, 29, 30), the mutational spectra in vitro and in vivo of AFB1 in cells and tissues (12–18), and observed patterns of mutations in human tumors (27, 28). Unexpected, however, was the high G→T mutation yield at selected guanyl residues in the 16 possible three-base contexts (Fig. 3A). Indeed, the hotspot at the CGC sequence was at least three- to fourfold more abundant than the next most frequent mutation. The mutations at CGC sequences are both robust (they occur at a majority of CGC sites present throughout the 6.4-kb target; Fig. S4) and very reproducible across biological replicates (Fig. S4). Several reasons could explain the context-dependent mutagenic pattern observed in the G→T domain of Fig. 3. First, there is evidence that some guanine three-base contexts (e.g., CGC) are better targets for covalent bonding with AFB1 than others. Previous data on the propensity of AFB1-epoxide to alkylate DNA suggest that G:C-rich sequences, a guanine flanked by G:C base pairs, tend to be preferentially modified (9). In fact, CGC is the third most reactive sequence toward the AFB1-epoxide. Second, an adduct in some contexts might evade repair better than an adduct in other contexts (e.g., an AFB1 adduct at a TGT site may be repaired better than one at CGC); such an outcome was observed with DNA alkylation damage (31). Third, an adduct in the CGC hotspot context could be misreplicated by a polymerase more often than the same adduct in another context. Any or all of these three possibilities could result in the uneven mutational spectrum of AFB1.
As an additional factor relevant to adduct formation and retention, the λ-EG10 transgene in our mouse model is not expressed, and it has been suggested that its CpG sites are predominantly methylated (32). Therefore, the observed hotspot in A-10 may reflect strong AFB1 binding and weak repair at a methylated CGC sequence. To date, in vitro studies have provided contradictory evidence as to whether the presence of a 5-methylcytosine adjacent to a guanine enhances reactivity toward the AFB1-epoxide (33, 34). It is also possible that an AFB1 adduct, once formed in a methylated CpG site, is refractory to repair, because methylated sites are often bound by regulatory proteins (e.g., MBD4) (35). Taken together, the hot and cold spots for mutation identified in this work will guide the design of further experiments that will provide mechanistic insights into the pathways by which AFB1 adducts site-specifically form and are removed in vivo.
By contrast with the surrounding hepatocyte fraction, the mutational spectra of tumor tissues at 72 wk (A-72T) displayed a wide array of mutations, although still showing evidence of G→T hotspots (e.g., in CGC and CGG contexts). However, these hotspot mutations in the tumor at 72 wk are obscured somewhat by a broader array of less context-dependent G:C→T:A mutations. As the tumor develops, it is possible that inflammation and oxidative stress occur to form 7,8-dihydro-8-oxoguanine and related products (36) that would cause G→T mutations, perhaps in a different context-dependent manner than seen in A-10. Also noteworthy in the AFB1-initiated tumor are enhanced relative levels of G:C→C:G mutations, which could also be inflammation-dependent [e.g., the oxidative stress-induced guanidinohydantoin, spiroiminohydantoin, and imidazolone lesions cause this mutation type (36)]. Moreover, etheno-adducts from lipid oxidation cause a wide range of mutation types (36), which could also diversify the mutational spectrum of the toxin-induced tumor at 72 wk.
Another prominent feature of all of the mutational spectra occurs in the G:C→A:T domain (Fig. 3A). A recurring pattern of transitions occurs, spotlighted by broken lines. There are several possible chemical explanations for this mutation. First, Bailey et al. (13) defined the mutagenic properties of a single AFB1-N7-Gua adduct in the 5′-CpG-3′ context and found that the adduct mainly causes a targeted G→T at the site of the adduct (underscored), but that 10% of the mutations are C→T at the 5′ cytosine. The semitargeted mutation in this specific context is consistent with Fig. 3A. As a second model, deamination of 5-methylcytosine residues (to thymines) in methylated CpG sites is a well-established cause of C→T mutations. As mentioned above, the viral cassette is presumed to be methylated at most CpG sites (30). This mutational signature is thought to be triggered by the biochemical processes associated with aging and, in addition, is a nearly universal feature seen in all types of human cancer (27). Lastly, it is also possible that tumor development may trigger an innate immune response, inducing cytosine deaminases, such as apolipoprotein B mRNA editing enzyme, catalytic polypeptide-like (APOBEC), which would also cause G:C→A:T mutations in certain sequence contexts (37).
In addition to providing chemical insight into the molecular details of aflatoxin carcinogenesis, the current study highlights the usefulness of an animal model to help inform human cancer epidemiology. Epidemiologists have uncovered multiple risk factors for HCC, which include, in addition to AFB1 exposure, alcohol use, as well as hepatitis B and C and other infections. However, epidemiological identification of risk factors is usually based on retrospective studies. The advantage of an animal model is that it can prospectively examine known variables, such as AFB1 exposure, to determine the biological plausibility that the variable contributes to the mutational processes operative in a given human cancer. Pursuant to this point, a striking conclusion of this work is that the mutational spectrum in the livers of AFB1-treated mice 10 wk after toxin administration shows remarkable similarity to the mutational spectra of an important subset of human liver tumors (Fig. 4).
A number of factors could explain the similarity between the murine spectrum A-10 and the spectra of the 13 human HCC samples. In the infant mouse, AFB1 forms strongly mutagenic adducts during an early-life period of rapid replicative growth (15, 16), resulting in the efficient conversion of adducts into mutations; these early mutations likely constitute the bulk of the genetic events depicted in A-10. By contrast to the single-dose mouse model, the liver cells of chronically exposed humans suffer repeated, but probably sublethal, insults from dietary AFB1. However, the mutagenic AFB1 adducts are very persistent in mammals and accumulate in the liver with continued exposures (10). When a subsequent toxic insult (e.g., hepatitis B virus infection) triggers cell death, the replicative capacity of the liver responds to restore cell number (20). Repeated AFB1 exposures in the presence of regenerative growth over an extended period would be expected to produce a mutational pattern similar to A-10.
Among the many genetic changes that associate with HCC, mutations in TP53, which often compromise the ability of this transcription factor to stop cell cycle progression and allow DNA repair, are the most common (17). Compromised TP53 function could thus accelerate the mutagenic bypass of the persistent AFB1 adducts, resulting in a mutational pattern similar to A-10. A common TP53 oncomutation in HCC is TP53.R249S, identified in 25% of AFB1-associated human tumors (38–41) and in 24% of all HCCs cataloged by the COSMIC (42). Interestingly, when considering all nonsynonymous amino acid changes due to point mutations that occur in a minimum of four tumor samples of our dataset of 314 HCC samples, the only mutated residue with significant enrichment in the AFB1 cluster (Fig. 4) is the TP53.R249S mutation (P value = 3.32 × 10⁻⁴, binomial test, false discovery rate adjustment). The TP53.R249S mutation is found in 54% (seven of 13) of the tumors in our AFB1 cluster, but appears in only 5.1% of the 314 HCC samples. Taken together, the current data lend support to the model that the TP53.R249S mutation has special significance in the development of tumors associated with AFB1 damage to the genome.
The founder mutational spectrum of AFB1 (A-10), with its reproducible pattern of hot and cold spots, affords several opportunities to the fields of molecular epidemiology and cancer prevention. With regard to epidemiology, the exposure spectrum is durable, in that its features are undiminished over the lifetime of the exposed animal (A-72H), and subfeatures (the CGC hotspot) are also evident in the more complex spectrum of the tumor (A-72T). The durability evidenced by the A-72H spectrum suggests that the normal tissue surrounding the tumor might be a good integrator of past exposures to the agent(s) that cause the disease. Additionally, application of DS to search for the CGC G→T hotspot in circulating cell-free DNA shed from AFB1-damaged tissues could provide an exciting adjunct to current methods used to examine the etiology of liver cancer in humans (43).
With regard to disease prevention, exposure spectra could be used as a metric in studies to determine how biological and lifestyle variables influence the risk of later life disease. We note, however, that the appearance of the A-10 spectrum in the liver is not a strict predictor of cancer, because other factors relevant for cancer progression, such as inflammation, may be needed to drive the tissue toward end-stage disease. This phenomenon is illustrated by a long-standing issue in hepatocarcinogenesis, namely, the lower rate of liver cancer in females compared with males. The currently leading model is that estradiol production in postpubescent females provides an antiinflammatory environment that lowers ultimate cancer risk (44). From previous work, we know that the MF attributable to AFB1 at 10 wk of life is identical in males and females, leading to the conclusion that later life events, most likely inflammation or epigenetic modifications in response to the presence of a developing tumor, accelerate male hepatocarcinogenesis (15, 16). The composite spectrum of AFB1-induced tumors (A-72T) is likely embedded with subspectra characteristic of the mutational processes associated with the hypothetical inflammatory and other events that accelerate male carcinogenesis. As with chemoprevention efforts aimed at the AFB1 adduct-driven component of liver cancer development (3), complementary prevention efforts could be aimed at diminishing the inflammatory and other factors that appear to be important in the promotion of liver tumors.
In sum, the present work highlights the usefulness of an efficient animal model in which carcinogen-induced mutational spectra, which typically develop in human tumors over three to five decades, can be recapitulated, at high resolution, in as little as 10 wk. This model, together with its powerful sequencing strategy and bioinformatics pipeline, may constitute a valuable addition to the arsenal of tools used to study cancer etiology, prevention, and management.
Materials and Methods
Animal Treatment.
C57BL/6 gptΔ transgenic mice were a gift from T. Nohmi (45). The gptΔ B6C3F1 mice used here were generated by breeding female gptΔ C57BL/6J mice, which harbor an estimated 80 copies of the gpt gene on chromosome 17, with male C3H/HeJ mice purchased from The Jackson Laboratories. Neonatal B6C3F1 mice were injected i.p. with a single dose (6 mg/kg) of AFB1 (Sigma) in 10 μL of DMSO (Sigma) or DMSO alone on day 4 of life. At the ages of 10 and 72 wk, mice were euthanized and liver tissue was collected for DNA extraction. All experiments were conducted in accordance with protocols approved by the Massachusetts Institute of Technology Committee on Animal Care.
Mouse Liver Perfusion, DNA Isolation, λ-EG10 Phage in Vitro Packaging, and Plasmid Extraction.
Tumor tissues were separated from nontumor cells by perfusion of livers with a collagenase-containing solution, and both were harvested for analysis. Tissues were pulverized in liquid nitrogen, and genomic DNA was extracted from ∼25 mg of liver tissue using the RecoverEase DNA Isolation Kit (Agilent Technologies) following the manufacturer’s directions. The λ-EG10 phages were packaged in vitro from genomic DNA using Transpack packaging extract (Agilent Technologies) following the instructions of the manufacturer. The λ-EG10 phages rescued from genomic DNA were transfected into Escherichia coli YG6020 expressing Cre-recombinase, generating a 6.4-kb plasmid carrying the gpt and chloramphenicol acetyltransferase (CAT) genes. Resistant colonies were pooled after culturing cells in media containing chloramphenicol, and plasmid DNA was isolated using a Miniprep Kit (Qiagen) according to the manufacturer’s instructions.
Synthesis of T-Tailed Adapters Containing Degenerate Sequence Tags.
Sequencing adapters (Table S1) were made by modification of a method described previously (24, 46). Briefly, PAGE-purified, hand-mixed top and bottom strands (Integrated DNA Technologies) were annealed; annealing involved mixing of equimolar portions of the top and bottom strands (50 μM final concentration of each) and heating at 95 °C for 5 min, followed by cooling to room temperature over 1 h. The annealed product had a Y-shaped tail owing to noncomplementary ends. The bottom (template) strand contained an 8-nt cassette of randomly inserted bases. Extension of the 3′ terminus of the top strand converted the 8-nt single-stranded sequence into a degenerate duplex sequence tag eventually used as a strand discrimination marker. Extension was carried out using Klenow 3′→5′ exo-minus DNA polymerase (New England BioLabs) at 37 °C for 1 h, and the product was purified by ethanol precipitation. A 3′ dT overhang was created by cleavage with HpyCH4III (New England BioLabs). Lastly, the product was again ethanol-precipitated and resuspended to a final concentration of 15 μM. Quality control of adapter synthesis was evaluated by 32P radiolabeling of the adapter, followed by PAGE and autoradiography.
Table S1.
Sequences of the adapter and PCR oligonucleotides
| Name | Sequence |
| Top adapter | 5′-ACACTCTTTCCCTACACGACGCTCTTCCGATCT-3′ |
| Bottom adapter | 5′Phosphorylation-TCTTCTACAGTCANNNNNNNNAGATCGGAAGAGCGGTTCAGCAGGAATGCCGAG-3′ |
| PCR primer 1 | 5′-AATGATACGGCGACCACCGAGATCTACACAGAGAGACACTCTTTCCCTACACGACGCTCTTCCGATCT-3′ |
| PCR primer 2 | 5′-CAAGCAGAAGACGGCATACGAGATXXXXXXCGGTCTCGGCATTCCTGCTGAACCGCTCTTCCGATCT-3′ |
Where XXXXXX in primer 2 indicates the position of fixed multiplexing barcode sequence.
Library Preparations, Quality Control, and Sequencing.
DNA was prepared into libraries for DS by a modification of published protocols (24, 46). Approximately 6 μg of plasmid DNA was diluted in 130 μL of TE low buffer (Affymetrix) and fragmented by sonication using a Covaris S220 acoustics ultrasonicator; the following settings were used to shear plasmid DNA to a range of 300–350 bp: duty cycle, 10%; intensity, 6; cycles per burst, 100; time, 20 s × 5; and temperature, 4 °C. Fragmented DNA was purified with 1.0 vol of AMPure XP beads (Beckman Coulter) following the manufacturer’s protocol. Sheared DNA was end-repaired (New England BioLabs) and 3′-end dA-tailed using Klenow exo-minus polymerase (New England BioLabs) per the manufacturer’s protocol. DNA fragments were purified using 1.0 vol of AMPure XP beads. The dA-tailed DNA fragment was ligated to the dT-tailed adapter using Quick T4 DNA ligase (New England Biolabs). The adapter-ligated DNA product was purified with 0.65 vol of AMPure XP beads. Multiple copies of each strand of adapter-ligated DNA were created by PCR amplification using PCR primers that incorporated sample-defining barcodes (Table S1) using the KAPA HiFi PCR kit (Kappa Biosciences). The amount of DNA used for amplification was adjusted to obtain an optimal peak family size of 6 as described (24, 46). PCR products of 366–415 bp were selected using AMpure XP beads. The size distribution and the molar concentration of each library were determined on an Agilent Bioanalyzer. The libraries were then sequenced using a 150-bp paired-end protocol on the NextSeq Illumina platform according to the manufacturer’s recommendations.
Data Processing.
Reads with intact duplex tags contain an 8-nt random sequence. The 8-nt tag sequences from both the forward and reverse sequencing reads were computationally added to the read header to result in a combined 16-nt tag for each read. Reads were then aligned to the reference λ-EG10 phage genome with the Burrows–Wheeler aligner (BWA), and nonmapping reads were rejected. Reads sharing identical tag sequences were then grouped and collapsed to consensus reads. Consensus reads were realigned with the BWA. The consensus sequences were then matched with their strand partners by grouping each 16-nt tag of form αβ in read 1 with its corresponding tag of form βα in read 2. Resulting sequence positions were accepted only when information from both DNA strands was in perfect agreement.
HRMS Clustering Analysis with Human HCC.
HRMS are the result of counting the frequency of mutations centered in each canonical trinucleotide context and then dividing by the frequency of trinucleotide occurrence in the 6.4-kb reference transgene. After normalization, HRMS are rescaled to sum to 1. All composite HRMS are the result of the arithmetic mean of each cohort’s normalized individual HRMS.
Unsupervised hierarchical clustering of 314 human HCC samples from the COSMIC database (v76) and A-10 was performed. HCC samples were filtered to include only validated somatic base substitutions that were called against the most recent release of the human reference genome in genome-wide screens. Each mutation for each sample was associated with its trinucleotide context using the pyfaidx Python module using the hg38 version of the human genome. All samples were then normalized based on either the frequency of the trinucleotide contexts present in the human exome or in the whole genome. Hierarchical clustering was performed using Scipy’s linkage and dendrogram routines with the weighted pair group method with arithmetic mean (WPGMA) method and cosine distance metric. Clusters were identified visually. Clinical metadata associated with samples were acquired through the COSMIC web portal or published literature (28).
Supplemental Notes
Note 1.
The diploid mouse genome contains ∼5.6 × 10⁹ nt (GRCm38.p5). Given a MF of 3.08 × 10⁻⁶, AFB1 exposure introduces ∼17,248 mutations per genome. Given one mutation in one instance of the 6,382-nt sequencing target, the probability of another mutation occurring at the same position in one of the remaining 39 copies of the target is 39/5.6 × 109 = 6.96 × 10⁻⁹. Each of the AFB1-induced mutations has this probability, so the total probability is 17,248 × 6.96 × 10−9 = 1.2 × 10−4 = ∼0.01%. In other words, for every ∼10,000 mutations enumerated, only two are likely to have occurred in the same position of the sequencing target by chance.
Note 2.
Most of the analysis in this work focuses on mutational spectra composed of unique mutations, because they reveal a mutational fingerprint characteristic of a biochemical or chemical process. However, examination of the full spectrum of mutations in the analyzed tissues can provide additional biological insight into AFB1-induced tumorigenesis. As explained previously, all mutational datasets collected in this study contain a percentage of clonal mutations (i.e., mutations found repeatedly at the same position in the 6.4-kb sequencing target; Table 1). Such clonal jackpots arise by amplification of mutations that occur relatively early in liver development and/or during tumor growth; the variability in the timing of their appearance would result in considerable animal-to-animal variability in the overall mutational spectrum observed (Fig. S6). The tumors from three of the four mice analyzed show massive expansions (from hundreds to thousands of occurrences) of a few mutations at discrete and unique positions in the 6.4-kb sequencing target (Fig. S6), suggesting that these mutations occurred very early during carcinogenesis in the same cell lineage that eventually grew into the tumor. Interestingly, the fourth tumor (mouse tumor 6212) featured mutations with very low clonality, suggesting that these mutations occurred much later in tumor development. Given the relatively small sequencing target for the DS strategy, the absence of clonally expanded early mutations in a given sample is a statistically probable event; in fact, assuming a uniform distribution of mutations in the genome, ∼42% of the cells exposed to AFB1 will register no mutations (either spontaneous or AFB1-induced) in the sequencing target, as explained below.
The diploid mouse genome contains ∼5.6 × 10⁹ nt (GRCm38.p5). Given an MF of 3.08 × 10⁻⁶, AFB1 exposure introduces ∼17,248 mutations per genome. The sequencing target is composed of 40 copies of 6,382 nt each, that is, a total of 255,280 nt. The probability that one mutation hits this target is pm = 255,280/5.6 × 109 = 4.55 × 10⁻⁵. Therefore, the probability that a mutation occurs outside of the sequencing target is 1 × pm = 0.999954. Finally, the probability that all 17,248 mutations induced by AFB1 occur outside of the sequencing target is (1 − pm)17.248 = 0.45.
If the spontaneous mutations are also considered, the total MF is 3.08 × 10⁻⁶ + 2.7 × 10−7 = 3.35 × 10⁻⁶. This frequency would induce about 18,760 mutations per genome. Therefore, the probability that none of these mutations occur in the sequencing target is (1 − pm)18,760 = 0.42.
Acknowledgments
We thank L.A.L. laboratory members for DS advice. We thank John Groopman and Peter Westcott for valuable feedback on the manuscript. We also thank the MIT Center for Environmental Health Sciences for access to its Core facilities. This work was supported by NIH Grants NIH R01-ES016313, P30-ES002109, T32-ES007020, and R01-CA080024 (to J.M.E.) and by NIH Grants R01-CA160674 and R33-CA181771 (to L.A.L.). S.C. is supported by a Schlumberger Foundation Faculty for the Future Fellowship.
Footnotes
The authors declare no conflict of interest.
This article contains supporting information online at www.pnas.org/lookup/suppl/doi:10.1073/pnas.1700759114/-/DCSupplemental.
References
- 1.Jemal A, et al. Global cancer statistics. CA Cancer J Clin. 2011;61:69–90. doi: 10.3322/caac.20107. [DOI] [PubMed] [Google Scholar]
- 2.Groopman JD, Kensler TW. Role of metabolism and viruses in aflatoxin-induced liver cancer. Toxicol Appl Pharmacol. 2005;206:131–137. doi: 10.1016/j.taap.2004.09.020. [DOI] [PubMed] [Google Scholar]
- 3.Kensler TW, Roebuck BD, Wogan GN, Groopman JD. Aflatoxin: A 50-year odyssey of mechanistic and translational toxicology. Toxicol Sci. 2011;120(Suppl 1):S28–S48. doi: 10.1093/toxsci/kfq283. [DOI] [PMC free article] [PubMed] [Google Scholar]
- 4.Kew MC. Synergistic interaction between aflatoxin B1 and hepatitis B virus in hepatocarcinogenesis. Liver Int. 2003;23:405–409. doi: 10.1111/j.1478-3231.2003.00869.x. [DOI] [PubMed] [Google Scholar]
- 5.Wild CP, Gong YY. Mycotoxins and human disease: A largely ignored global health issue. Carcinogenesis. 2010;31:71–82. doi: 10.1093/carcin/bgp264. [DOI] [PMC free article] [PubMed] [Google Scholar]
- 6.Forrester LM, Neal GE, Judah DJ, Glancey MJ, Wolf CR. Evidence for involvement of multiple forms of cytochrome P-450 in aflatoxin B1 metabolism in human liver. Proc Natl Acad Sci USA. 1990;87:8306–8310. doi: 10.1073/pnas.87.21.8306. [DOI] [PMC free article] [PubMed] [Google Scholar]
- 7.Ueng YF, Shimada T, Yamazaki H, Guengerich FP. Oxidation of aflatoxin B1 by bacterial recombinant human cytochrome P450 enzymes. Chem Res Toxicol. 1995;8:218–225. doi: 10.1021/tx00044a006. [DOI] [PubMed] [Google Scholar]
- 8.Mao H, Deng Z, Wang F, Harris TM, Stone MP. An intercalated and thermally stable FAPY adduct of aflatoxin B1 in a DNA duplex: Structural refinement from 1H NMR. Biochemistry. 1998;37:4374–4387. doi: 10.1021/bi9718292. [DOI] [PubMed] [Google Scholar]
- 9.Loechler EL, Teeter MM, Whitlow MD. Mapping the binding site of aflatoxin B1 in DNA: Molecular modeling of the binding sites for the N(7)-guanine adduct of aflatoxin B1 in different DNA sequences. J Biomol Struct Dyn. 1988;5:1237–1257. doi: 10.1080/07391102.1988.10506467. [DOI] [PubMed] [Google Scholar]
- 10.Croy RG, Wogan GN. Temporal patterns of covalent DNA adducts in rat liver after single and multiple doses of aflatoxin B1. Cancer Res. 1981;41:197–203. [PubMed] [Google Scholar]
- 11.Brown KL, Bren U, Stone MP, Guengerich FP. Inherent stereospecificity in the reaction of aflatoxin B(1) 8,9-epoxide with deoxyguanosine and efficiency of DNA catalysis. Chem Res Toxicol. 2009;22:913–917. doi: 10.1021/tx900002g. [DOI] [PMC free article] [PubMed] [Google Scholar]
- 12.Smela ME, et al. The aflatoxin B(1) formamidopyrimidine adduct plays a major role in causing the types of mutations observed in human hepatocellular carcinoma. Proc Natl Acad Sci USA. 2002;99:6655–6660. doi: 10.1073/pnas.102167699. [DOI] [PMC free article] [PubMed] [Google Scholar]
- 13.Bailey EA, Iyer RS, Stone MP, Harris TM, Essigmann JM. Mutational properties of the primary aflatoxin B1-DNA adduct. Proc Natl Acad Sci USA. 1996;93:1535–1539. doi: 10.1073/pnas.93.4.1535. [DOI] [PMC free article] [PubMed] [Google Scholar]
- 14.Alekseyev YO, Hamm ML, Essigmann JM. Aflatoxin B1 formamidopyrimidine adducts are preferentially repaired by the nucleotide excision repair pathway in vivo. Carcinogenesis. 2004;25:1045–1051. doi: 10.1093/carcin/bgh098. [DOI] [PubMed] [Google Scholar]
- 15.Chawanthayatham S, et al. Prenatal exposure of mice to the human liver carcinogen aflatoxin B1 reveals a critical window of susceptibility to genetic change. Int J Cancer. 2015;136:1254–1262. doi: 10.1002/ijc.29102. [DOI] [PMC free article] [PubMed] [Google Scholar]
- 16.Woo LL, et al. Aflatoxin B1-DNA adduct formation and mutagenicity in livers of neonatal male and female B6C3F1 mice. Toxicol Sci. 2011;122:38–44. doi: 10.1093/toxsci/kfr087. [DOI] [PMC free article] [PubMed] [Google Scholar]
- 17.Hussain SP, Schwank J, Staib F, Wang XW, Harris CC. TP53 mutations and hepatocellular carcinoma: Insights into the etiology and pathogenesis of liver cancer. Oncogene. 2007;26:2166–2176. doi: 10.1038/sj.onc.1210279. [DOI] [PubMed] [Google Scholar]
- 18.Soussi T, Dehouche K, Béroud C. p53 website and analysis of p53 gene mutations in human cancer: Forging a link between epidemiology and carcinogenesis. Hum Mutat. 2000;15:105–113. doi: 10.1002/(SICI)1098-1004(200001)15:1<105::AID-HUMU19>3.0.CO;2-G. [DOI] [PubMed] [Google Scholar]
- 19.Qian GS, et al. A follow-up study of urinary markers of aflatoxin exposure and liver cancer risk in Shanghai, People’s Republic of China. Cancer Epidemiol Biomarkers Prev. 1994;3:3–10. [PubMed] [Google Scholar]
- 20.Ross RK, et al. Urinary aflatoxin biomarkers and risk of hepatocellular carcinoma. Lancet. 1992;339:943–946. doi: 10.1016/0140-6736(92)91528-g. [DOI] [PubMed] [Google Scholar]
- 21.Loft S, Poulsen HE. Cancer risk and oxidative DNA damage in man. J Mol Med (Berl) 1996;74:297–312. doi: 10.1007/BF00207507. [DOI] [PubMed] [Google Scholar]
- 22.Friedberg EC, Walker GC, Siede W, Wood RD, Schultz RA. DNA Repair and Mutagenesis. 2nd Ed ASM Press; Washington, DC: 2006. [Google Scholar]
- 23.Rao GN, Birnbaum LS, Collins JJ, Tennant RW, Skow LC. Mouse strains for chemical carcinogenicity studies: Overview of a workshop. Fundam Appl Toxicol. 1988;10:385–394. doi: 10.1016/0272-0590(88)90285-0. [DOI] [PubMed] [Google Scholar]
- 24.Schmitt MW, et al. Detection of ultra-rare mutations by next-generation sequencing. Proc Natl Acad Sci USA. 2012;109:14508–14513. doi: 10.1073/pnas.1208715109. [DOI] [PMC free article] [PubMed] [Google Scholar]
- 25.Hoang ML, et al. Genome-wide quantification of rare somatic mutations in normal human tissues using massively parallel sequencing. Proc Natl Acad Sci USA. 2016;113:9846–9851. doi: 10.1073/pnas.1607794113. [DOI] [PMC free article] [PubMed] [Google Scholar]
- 26.Masumura K, et al. Spectra of gpt mutations in ethylnitrosourea-treated and untreated transgenic mice. Environ Mol Mutagen. 1999;34:1–8. doi: 10.1002/(sici)1098-2280(1999)34:1<1::aid-em1>3.0.co;2-p. [DOI] [PubMed] [Google Scholar]
- 27.Alexandrov LB, et al. Australian Pancreatic Cancer Genome Initiative; ICGC Breast Cancer Consortium; ICGC MMML-Seq Consortium; ICGC PedBrain Signatures of mutational processes in human cancer. Nature. 2013;500:415–421. doi: 10.1038/nature12477. [DOI] [PMC free article] [PubMed] [Google Scholar]
- 28.Schulze K, et al. Exome sequencing of hepatocellular carcinomas identifies new mutational signatures and potential therapeutic targets. Nat Genet. 2015;47:505–511. doi: 10.1038/ng.3252. [DOI] [PMC free article] [PubMed] [Google Scholar]
- 29.Lin YC, et al. Error-prone replication bypass of the primary aflatoxin B1 DNA adduct, AFB1-N7-Gua. J Biol Chem. 2014;289:18497–18506. doi: 10.1074/jbc.M114.561563. [DOI] [PMC free article] [PubMed] [Google Scholar]
- 30.Lin YC, et al. Molecular basis of aflatoxin-induced mutagenesis-role of the aflatoxin B1-formamidopyrimidine adduct. Carcinogenesis. 2014;35:1461–1468. doi: 10.1093/carcin/bgu003. [DOI] [PMC free article] [PubMed] [Google Scholar]
- 31.Delaney JC, Essigmann JM. Mutagenesis, genotoxicity, and repair of 1-methyladenine, 3-alkylcytosines, 1-methylguanine, and 3-methylthymine in alkB Escherichia coli. Proc Natl Acad Sci USA. 2004;101:14051–14056. doi: 10.1073/pnas.0403489101. [DOI] [PMC free article] [PubMed] [Google Scholar]
- 32.Weng A, Engler P, Storb U. The bulk chromatin structure of a murine transgene does not vary with its transcriptional or DNA methylation status. Mol Cell Biol. 1995;15:572–579. doi: 10.1128/mcb.15.1.572. [DOI] [PMC free article] [PubMed] [Google Scholar]
- 33.Chen JX, Zheng Y, West M, Tang MS. Carcinogens preferentially bind at methylated CpG in the p53 mutational hot spots. Cancer Res. 1998;58:2070–2075. [PubMed] [Google Scholar]
- 34.Ross MK, Mathison BH, Said B, Shank RC. 5-Methylcytosine in CpG sites and the reactivity of nearest neighboring guanines toward the carcinogen aflatoxin B1-8,9-epoxide. Biochem Biophys Res Commun. 1999;254:114–119. doi: 10.1006/bbrc.1998.9895. [DOI] [PubMed] [Google Scholar]
- 35.Petronzelli F, et al. Investigation of the substrate spectrum of the human mismatch-specific DNA N-glycosylase MED1 (MBD4): Fundamental role of the catalytic domain. J Cell Physiol. 2000;185:473–480. doi: 10.1002/1097-4652(200012)185:3<473::AID-JCP19>3.0.CO;2-#. [DOI] [PubMed] [Google Scholar]
- 36.Neeley WL, Essigmann JM. Mechanisms of formation, genotoxicity, and mutation of guanine oxidation products. Chem Res Toxicol. 2006;19:491–505. doi: 10.1021/tx0600043. [DOI] [PubMed] [Google Scholar]
- 37.Chan K, et al. An APOBEC3A hypermutation signature is distinguishable from the signature of background mutagenesis by APOBEC3B in human cancers. Nat Genet. 2015;47:1067–1072. doi: 10.1038/ng.3378. [DOI] [PMC free article] [PubMed] [Google Scholar]
- 38.Bressac B, Kew M, Wands J, Ozturk M. Selective G to T mutations of p53 gene in hepatocellular carcinoma from southern Africa. Nature. 1991;350:429–431. doi: 10.1038/350429a0. [DOI] [PubMed] [Google Scholar]
- 39.Hsu IC, et al. Mutational hotspot in the p53 gene in human hepatocellular carcinomas. Nature. 1991;350:427–428. doi: 10.1038/350427a0. [DOI] [PubMed] [Google Scholar]
- 40.Scorsone KA, Zhou YZ, Butel JS, Slagle BL. p53 mutations cluster at codon 249 in hepatitis B virus-positive hepatocellular carcinomas from China. Cancer Res. 1992;52:1635–1638. [PubMed] [Google Scholar]
- 41.Li D, Cao Y, He L, Wang NJ, Gu JR. Aberrations of p53 gene in human hepatocellular carcinoma from China. Carcinogenesis. 1993;14:169–173. doi: 10.1093/carcin/14.2.169. [DOI] [PubMed] [Google Scholar]
- 42.Wellcome Trust Sanger Institute 2016 Catalogue of somatic mutations in cancer (COSMIC). Available at www.sanger.ac.uk/. Accessed January 17, 2017.
- 43.Villar S, et al. Aflatoxin-induced TP53 R249S mutation in hepatocellular carcinoma in Thailand: Association with tumors developing in the absence of liver cirrhosis. PLoS One. 2012;7:e37707. doi: 10.1371/journal.pone.0037707. [DOI] [PMC free article] [PubMed] [Google Scholar]
- 44.Naugler WE, et al. Gender disparity in liver cancer due to sex differences in MyD88-dependent IL-6 production. Science. 2007;317:121–124. doi: 10.1126/science.1140485. [DOI] [PubMed] [Google Scholar]
- 45.Nohmi T, et al. A new transgenic mouse mutagenesis test system using Spi- and 6-thioguanine selections. Environ Mol Mutagen. 1996;28:465–470. doi: 10.1002/(SICI)1098-2280(1996)28:4<465::AID-EM24>3.0.CO;2-C. [DOI] [PubMed] [Google Scholar]
- 46.Kennedy SR, et al. Detecting ultralow-frequency mutations by Duplex Sequencing. Nat Protoc. 2014;9:2586–2606. doi: 10.1038/nprot.2014.170. [DOI] [PMC free article] [PubMed] [Google Scholar]


