Significance
In metazoans, topological domains are regions in the genome that more frequently associate with themselves than with neighboring regions. These domains are important for regulating transcription and replication. However, topological domains were thought to be absent in budding yeast. Thus, we did not know the degree of conservation of topological organization and its associated functions. Herein, we describe the existence of topologically associating domains in budding yeast and show that these domains regulate replication timing so that origins within a domain fire synchronously. Our work showing conservation in budding yeast sets the stage to use yeast genetics to interrogate the molecular basis of the topological domains defining genome architecture.
Keywords: genome organization, budding yeast, DNA replication, cell cycle, systems biology
Abstract
The genome of metazoan cells is organized into topologically associating domains (TADs) that have similar histone modifications, transcription level, and DNA replication timing. Although similar structures appear to be conserved in fission yeast, computational modeling and analysis of high-throughput chromosome conformation capture (Hi-C) data have been used to argue that the small, highly constrained budding yeast chromosomes could not have these structures. In contrast, herein we analyze Hi-C data for budding yeast and identify 200-kb scale TADs, whose boundaries are enriched for transcriptional activity. Furthermore, these boundaries separate regions of similarly timed replication origins connecting the long-known effect of genomic context on replication timing to genome architecture. To investigate the molecular basis of TAD formation, we performed Hi-C experiments on cells depleted for the Forkhead transcription factors, Fkh1 and Fkh2, previously associated with replication timing. Forkhead factors do not regulate TAD formation, but do promote longer-range genomic interactions and control interactions between origins near the centromere. Thus, our work defines spatial organization within the budding yeast nucleus, demonstrates the conserved role of genome architecture in regulating DNA replication, and identifies a molecular mechanism specifically regulating interactions between pericentric origins.
An important distinction between eukaryotic and prokaryotic cells is the presence of the eukaryotic nucleus, which compartmentalizes the cell. It is becoming increasingly clear that the eukaryotic nuclear compartment contains additional layers of spatial organization, including the nucleolus, splicing bodies, transcriptional foci, and the peripheral localization of telomeres (1, 2). In addition, high-throughput chromosome conformation capture (Hi-C) technologies have recently revealed the spatial organization of chromatin into topologically associating domains (TADs) on the 100-kb to 1-Mb scale for mammals (3, 4), as well as the fly Drosophila melanogaster (5), the worm Caenorhabditis elegans (6), and the fission yeast Schizosaccharomyces pombe (7). Loci within a TAD are much more likely to interact with one another than with loci outside the domain (5, 8, 9).
In metazoans, topological domains play important roles in coordinating the DNA-templated processes of replication and transcription (10–12). Chromatin within a TAD tends to have similar histone modifications, and consequently euchromatic or heterochromatic state, so that the genome is organized into self-associated globules that are either permissive or repressive of transcription. Repressive TADs are likely to be associated with the nuclear periphery (8). In addition to coordinating transcription, TADs also coordinate replication so that replication origins within a domain activate synchronously.
That TAD nuclear organization is important for transcription and replication has motivated much recent work on the molecular mechanisms underlying TAD formation. The regions separating one TAD from another are referred to as boundaries and are essential for TAD organization. Removing a boundary region results in the merging of two adjacent TADs (9). Boundaries are enriched with insulator elements, such as CTCF, the loss of which disrupts TAD boundaries (5, 8–10, 13, 14). In addition, both fission yeast and mammalian TADs depend on cohesin (7, 15).
Previous work suggests that TADs are conserved across diverse phyla, but are not present in Saccharomyces cerevisiae (16). TAD organization has been associated with a fractal globule model of polymer folding, whose scaling relationship between genomic distance and contact frequency fits metazoan but not yeast data (17, 18). Furthermore, in silico modeling using polymer models and known constraints of the budding yeast nucleus showed that many features of yeast Hi-C data, including chromosome territories and self-association of centromeres, telomeres, and chromosome arms, could be explained without TADs (19–21).
Although previous work showed no evidence of TADs in budding yeast, one of the key features of topological domains, spatially coordinated DNA replication, was previously reported (22). More specifically, origins located near budding yeast centromeres are known to fire early and those near telomeres to fire late. Genetic manipulation to place early firing centromere-proximal origins near telomeres results in late firing, whereas placing centromeres near late-firing origins results in early firing (22). Furthermore, origins close to each other along a chromosome fire more synchronously than distant origins, suggesting that nearby replication timing is coordinated (23, 24). In addition to 1D proximity on a chromosome, 3D proximity is also correlated with replication timing (19, 25). Taken together, this body of work suggests a role for the spatial organization of the nucleus in coordinating replication timing in budding yeast.
Although nuclear organization may be important for coordinating budding yeast replication, the genome architecture and molecular basis of this organization is poorly understood. A number of factors affect replication timing, including chromosomal location and proximity to binding sites of the Forkhead proteins, Fkh1 and Fkh2 (25). It has been suggested that not only do Fkh1/2 determine replication timing, but they may also be required for the increased frequency of contacts among early origins (25). This theory led to a model in which the 3D organization of origin–origin contacts regulates replication timing.
In contrast to previous work, herein we report the existence of TAD-like structures in budding yeast, in which chromosomal regions have more contacts within domains than across domain boundaries. Budding yeast TADs are ∼200 kb in size, which distinguishes them from recently reported self-associated domains, which are less than 10 kb in size (26). We find that our TAD-like domains do not seem to play a significant role in transcription, but correlate strongly with replication timing. Origins within a TAD are much more likely to fire synchronously than origins in different TADs even when they are a similar distance apart on a chromosome. We find that the replication regulators Fkh1/2 control contacts among origins in TADs containing centromeres (referred to as pericentric domains). This finding indicates that there are likely distinct molecular mechanisms controlling pericentric and nonpericentric chromosome contacts. Taken together, our data suggest a model where TAD organization within chromosomes, in conjunction with Fkh1/2-dependent associations across chromosomes, spatially organize the nucleus to determine replication timing.
Results
Analysis of S. cerevisiae Hi-C Data Reveals TADs.
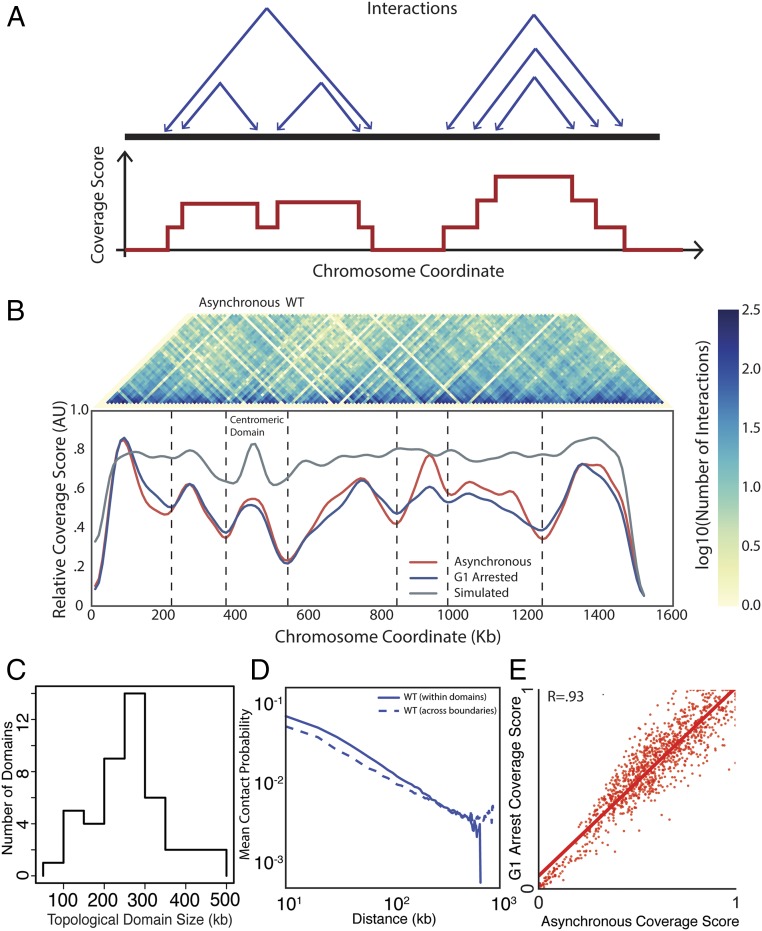
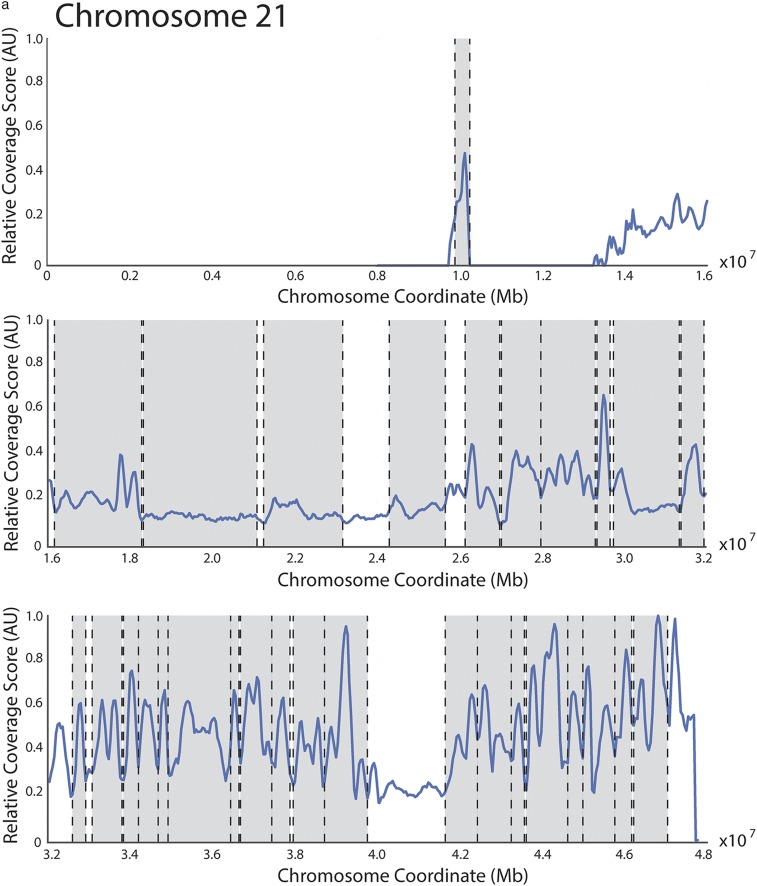
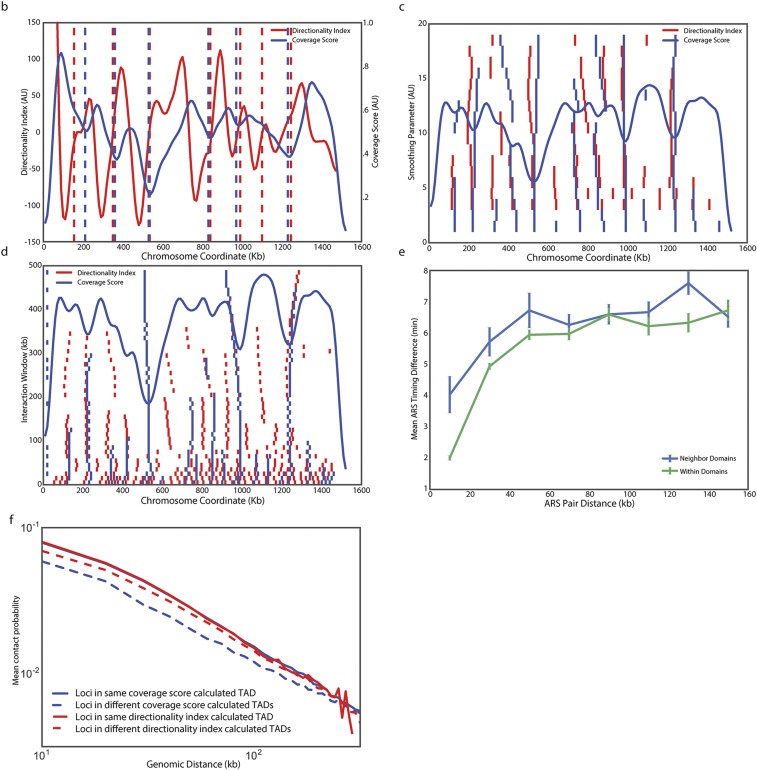
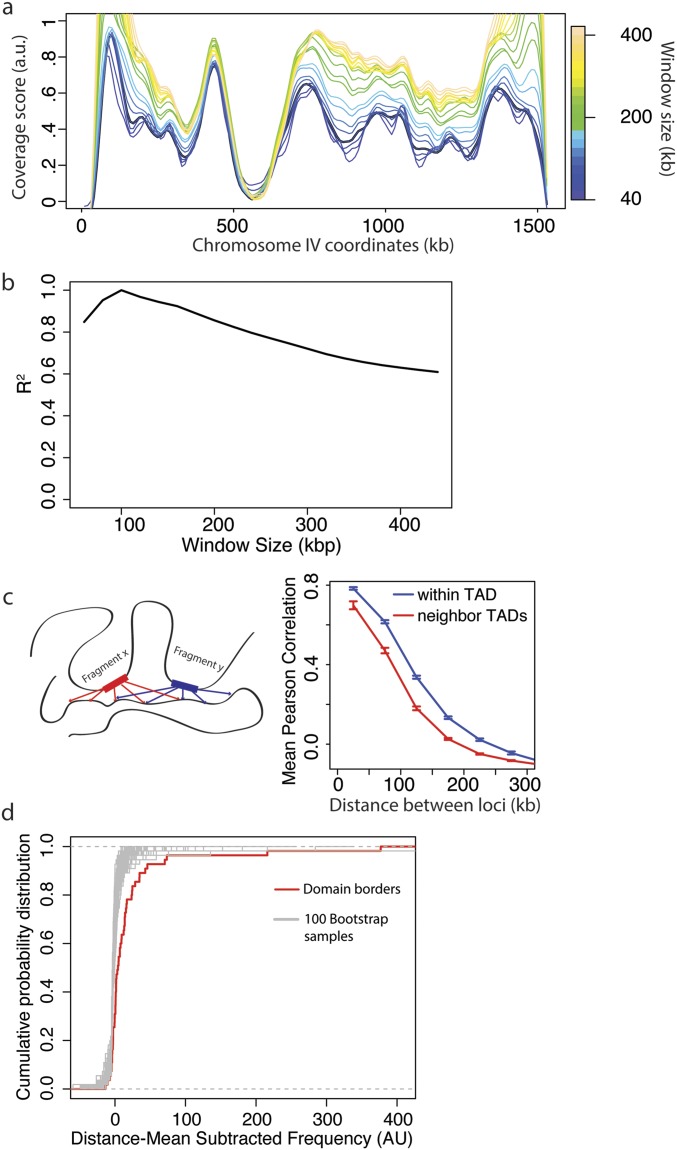
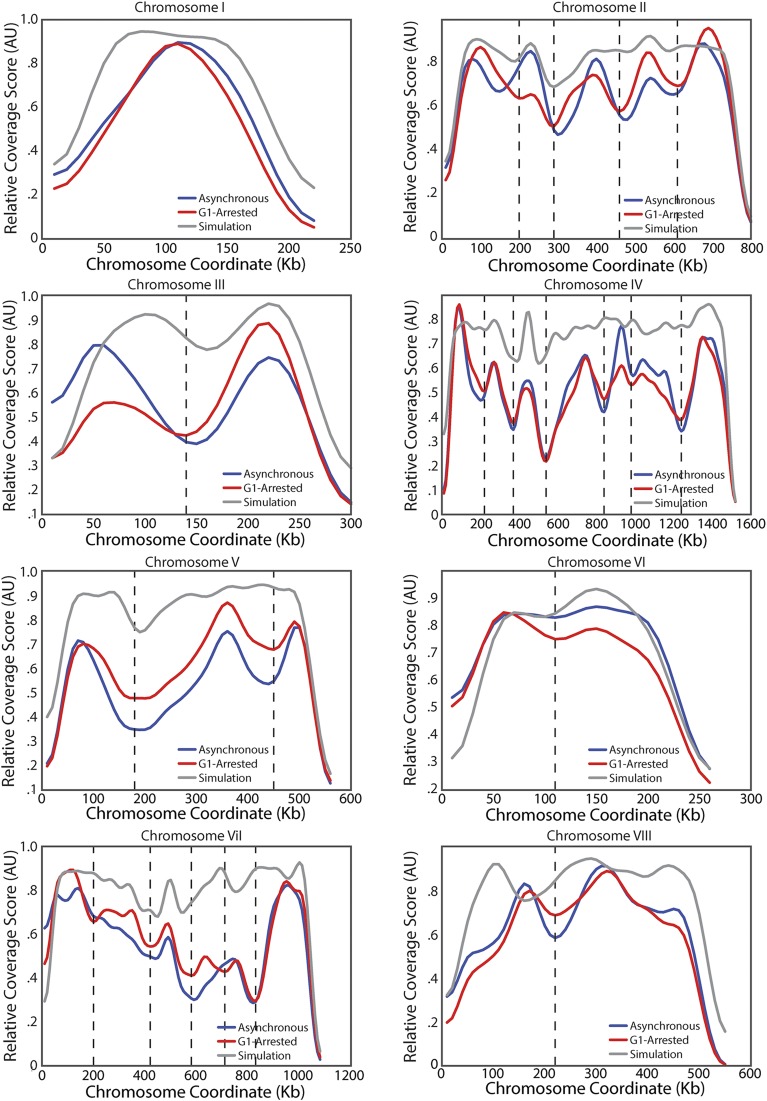
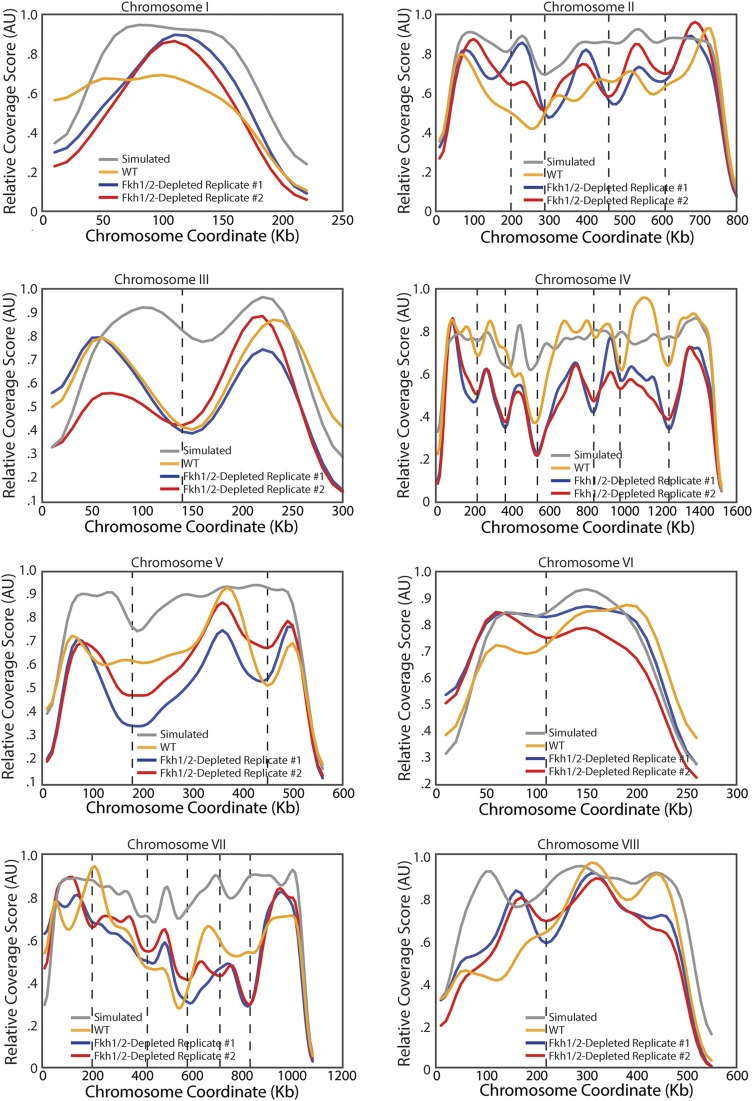
To test the hypothesis that yeast chromosomes adopt a domain-like structure, we developed a measure of association that we call “coverage score.” The coverage score for a specific locus is the sum of interactions that span that location in linear genomic coordinates (Fig. 1A). Thus, we expect coverage to drop at boundaries because few loci in one domain will interact with the neighboring domain: that is, few interactions will span the boundary. Significant oscillations in the coverage score indicate a domain structure, whereas a uniform coverage score indicates a lack of domain structure. We first applied our coverage analysis to Hi-C data for human fetal lung cells (8) and compared our coverage score with previously called domain boundaries. Nearly all previously identified domain boundaries are located near minima in the coverage score (Fig. S1A). Having validated our method on human Hi-C data, we next applied our coverage analysis to a previously generated yeast Hi-C dataset (19). Coverage varied along chromosomes, providing strong evidence for domains (Fig. 1B and Figs. S1B and S2 A and B). When we applied our coverage score to a null model, based on steric interactions between chromosomes, centromeric and telomeric tethering, and DNA polymer physics (21), we only identified centromeric domains. We developed a procedure to identify TADs, which found 41 TADs with a median size of 260 kb, which is similar in size to TADs found in D. melanogaster and some of the smaller mammalian domains (Methods, Fig. 1C and Table S1) (4, 5, 8). The boundaries identified by minima in coverage score were similar to those found by identifying changes in directionality index, as used in Dixon et al. (8) (Fig. S1B). However, our coverage score method was more robust because the boundary number and position were less sensitive to changes in parameters than the directionality index method (Fig. S1 C and D). Pairs of loci at a given distance within a predicted domain have a greater likelihood of interacting than pairs of loci in different domains calculated using the coverage score, but not the directionality index (Fig. 1D and Fig. S1F). Moreover, the interactions between loci of similar linear genomic distance were more similar if the loci were located within the same TAD (Fig. S2C).
Fig. 1.
Identification of TADs in the yeast genome. (A) Schematic of coverage score, which is the number of intrachromosomal interactions that span a specific locus (Methods). Highly covered loci are expected to be at the center of TADs, whereas poorly covered loci are expected to be in boundary regions between TADs. (Upper) Each set of two arrows points to loci denoting interactions. (Lower) Coverage score corresponding to the six interactions above. (B) Heatmap denoting the frequency of interactions in asynchronous WT Hi-C data between two loci on chromosome IV (Upper) and corresponding coverage score (Lower) for asynchronous (red) and G1-arrested (blue) cells. Vertical lines denote domain boundaries corresponding to minima in the coverage score (Methods). The null model (gray) that only identifies centromeric domains was generated by simulations following ref. 21, combining polymer physics and positional constraints. (C) Distribution of TAD sizes for all chromosomes in G1-arrested cells. (D) Normalized interaction frequency plotted as a function of distance for pairs of loci located within domains (solid) or across domain boundaries (dashed). (E) Correlation of coverage score for all chromosomes for pheromone arrested and asynchronous cells.
Fig. S1.
Coverage score identifies domain boundaries that are similar to but not identical to the boundaries found using the directionality index. (A) Hi-C data from human IMR90 fibroblasts from Dixon et al. (8) was analyzed as the yeast Hi-C data to produce a coverage score across chromosome 21. No parameters were modified from the yeast analysis. This finding indicates that coverage score minima frequently correspond to domain boundaries previously identified using a hidden Markov model (8). Previously identified domains are denoted with shaded regions and boundaries by dashed lines. (B) Plot comparing budding yeast chromosome IV coverage score (blue) to the directionality index defined by Dixon et al. (8) (red). Boundaries identified by each metric are shown with color matched dashed vertical lines. Boundaries for the directionality index were identified as locations where the smoothed directionality score transitioned from negative to positive values. Plots of boundaries identified on yeast chromosome IV using the directionality index and coverage score methods when parameters are varied. When either the smoothing parameter (C) or the interaction window (D) are varied, the number and positions of boundaries change less for coverage than for directionality. In C and D, coverage score is plotted (blue curve) for comparison. The y axis denotes the value of the parameter being varied. Small vertical tick marks denote boundaries found using either coverage score (blue) or directionality index (red). (E) The difference in replication timing for pairs of replication origins located within the same domain (green) or across domain boundaries (blue) is more similar when boundaries are identified using the directionality index than when boundaries are identified using the coverage score (smoothing parameter = 10, interaction window = 50 kb for both methods) (compare with Fig. 4C). (F) Normalized interaction frequency plotted as a function of distance for pairs of loci located within domains (solid) or across domain boundaries (dashed) calculated using the coverage score (blue) or directionality index (red) metrics. The effect of coverage score calculated domain boundaries on interaction frequency is more pronounced.
Fig. S2.
Analysis of coverage score parameters and TAD properties. (A) Coverage score for chromosome IV for window sizes between 20 and 200 kb. See Methods for a more detailed description of how the coverage score is calculated. Briefly, for the analysis in the main text, the coverage score for each 10-kb bin was calculated by finding the total number of interactions between fragments in a 100-kb window centered on the bin of interest. Here we show how the coverage score varies when the window size is changed. (B) Correlation R2 between coverage scores calculated for a 100-kb window with coverage scores calculated for window sizes between 40 and 400 kb. (C, Left) Schematic showing how the interactions for two fragments in a TAD are expected to be correlated. (Right) Mean Pearson correlation for all fragments as a function of their distance apart and whether or not they are in the same TAD. (D) Cumulative distribution of mean subtracted domain boundary interaction frequencies compared with randomly selected fragments from the whole genome. For each distance apart, there is a mean frequency of interactions. For each pair of domain boundary fragments, this distance-dependent mean frequency was subtracted from their frequency of interactions. The distribution of boundary fragment interaction frequencies was compared with 100 bootstrap samples, randomly chosen from all of the elements in the genome. The set of domain boundaries was more highly interacting than all other 100 bootstrap samples.
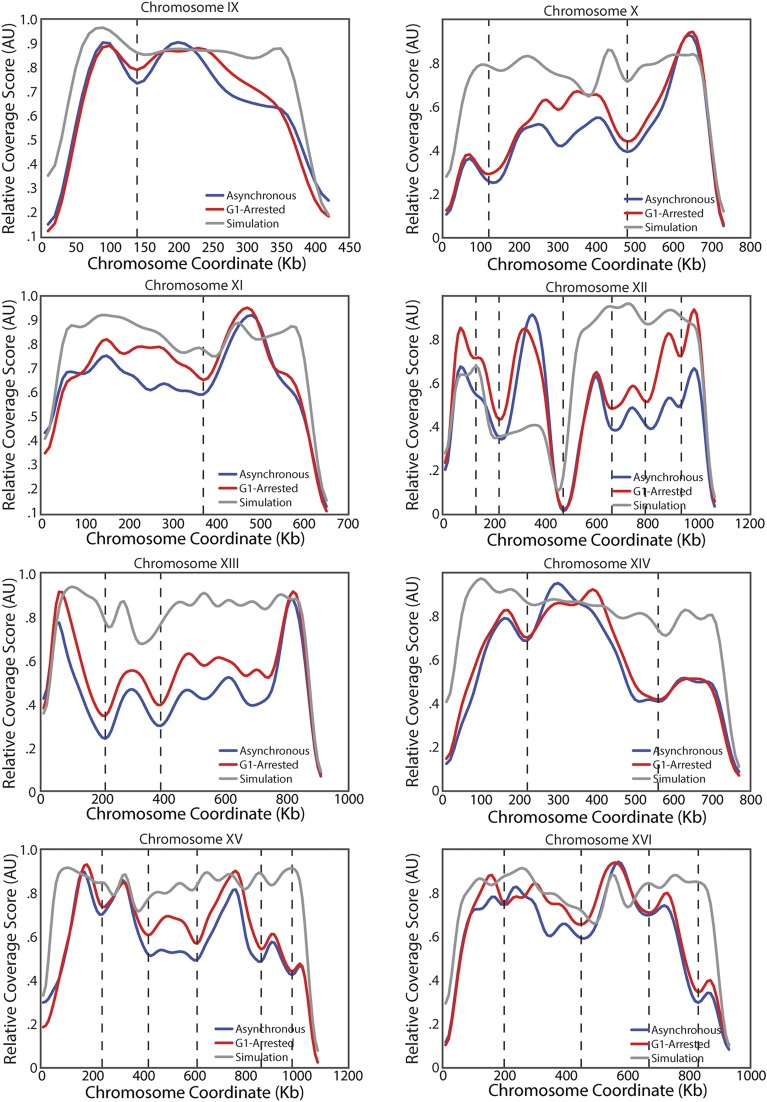
Because our TADs are based on Hi-C data from an asynchronous culture, it was possible that our conclusions resulted from a small number of mitotic cells with a higher degree of chromosome condensation and therefore do not reflect interphase organization. To test this possibility, we performed Hi-C on cells arrested in G1 phase by exposure to mating pheromone. We observed that these G1-arrested cells exhibit a similar coverage score profile to the profiles of freely cycling cells (Fig. 1E and Fig. S3). Thus, TAD organization is not the result of mitotic condensation. In addition, the genome-wide changes in transcription associated with G1 pheromone arrest (27) do not influence domain organization. Similarly, mammalian TADs are already established in the G1 phase of the cell cycle (28) and remain nearly the same across cell types with very different transcriptional programs (29, 30). These observations suggest that stable chromosome conformation across cellular states is a conserved feature of genome organization.
Fig. S3.
Coverage score for all chromosomes in asynchronous and G1 arrested cells. Plot as for chromosome IV in Fig. 1B for all 16 yeast chromosomes.
Domain Boundaries Are Enriched for Markers of Transcriptional Activity.
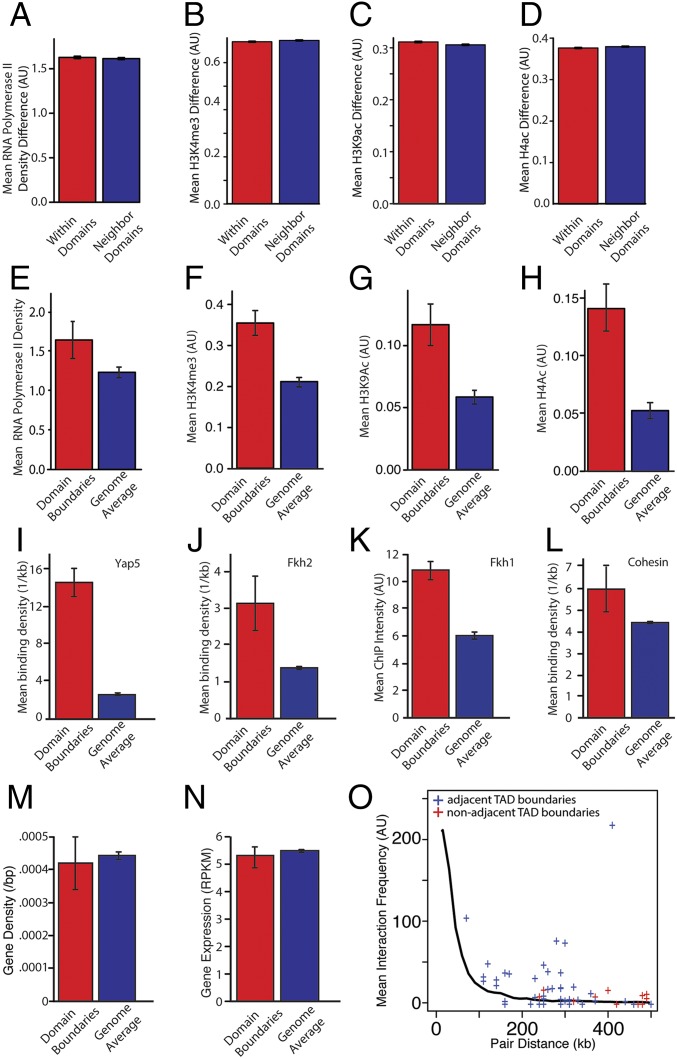
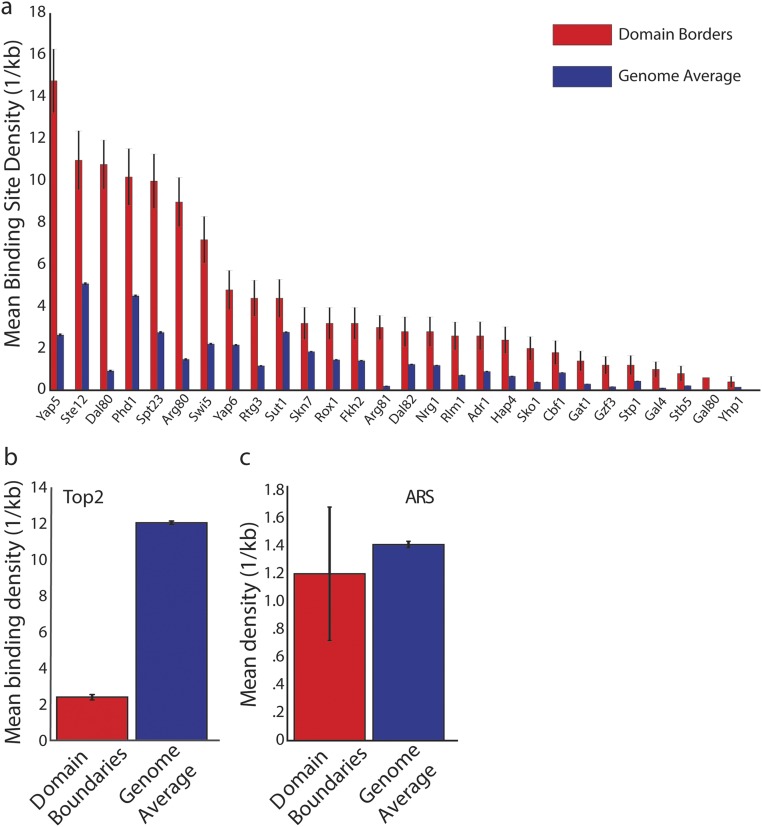
Metazoan topological domains correlate with histone modifications and transcriptional activity (5, 8, 10). Because correlated transcriptional activity within metazoan TADs is a hallmark of this type of chromatin organization, we decided to investigate the relationship between transcription and yeast TAD organization. To test this relationship, we examined the difference in active RNA polymerase II density at loci within and across domains. We did not find a significant difference in density, which is consistent with the notion that proximal elements generally determine transcriptional regulation in yeast (Fig. 2A) (P > 0.05). We also found minimal differences in histone modifications within and across domains (Fig. 2 B–D). Because metazoan TAD boundaries exhibit differential chromatin regulation, we tested for a similar effect in yeast. We consistently found significant differences in RNA polymerase II density and histone modifications within 5 kb of boundaries compared with the rest of the genome (Fig. 2 E–H). Next, we sought to examine if boundary elements were enriched for specific transcription factor binding sites. We analyzed the location of binding sites, as determined by MacIsaac et al. (31), relative to TAD boundaries. We found enrichment for Fkh2, Yap5, and other transcription factor binding sites (Fig. 2 I and J, Fig. S4A and Table S2). Examination of ChIP-chip data from refs, 25, 32, and 33 revealed that Fkh1 was enriched at boundaries, whereas topoisomerase II was depleted (Fig. 2K and Fig. S4B). Cohesin shows slight enrichment at boundaries, but the effect is not statistically significant (Fig. 2L) (P = 0.07). We ensured that these observations were not the consequence of different gene density at boundaries, which were similar to the rest of the genome (Fig. 2M). Next, we tested whether the difference in transcriptional activity led to a steady-state difference in transcript abundance as measured by RNA-seq. However, we found that there was no significant difference in overall expression, which might be because of mRNA processing and degradation (Fig. 2N). In addition, domain boundaries interact much more with one another than would be expected for loci of similar genomic distance apart (Fig. 2O and Fig. S2D) (P < 0.01). We speculate that these interboundary contacts may play some role in organizing yeast TADs. Taken together, these data indicate that boundary elements might contribute to gene expression but, unlike in metazoans, transcriptional activity differs little, if at all, between TADs.
Fig. 2.
Transcription is enriched in TAD boundaries. (A–D) For each gene we calculate the mean RNA polymerase II density and level of histone modification. We then determine the difference in these values for all gene pairs in two neighboring TADs. For gene pairs within a TAD and for gene pairs spanning a TAD boundary, the differences in polymerase II density and histone modifications are not statistically different (P > 0.05). (E–H) A gene was defined as being within a TAD boundary region if it is within 5 kb of the boundary. Compared with the average for the whole genome, RNA polymerase and associated histone modifications are significantly enriched at TAD boundary regions. (I and J) Binding site density relative to TAD boundaries for Yap5 (I) and Fkh2 (J). ChIP-chip data were used to estimate the mean signal for (K) Fkh1 and (L) cohesin. The transcription factors Fkh2, Yap5, and Fkh1 are enriched at TAD boundaries (P < 0.01 for all comparisons). P values were calculated using Bonferroni correction for multiple hypothesis testing. (M) Gene density at domain boundaries compared overall gene density. (N) Transcript abundance from genes at domain boundaries compared with all other genes. (O) Interaction frequency for TAD boundaries on the same chromosome as a function of their genomic distance apart. Each + indicates intrachromosomal interaction frequency for a pair of boundaries. The solid line denotes the average distance-dependent interaction frequency for all fragments. TAD boundaries interact more frequently with one another than expected given their genomic distance (P < 0.01 compared with datasets having the same number of pairs the same distance apart whose interaction frequency was determined by sampling from the distance-dependent interaction distribution).
Fig. S4.
Additional domain boundary analysis. (A) Transcription factors whose binding site densities that were significantly enriched in boundary regions. TAD boundaries were defined as a 10-kb window centered on the minimum of the coverage score. Transcription factor binding density estimates are from MacIsaac et al. (31). (B) Topoisomerase II (Top2) was depleted at TAD boundaries as determined by differences in ChIP-chip signal from Sperling et al. (33). (C) Replication origins are not found more frequently with boundary regions compared with the genome overall.
Timing of Cell Cycle-Dependent Gene Expression Is Independent of Genome Position.
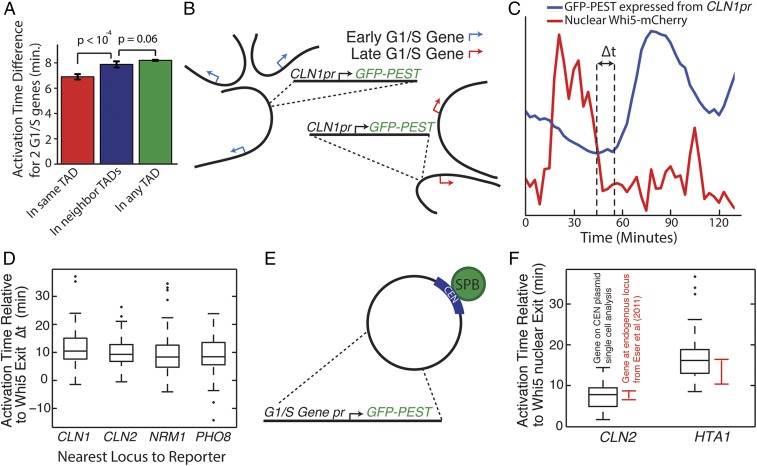
Although mRNA abundance and markers of transcriptional activity are most often examined, the ability to dynamically activate or repress transcription is also affected by chromatin and is associated with nuclear position (34). To test if transcription dynamics are affected by genome architecture, we examined the timing of transcriptional activation during the cell cycle. We restricted our attention to 291 genes activated by the related heterodimeric transcription factors SBF (Swi4–Swi6) and MBF (Mbp1–Swi6), which were previously defined as the G1/S regulon (35, 36). To test if topological domains contribute to transcriptional activation, we examined differences between the activation time of genes located within a domain compared with those located across different domains. Timing of activation within domains was only slightly (about 1 minute) more similar than across domains (P < 10−4), suggesting that topological domains could explain a little of the 30-min variation in timing across the G1/S regulon (Fig. 3A). To test if domain location affects the timing of transcriptional activation, we integrated 1 kb of an early gene promoter (CLN1) driving the expression of a destabilized GFP reporter at loci near early or late transcribed SBF- or MBF-regulated genes (Fig. 3B). Distributions of transcriptional activation timing relative to Whi5–mCherry nuclear export, which marks the G1/S transition known as Start (37), was the same for all loci, suggesting that there is little if any spatial effect on transcriptional activation timing (P > 0.05) (Fig. 3 C and D). Consistent with this conclusion, the timing of the SBF-regulated genes HTA1 and CLN2 expressed from CEN (centromere) plasmids that maintain a constant nuclear position near the spindle pole body, was similar to their timing when expressed from their endogenous loci (Fig. 3 E and F). Thus, timing of cell cycle-dependent transcriptional activation was independent of gene location.
Fig. 3.
Cell cycle-dependent transcriptional activation is independent of gene nuclear location. (A) The timing of transcriptional activation in the cell cycle for all genes regulated by the SBF and MBF G1/S transcription factors was calculated in Eser et al. (35). Genes within the same TAD are activated at similar times compared with genes in neighboring domains. (B) Schematic of G1/S gene translocation experiment in which a construct containing an early gene promoter, CLN1pr, regulating a destabilized GFP, is integrated next to either an early activated gene or a late activated gene. (C) Transcriptional activation time in the cell cycle was calculated relative to the exit of the transcriptional inhibitor Whi5 from the nucleus, which marks the point of commitment to the cell cycle in late-G1 phase. Cells express a Whi5–mCherry fusion protein from the endogenous locus. (D) CLN1pr-GFPpest was integrated at the CLN1, CLN2, NRM1, and PHO8 loci, but this did not change the distribution of promoter activation times (P > 0.05 all comparisons). (E) Schematic for experiment comparing gene activation times for promoter GFP constructs expressed from CEN (centromere) plasmids, which localize near the spindle pole body (SPB). (F) The relative timing of transcriptional activation is similar for an early activated (CLN2) and a late activated (HTA1) gene expressed from either CEN plasmids or the genome. Data for transcriptional activation from the genomic loci are from Eser et al. (35).
Topological Domains Predict Replication Timing.
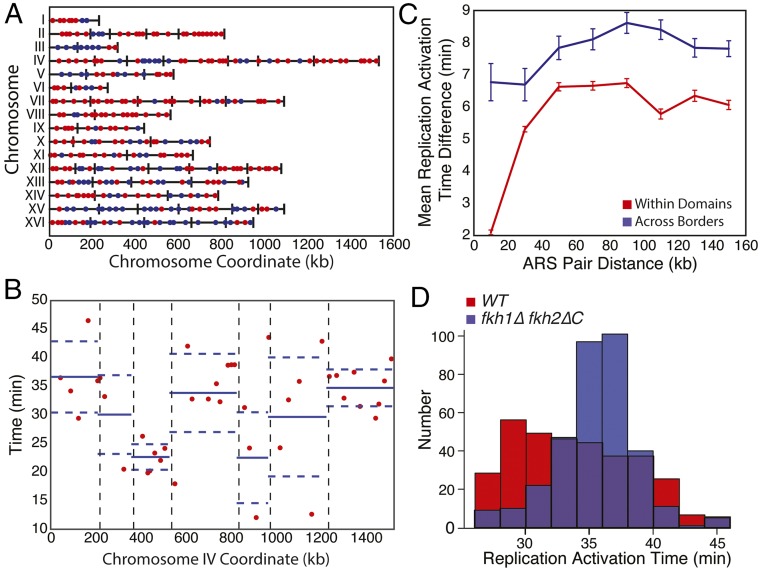
Having examined the relationship between TADs and transcriptional regulation, we turned our attention to DNA replication, which is influenced by topological domains in metazoans (12, 38). DNA replication is activated at different times at different origins, but neighboring origins on the same chromosome tend to replicate synchronously (39, 40) (Fig. 4A). Replication starts earlier near centromeres and later near telomeres, and is likely affected by nuclear organization (22, 25). Origins replicating at similar times preferentially associate in three dimensions, which is reflected in two broad genome-wide clusters comprised mostly of early or late replicating origins (19, 25).
Fig. 4.
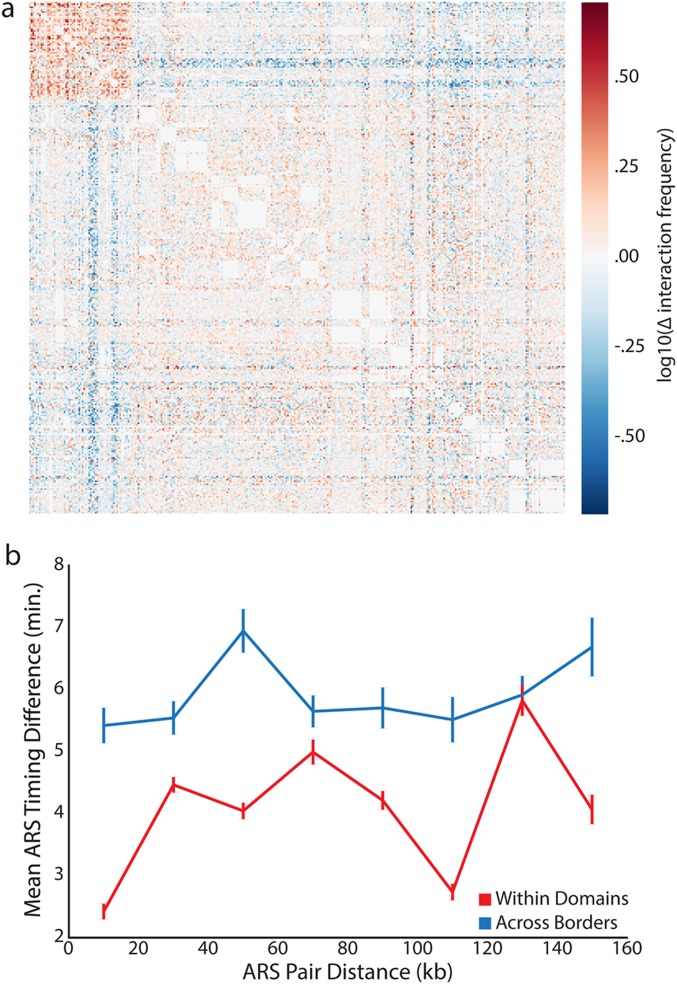
Replication origins within TADs synchronously initiate DNA replication. (A) Origins were classified as early (blue) or late (red). Replication timing exhibits spatial correlation. Black lines denote TAD boundaries. (B) TAD boundaries (vertical dashed lines) separate clusters of similarly timed origins on chromosome IV. Each dot denotes the location and activation time of a single origin as determined by Raghuraman et al. (41). For all origins within a TAD, the blue solid and dashed horizontal lines represent the mean activation time and its SE. (C) The difference in replication timing between origins (ARS, autonomously replicating sequences) within TADs is smaller than for origins of similar distance apart in different TADs. (D) fkh1∆ fkh2∆C mutants more synchronously replicate their DNA compared with WT. Data from Knott et al. (25) were analyzed.
Two hypotheses might explain spatial correlations in replication timing. Either there is a length scale over which origins lose temporal correlation or there are discrete boundaries separating groups of similarly timed origins. To distinguish between these two possibilities, we set out to determine if the boundaries of topological domains separate clusters of similarly timed origins. When comparing origins of similar distance apart in linear chromosome coordinates, we found that the difference in replication timing between origins within topological domains was less than that between origins separated by a domain boundary (Fig. 4 B and C) (P < 10−3 all comparisons for distance bins in Fig. 4C). We note that the analysis in Fig. 4 is based on replication timing data from Raghuraman et al. 41. Our analysis suggests that topological domains in yeast may represent regions of coregulated DNA replication separated by boundary elements.
We emphasize that our 41 yeast TADs define intrachromosomal replication domains on linear coordinates, which is very different from previous analysis that defined two interchromosomal clusters of similarly timed origins (19, 25). However, it was also noted that the replication timing of groups of neighboring origins were similarly affected in cells lacking FKH1 and expressing a mutant allele of FKH2 (25). Intriguingly, these FKH mutant cells synchronously replicated their genome, resulting in an overall narrowing of the distribution of replication times (Fig. 4D), and exhibited a modified distribution of interactions for ARS305 (25). Taken with our observation that Fkh1 and Fkh2 are enriched at domain boundaries (Fig. 2 J and K), these data suggest a potential role for Fkh factors in organizing genome architecture.
Fkh1 and Fkh2 Are Not Required for TAD Formation, but Promote the Association of Pericentric Origins.
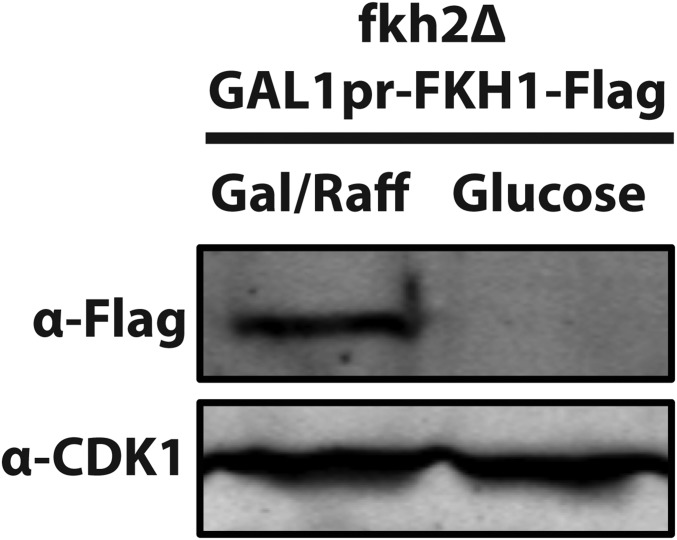
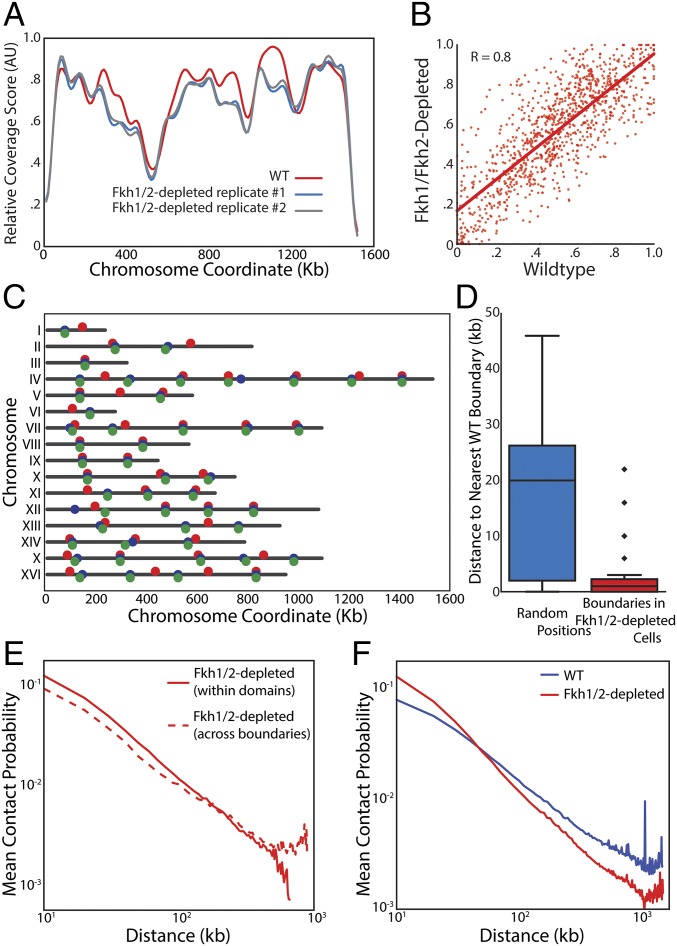
To test the hypothesis that Forkhead transcription factors regulate genome architecture, we sought to measure interaction frequencies across the genome in cells lacking the two Forkhead transcription factors, Fkh1 and Fkh2. Because of the severe phenotype of fkh1∆fkh2∆ cells (42), we generated a strain conditionally expressing FKH1 from a galactose-regulated GAL1 promoter in a fkh2∆ background (GAL1pr-FKH1 fkh2Δ). We grew these cells overnight on media containing galactose before switching cells to media containing glucose to shut off exogenously controlled FKH1 expression. Cells were grown for another 8 h on glucose media so that there was no detectable Fkh1 protein at the time we performed DNase Hi-C (Fig. S5). The resultant data were used to calculate coverage scores for all chromosomes (Fig. 5A and Fig. S6). We note here that we now performed Hi-C using DNase digestion (43), a method not previously applied to yeast. Coverage scores were similar for WT cells applying either restriction enzyme or DNase digestion, indicating that genome architecture is not strongly sensitive to Hi-C method (Fig. S7 A–C). Coverage scores for WT and Fkh1/2-depleted cells were similar, suggesting that overall genome architecture is not strongly dependent on Fkh1/2 (Fig. 5 A and B). Moreover, domain boundaries determined in Forkhead mutants did not differ dramatically from WT domain boundaries (Fig. 5 C and D). Further supporting the preservation of domains in the absence of Forkhead, for loci a similar distance apart, interactions within domains remained more likely than interactions across domain boundaries (Fig. 5E). Taken together, our data strongly suggest that Fkh1 and Fkh2 are not required for the formation of topological domains.
Fig. S5.
Depletion of Fkh1-mCherry. GAL1pr-FKH1-mCherry fkh2∆ cells were grown as described in Methods on galactose containing media overnight (GAL1pr on). Cells were then diluted in either YP + 1% galactose 1% raffinose or YP + 2% (wt/vol) glucose (GAL1pr off) media to OD 0.05 as for Hi-C experiments. Cells were harvested and run on Western blot. For Hi-C experiments, cells were treated as with the glucose treatment and harvested at OD 1, at which point Fkh1 was undetectable.
Fig. 5.
TAD architecture does not depend on Fkh1/2. (A) Coverage score for chromosome IV for one WT and two Fkh1/2-depleted replicates showing no major changes in coverage in the absence of Fkh1/2. (B) Coverage in Fkh1/2-depleted cells is highly correlated with coverage in WT cells. Red line indicates the linear regression. (C) Diagram of chromosomes with boundaries marked as independently identified for WT (red) and Fkh1/2-depleted cells (blue and green denote biological replicates). (D) Comparison of distances from a boundary in Fkh1/2-depleted cells to the nearest boundary in WT cells (Right) compared with the distribution of distances from randomly chosen locations to the closest boundary in WT cells (Left). (E) Normalized interaction frequency plotted as a function of distance for pairs of loci located within a domain (solid) or across domain boundaries (dashed). (F) Normalized interaction frequency plotted as a function of distance for all pairs of loci in WT (blue) and Fkh-depleted (red) cells.
Fig. S6.
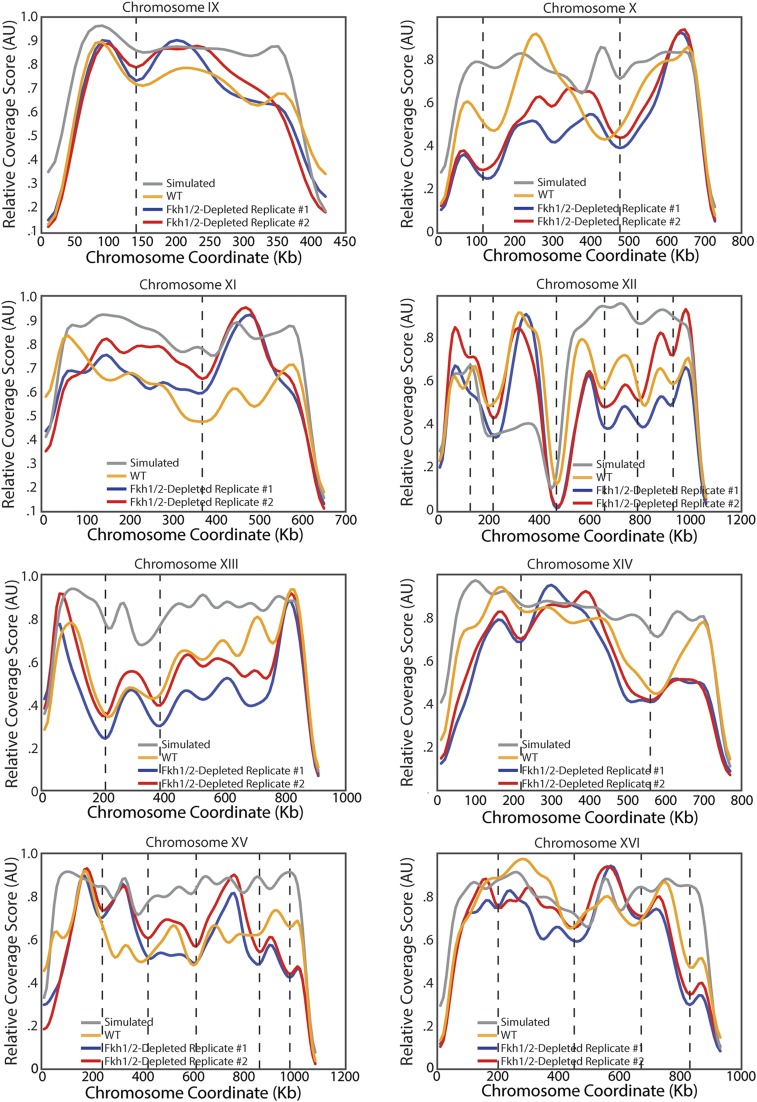
Coverage score for all chromosomes for DNase Hi-C in WT and Fkh-depleted cells. Plot as in Fig. 5A for all 16 yeast chromosomes.
Fig. S7.
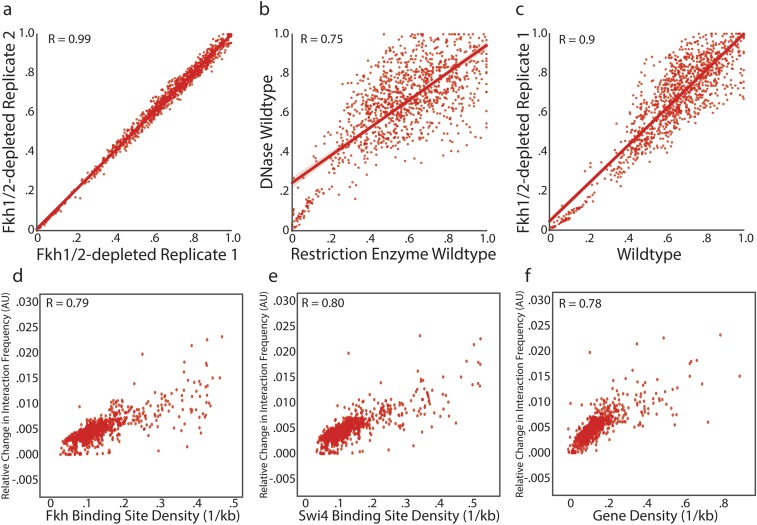
Correlation of coverage score for DNase-based and restriction enzyme-based Hi-C experiments. (A) Correlation of two biological replicates of DNase-based Hi-C for GAL1pr-FKH1 fkh2∆ cells. (B) Correlation of DNase-based Hi-C for asynchronous WT cells and restriction enzyme-based Hi-C for asynchronous WT cells. (C) Correlation of DNase-based Hi-C for asynchronous WT cells and restriction enzyme-based Hi-C for G1 arrested WT cells. (D–F) The difference in interaction frequency in WT and Fkh1/2-depleted cells as a function of Fkh1/2 binding site density (D), Swi4 binding site density (E), and gene density (F). Interaction frequency likely correlates with general transcriptional activity.
Intriguingly, Fkh1/2-depleted cells had a lower interaction frequency at longer distances than WT, suggesting a role for Fkh1/2 in promoting long-range interactions (Fig. 5F). To test the idea that Forkhead factors directly mediate long-range interactions, we examined the relationship between Fkh1/2 binding site density and changes in interaction frequency in WT and Fkh1/2-depleted cells for all bins. Consistent with this idea, Fkh1/2 binding site density correlates with changes in interaction frequency (Fig. S7D). However, so did the binding site density of the unrelated transcription factor Swi4 (Fig. S7E) and gene density (Fig. S7F). It is therefore unclear how specific Fkh1/2 binding affects interaction frequency.
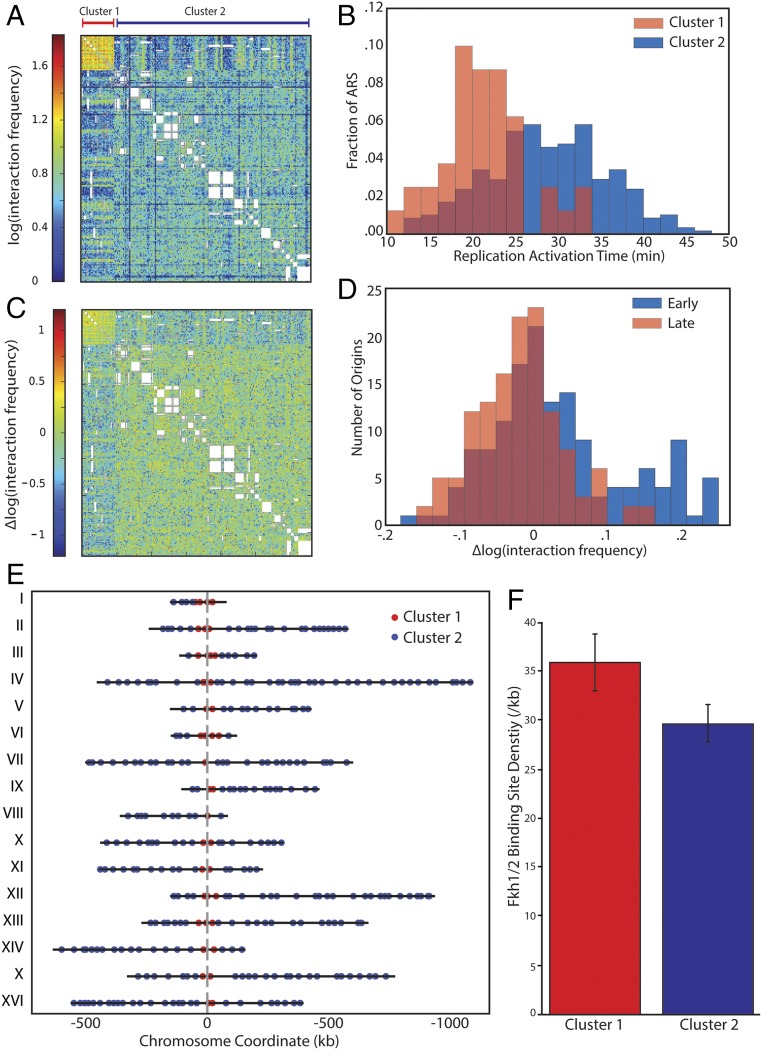
Previous observations suggested that the proximity of replication origins correlates with the synchrony of firing (19, 25). This finding indicates that although Fkh1/2 do not influence TAD formation, they might be critical for origin–origin interactions, which could be important for replication timing. To test this model, we compared the frequency of these contacts in WT and Fkh1/2-depleted cells. Consistent with previous observations, some early-activated replication origins (cluster 1) interact much more frequently with each other than late-activated replicating origins (cluster 2), and the origin–origin contacts cluster broadly into two groups (Fig. 6 A and B). Most of these interactions do not change in Fkh1/2-depleted cells. However, the subset of highly interacting early origins have an increased frequency of interaction with each other and a decreased frequency with the other origins (Fig. 6 C and D). Next, we examined the location of the Fkh1/2-dependent interacting origins and found they were exclusively located in centromere-proximal regions (Fig. 6E). Moreover, the long-range interactions with these pericentric origins that disappear following Forkhead depletion could be directly mediated by Forkhead factors because Fkh1/2 binding sites appear frequently near these origins (Fig. 6F). This finding is consistent with our previous observation that Forkhead factors promote longer-range interactions in general (Fig. 5F). We note that Hi-C data do not measure absolute interaction frequency. Rather, Hi-C data reflect the relative frequency of interactions. Therefore, our analysis cannot distinguish between an increase in absolute contact frequency within cluster 1 origins or a decrease in interactions of other loci with origins in cluster 1.
Fig. 6.
Fkh1/2-depletion controls the interaction frequency of pericentric early-replicating origins. (A) K-means clustered heat map showing the interchromosomal interaction frequency between all origins for WT cells. Interactions are shown only for fragments containing an origin as determined from Raghuraman et al. (41). (B) Distribution of replication timing for origins in either of the two clusters identified in A indicates that the smaller cluster is highly enriched for early-replicating origins. (C) K-means clustered heat map showing differences in origin–origin interaction frequency between WT and Fkh1/2-depleted cells. The subset of clustered origins had increased relative interaction frequency with each other and decreased relative interaction frequency with the rest of the genome. (D) Distributions of the change in interaction frequencies for early- and late-replicating origins. (E) Early-replicating origins, whose interactions are increased by Fkh1/2-depletion, are located near centromeres. (F) Density of Fkh1 and Fkh2 binding sites for bins containing origins in cluster 1 or cluster 2.
We note that it is unlikely that contacts with the centromeric sequence promote origin clustering as similar origin–origin clusters are observed when bins containing the centromeres are excluded from analysis (Fig. S8A). Previous work showed that centromeric regions are among the earliest replicating regions in budding yeast (44, 45). This raises the possibility that the chief effect of Fkh1/2 on replication timing is through modulation of replication and chromatin organization at the centromeres. To test this theory, we examined replication timing within domains and across domain boundaries after excluding all domains containing centromeres. As previously, we found that replication origins that are a given genomic distance apart fired more synchronously if the origins were in the same noncentromeric domain (Fig. S8B). Thus, we conclude that Fkh1/2 influence some origin–origin association and modulate replication timing, but do not appear to influence the overall genome architecture.
Fig. S8.
Replication timing correlation with TAD organization is not because of centromeric effects. (A) Difference in origin–origin interaction frequency from WT to Fkh1/2-depleted cells (as in Fig. 6C) assessed without including interactions with bins containing a centromere. The pattern of change in interaction frequency is not a result of interactions with bins containing the centromeres. (B) Mean replication timing differences and associated SE for ARS loci within and across domains was analyzed as in Fig. 4C after excluding all domains containing centromeres. Origins within domains activate at more similar times than those in neighboring domains.
Discussion
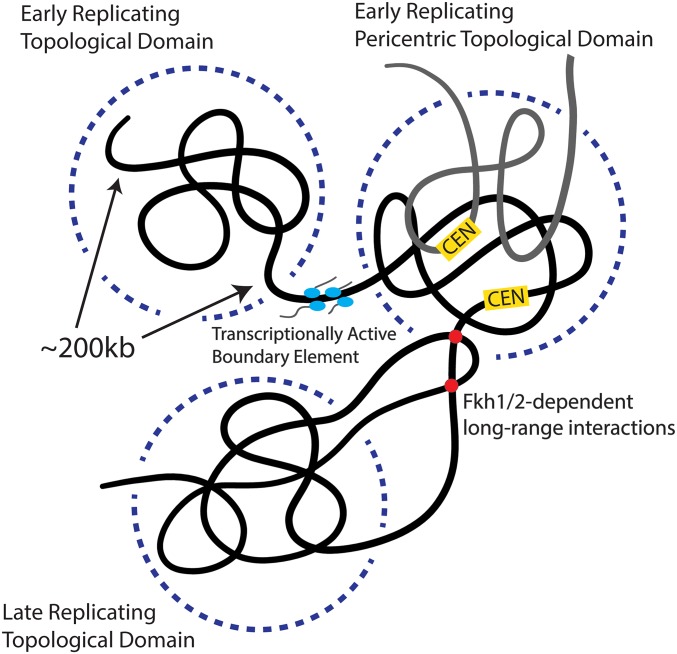
Here, we have shown that budding yeast chromosomes are organized into topological domains that separate regions of early- and late-replicated DNA (Fig. 7). The strong correlation between topological domains and replication timing functionally validates our TADs. That TADs are present in G1 before DNA replication supports an active role in regulating replication timing. Thus, genome architecture may explain the long-standing observations in yeast that replication synchrony is spatially organized along chromosomes and that moving origins from one place to another on the genome affects replication timing (22). This role for genome organization in replication timing was also found in mammalian cells (12, 46, 47). An additional similarity with metazoan TADs is that yeast domain boundaries are enriched for transcriptional activity markers as determined from RNA polymerase II density and histone modifications. However, in contrast to metazoan TADs, average transcriptional activity and the ability to activate transcription within different TADs is similar. Taken together, the relationship between yeast TADs, replication timing, and boundary transcriptional activity motivate our use of TAD nomenclature and suggest a conserved role for TADs in regulating replication timing across eukaryotes.
Fig. 7.
Model for how the genome is organized into early- and late-replicating TADs separated by regions enriched for transcriptional activity.
Although spatial localization affects replication timing, it is not the only determinant and we do not know what factors account for the remainder of variation in replication timing both within and across domains. In budding yeast, previous work showed that replication synchrony is regulated by Forkhead transcription factors (25). The regulation of replication timing by Forkhead transcription factors could be through the regulation of genome architecture. Indeed, it was suggested that the C-terminal domain of Fkh2 was required for origin–origin interactions, which led to a model of locally synchronized replication (25). However, this model was based on the examination of the contact frequencies of a single origin with the rest of the genome. In contrast, herein we used Hi-C data to perform a comprehensive analysis of all origin interaction frequencies to show that Forkhead transcription factors are not required for TAD formation. These factors do promote long-range interactions in general, including those with early-activated origins in pericentric domains. This finding suggests that Forkhead transcription factors regulate replication timing and specific genome contacts, but not overall genome architecture. Thus, our analysis supports the idea that replication timing likely requires both Forkhead transcription factors and topological domains. However, definitive testing of this model will require identification of genetic determinants of topological domains in budding yeast.
That genome architecture was nearly unchanged in cells lacking the Forkhead transcription factors Fkh1 and Fkh2 leaves the question of the molecular determinants of budding yeast TAD formation unanswered. Recent progress in metazoans may shed light on the budding yeast mechanism. Metazoan TAD boundaries are enriched for CTCF, a pleiotropic transcriptional regulator, which likely plays a mechanistic role in TAD architecture (5, 8–10, 13, 14). Although CTCF is not present in yeast, other factors with which it interacts are present and may participate in TAD formation. Specifically, CTCF interacts with cohesin, which is a key molecule for the formation of TADs in fission yeast and mammalian cells (7, 15). A direct mechanistic role for cohesin in TAD formation is supported by its enrichment at fission yeast TAD boundaries (7). Although cohesin could play a similar role in budding yeast, we did not find strong cohesin enrichment at TAD boundaries, suggesting the possibility of a distinct mechanism for domain boundary determination. Nevertheless, cohesin-mediated domain formation should not yet be ruled out for budding yeast.
In metazoans, topological domains affect transcription in addition to replication timing (48, 49). In contrast, in fission yeast, cohesin mutations affecting TAD structure have only a modest effect on transcription as transcript abundance is unchanged, but the termination location is altered (7). Similarly, we show here that transcriptional activity and histone modifications in budding yeast are similar from domain to domain. Although budding yeast TAD boundary elements are enriched for transcriptional activity, we do not yet know the implication of this observation. Whereas it remains possible that transcription determines TAD boundaries, we found that altering transcription by treatment with pheromone does not change the TAD structure.
Taken together, our results firmly establish functional topological domain architecture in budding yeast, thereby demonstrating its conservation across eukaryotes. Our identification of TADs implies extensive spatial organization within the nucleus. However, this is based on Hi-C experiments performed on populations of cells and direct experiments measuring distributions of physical distances between specific loci are much needed to better interpret our data. Nevertheless, our TADs likely represent a spatially organized cluster that impacts replication timing, which could be related to “replication factories,” the clusters of replication forks observed during DNA replication (50). Domain formation in chromatin might generate such a factory by placing several origins in close proximity (51). Thus, domain formation could ensure similar firing times because clustered origins would then share similar concentrations of replication factors. More broadly, colocalization of transcription and replication factors suggests that spatial clustering is a widely used mechanism to enrich local enzyme concentrations to increase the efficiency of multistep biochemical reactions (52–54).
Methods
Strains and Conditions.
For Hi-C of pheromone-arrested cells, we used the strain BY4741 (MATa his3Δ1 leu2Δ0 met15Δ0 ura3Δ0 bar1::KanMX). Strains used for single cell transcription analysis were congenic to W303. CLN1 promoter reporter strains were generated from laboratory stocks by standard methods. Reporters were integrated in the 5′ end of G1/S gene promoters without disrupting nearby ORFs. For all activation timing experiments, cells were grown in synthetic complete media with 2% (wt/vol) glucose (SCD) to logarithmic growth phase, sonicated and plated on 1.5% (wt/vol) agarose SCD pads for imaging. Conditions for the Fkh1/2-depleted Hi-C experiment are described below. See also Table 1 for strains and conditions used.
Table 1.
Strains and conditions
| Strain | Genotype |
| BY4741 | MATa his3Δ1 leu2Δ0 met15Δ0 ura3Δ0 |
| BY4741 bar1∆ | BY4741 bar1::KanMX |
| DCY69 | BY4741 HIS3:GAL1pr:FKH1 fkh2Δ:KanMX |
| DCY80 | BY4741 HIS3:GAL1pr:FKH1-Flag:LEU2 fkh2Δ:KanMX |
| W303a | MATa leu2-3,112 trp1-1 can1-100 ura3-1 ADE2 his3-11,15 |
| DCY85 | W303a pRS316:CLN1pr:yeGFP-PEST |
| DCY86 | W303a pRS316:HTA1pr:yeGFP-PEST |
| DCY61 | W303a CLN1:CLN1pr:yeGFP-PEST |
| DCY38 | W303a CLN2:CLN1pr:yeGFP-PEST |
| DCY40 | W303a NRM1:CLN1pr:yeGFP-PEST |
| DCY39 | W303a PHO8:CLN1pr:yeGFP-PEST |
For Hi-C of pheromone-arrested cells, we used the strain BY4741 (MATa his3Δ1 leu2Δ0 met15Δ0 ura3Δ0 bar1::KanMX). Strains used for single-cell transcription analysis were congenic to W303. CLN1 promoter reporter strains were generated from laboratory stocks by standard methods. Reporters were integrated in the 5′ end of G1/S gene promoters without disrupting nearby ORFs. For all activation timing experiments, cells were grown in synthetic complete media with 2% (wt/vol) glucose (SCD) to logarithmic growth phase, sonicated, and plated on 1.5% (wt/vol) agarose SCD pads for imaging. Conditions for the Fkh1/2-depleted Hi-C experiment are described below.
Hi-C.
To perform Hi-C on a population of G1 cells, BY4741 cells were cultured at 30 °C by shaking overnight in 50 mL of YEP media plus 2% (wt/vol) glucose and diluted the next morning to an OD600 = 0.2 in 1 L of YEP plus 2% (wt/vol) glucose, and 30 nM α-factor. After 120 min, cells were fixed with 1% formaldehyde for 10 min at room temperature and Hi-C was performed as described in Duan et al. (19).
Fkh1/2-depleted Hi-C was performed by growing BY4741 or GAL1pr-FKH1 fkh2∆ cells overnight in YEP with 1% galactose and 1% raffinose before diluting to 0.05 OD600. Cells were then grown for 8 h to an OD600 of 1. Cross-linked nuclei were then prepared as described in Duan et al. (19). In situ DNase Hi-C was performed as described previously (43, 55). For each experiment, ∼2 × 10⁸ isolated yeast nuclei were used.
Hi-C Data Processing and Normalization.
It is important to normalize raw Hi-C data to avoid technical artifacts (56). To generate normalized interaction maps from the newly generated DNase Hi-C data, we processed the samples using a standard Hi-C pipeline. Briefly this pipeline: (i) maps the paired-end reads to the budding yeast reference genome; (ii) filters out the reads that have either a mapping quality score less than 30 or an edit distance greater than 2; (iii) eliminates PCR duplicates among the remaining uniquely mapped read pairs; (iv) uses 10-kb genomic windows to bin the data at this resolution; and (v) applies matrix balancing using a previously published Hi-C data normalization method (57).
Coverage Score.
To analyze genome organization using Hi-C data, we binned the genome into 10-kb regions. For each fragment created by restriction enzyme or DNase digestion, we distributed its reads to bins based on the proportion of the fragment falling into each bin. Next, we calculated the interaction frequency for each bin pair. The coverage score for each 10-kb bin was calculated by finding the total number of interactions between fragments in a 100-kb window centered on the bin of interest. Our analysis identifying domain boundaries is insensitive to the window size because the coverage scores calculated with a wide range of window sizes were highly correlated (Fig. S2 A and B). Restricting our analysis to interactions less than 100 kb prevents fragments at the center of the chromosome from having larger coverage scores as a result of chromosome end effects. In addition, when the window is truncated by a chromosome end, we normalize the coverage score by multiplying the score with the ratio of the full-window size to the truncated window size. We normalized the coverage score for each chromosome by setting its minimum value to 0 and maximum value to 1.
To estimate the variation in coverage for an unstructured genome, we examined an interaction frequency matrix generated by simulating chromosome positions following the model developed in ref. 21. This simulation takes into account the physical properties of the genome as a semiflexible polymer, steric affects, and tethering at the centromere and telomere regions.
Defining TADs.
TAD boundaries are defined as local minima in the coverage score using a python package from Notes on Scientific Computing for Biomechanics and Motor Control (GitHub repository). The coverage profile was smoothed with Scipy function SignalSmooth, using hamming window of size 50 (https://github.com/scipy/scipy-cookbook/blob/master/ipython/SignalSmooth.ipynb). The smoothing parameter was chosen to be 10 for all chromosomes, which suppresses fluctuations less than the estimated SD of the distribution of coverage scores.
Directionality Index Analysis.
Directionality index was calculated similarly to that in Dixon et al. (8) and used to identify TAD boundaries in yeast (Fig. S1B). Briefly, directionality index is defined as the sum of squared differences between half the total number of interactions (E) and the upstream (A) and downstream (B) interactions, normalized on the expected interactions. That is, [(B − A)/|B − A|] × [(A − E)2/E+(B − E)2/E] where E = (A + B)/2. The bin and window sizes for estimating interactions were altered from the metazoan analysis because the yeast genome is much smaller. The bin size for our analysis was 10 kb as for coverage score and the upstream and downstream windows were 50 kb in size. The resultant directionality index was smoothed using the python Scipy function SignalSmooth with a smoothing parameter of 10. Boundaries were identified as locations where this smoothed signal changed sign from negative to positive. To perform sensitivity analysis, the smoothing parameter was varied from 1 to 20 and window size from 10 to 500 kb.
Additional Hi-C Analysis.
For Figs. 1D and 5 E and F, the intrachromosomal interaction frequency as a function of interlocus difference was calculated by dividing the number of interactions between each pair of bins by the total number of interactions on that chromosome. To calculate the difference in interaction frequency between WT and Fkh1/2-depleted cells, the interaction frequency for each bin in WT cells was subtracted from the corresponding bin in Fkh1/2-depleted cells.
Replication Analysis.
We analyzed autonomously replicating sequence (ARS) timing data from Raghuraman et al. (41) for Fig. 4. We analyzed spatial correlations in genome replication timing data from Knott et al. (25) for Fig. 4D. We estimated replication time for each origin by first fitting a smoothing spline to the fraction of replicated DNA. Then, we took the activation time to correspond to when 50% of the DNA was replicated as described in Raghuraman et al. (41).
Polymerase Density and Histone Modifications Analysis.
Histone modification data were obtained from ChIP-chip experiments reported in Pokholok et al. (58). To compare histone modifications across TADs and 10-kb boundary regions (±5 kb from boundary), we first identified the genes within each TAD or boundary region. Next, we averaged the ChIP-chip signal for each gene. We then calculated the difference in signal for all gene pairs within and across neighboring TADs. For comparisons of boundary regions to the rest of the genome, we averaged the signal for all genes in each category. Polymerase II density on the genome was taken from ref. (59). Similarly, we determined the average density for each gene and performed the analysis just as we did for the histone modifications described above. Binding site density was estimated using the FIMO motif finding package using the default parameters (60). Binding site motifs for each transcription factor were taken from the Yeastract database (61). Transcription factor binding site density was estimated using a kernel density estimate with a 0.01 bandwidth. The mean density in bins was calculated from this value.
Western Blotting.
Protein abundance was measured by Western blotting. Cells were frozen in liquid nitrogen and then lysed in 150 µL urea lysis buffer (20 mM Tris⋅Cl pH 7.5, 7 M urea, 2 M thiourea, 65 mM CHAPS, 65 mM DTT, 50 mM NaF, 100 mM β-glycerophosphate, 1 mM NaVO3, 1 mM PMSF), and homogenized for 40 s at 4 °C in a FastPrep homogenizer (MP Biomedicals) using 300 µL 0.5-mm ceramic beads. Lysates were transferred from the homogenizing tube to a clean tube by puncturing the tube and briefly centrifuging. Lysates were cleared by centrifugation for 10 min at 17,000 × g. Total protein was normalized based on measurement by Bradford protein assay (Bio-Rad) to a maximum of 10 µL to which 5 µL 6× Laemmli buffer was added. This protein loaded on a 10% (wt/vol) polyacrylamide gel and run for 60 min at 15 Amps. Protein was transferred to nitrocellulose membrane using the iBlot system on program 8 for 7 min. Membranes were blocked in Licor Odyssey blocking buffer (TBS; 927–50010) for 60 min at room temperature. Membranes were incubated with 1:1,000 M2 mouse monoclonal anti-FLAG (Sigma F1804) and 1:500 goat polyclonal anti-CDC28 overnight diluted in 5% (wt/vol) nonfat dehydrated milk TBS + 0.1% Tween-20 at 4 °C. Membranes were washed 1× 15 min and 2× 5 min in TBS-T and then incubated with Li-Cor IRDye 800 donkey anti-goat (product # 926–32214) and Li-Cor IRDye 680LT donkey anti-mouse (product # 926–32214) antibodies. Membranes were scanned using a Licor Odyssey CLX-0670.
Microscopy and Analysis.
Images were taken using a Zeiss Axio Observer.Z1 microscope with an automated stage using a plan-apo 63×/1.4 NA oil-immersion objective. Automatic focusing was performed using the Definite Focus system. Whi5–mCherry was visualized by exposing for 600 ms with excitation from the Colibri 540- to 580-nm LED system at 50% intensity. Transcriptional reporter eGFP-PEST was detected by exposing for 300 ms using excitation from a Colibri 505 nm LED at 25% intensity. Images were taken for at most 20 positions every 3 min. Image analysis was performed as previously described (62). Gene activation time was calculated as in Skotheim et al. (63) relative to the time Whi5 concentration in the nucleus is half-maximum, which corresponds to the point of commitment to cell division (37).
Supplementary Material
Acknowledgments
This work was supported by NIH Grants R01 GM092925 and T32 GM007276, and the Burroughs Wellcome Fund (a Career Awards at the Scientific Interface grant to J.M.S.).
Footnotes
The authors declare no conflict of interest.
This article is a PNAS Direct Submission.
Data deposition: The Hi-C sequences have been deposited in the Sequence Read Archive, https://www.ncbi.nlm.nih.gov/sra (accession no. SRP101770).
This article contains supporting information online at www.pnas.org/lookup/suppl/doi:10.1073/pnas.1612256114/-/DCSupplemental.
References
- 1.Taddei A, Gasser SM. Structure and function in the budding yeast nucleus. Genetics. 2012;192(1):107–129. doi: 10.1534/genetics.112.140608. [DOI] [PMC free article] [PubMed] [Google Scholar]
- 2.Van Bortle K, Corces VG. Nuclear organization and genome function. Annu Rev Cell Dev Biol. 2012;28:163–187. doi: 10.1146/annurev-cellbio-101011-155824. [DOI] [PMC free article] [PubMed] [Google Scholar]
- 3.Gibcus JH, Dekker J. The hierarchy of the 3D genome. Mol Cell. 2013;49(5):773–782. doi: 10.1016/j.molcel.2013.02.011. [DOI] [PMC free article] [PubMed] [Google Scholar]
- 4.Rao SSP, et al. A 3D map of the human genome at kilobase resolution reveals principles of chromatin looping. Cell. 2014;159(7):1665–1680. doi: 10.1016/j.cell.2014.11.021. [DOI] [PMC free article] [PubMed] [Google Scholar]
- 5.Sexton T, et al. Three-dimensional folding and functional organization principles of the Drosophila genome. Cell. 2012;148(3):458–472. doi: 10.1016/j.cell.2012.01.010. [DOI] [PubMed] [Google Scholar]
- 6.Crane E, et al. Condensin-driven remodelling of X chromosome topology during dosage compensation. Nature. 2015;523(7559):240–244. doi: 10.1038/nature14450. [DOI] [PMC free article] [PubMed] [Google Scholar]
- 7.Mizuguchi T, et al. Cohesin-dependent globules and heterochromatin shape 3D genome architecture in S. pombe. Nature. 2014;516(7531):432–435. doi: 10.1038/nature13833. [DOI] [PMC free article] [PubMed] [Google Scholar]
- 8.Dixon JR, et al. Topological domains in mammalian genomes identified by analysis of chromatin interactions. Nature. 2012;485(7398):376–380. doi: 10.1038/nature11082. [DOI] [PMC free article] [PubMed] [Google Scholar]
- 9.Nora EP, et al. Spatial partitioning of the regulatory landscape of the X-inactivation centre. Nature. 2012;485(7398):381–385. doi: 10.1038/nature11049. [DOI] [PMC free article] [PubMed] [Google Scholar]
- 10.Hou C, Li L, Qin ZS, Corces VG. Gene density, transcription, and insulators contribute to the partition of the Drosophila genome into physical domains. Mol Cell. 2012;48(3):471–484. doi: 10.1016/j.molcel.2012.08.031. [DOI] [PMC free article] [PubMed] [Google Scholar]
- 11.Moindrot B, et al. 3D chromatin conformation correlates with replication timing and is conserved in resting cells. Nucleic Acids Res. 2012;40(19):9470–9481. doi: 10.1093/nar/gks736. [DOI] [PMC free article] [PubMed] [Google Scholar]
- 12.Ryba T, et al. Evolutionarily conserved replication timing profiles predict long-range chromatin interactions and distinguish closely related cell types. Genome Res. 2010;20(6):761–770. doi: 10.1101/gr.099655.109. [DOI] [PMC free article] [PubMed] [Google Scholar]
- 13.Narendra V, et al. CTCF establishes discrete functional chromatin domains at the Hox clusters during differentiation. Science. 2015;347(6225):1017–1021. doi: 10.1126/science.1262088. [DOI] [PMC free article] [PubMed] [Google Scholar]
- 14.Zuin J, et al. Cohesin and CTCF differentially affect chromatin architecture and gene expression in human cells. Proc Natl Acad Sci USA. 2014;111(3):996–1001. doi: 10.1073/pnas.1317788111. [DOI] [PMC free article] [PubMed] [Google Scholar]
- 15.Sofueva S, et al. Cohesin-mediated interactions organize chromosomal domain architecture. EMBO J. 2013;32(24):3119–3129. doi: 10.1038/emboj.2013.237. [DOI] [PMC free article] [PubMed] [Google Scholar]
- 16.Sexton T, Cavalli G. The role of chromosome domains in shaping the functional genome. Cell. 2015;160(6):1049–1059. doi: 10.1016/j.cell.2015.02.040. [DOI] [PubMed] [Google Scholar]
- 17.Lieberman-Aiden E, et al. Comprehensive mapping of long-range interactions reveals folding principles of the human genome. Science. 2009;326(5950):289–293. doi: 10.1126/science.1181369. [DOI] [PMC free article] [PubMed] [Google Scholar]
- 18.Mirny LA. The fractal globule as a model of chromatin architecture in the cell. Chromosome Res. 2011;19(1):37–51. doi: 10.1007/s10577-010-9177-0. [DOI] [PMC free article] [PubMed] [Google Scholar]
- 19.Duan Z, et al. A three-dimensional model of the yeast genome. Nature. 2010;465(7296):363–367. doi: 10.1038/nature08973. [DOI] [PMC free article] [PubMed] [Google Scholar]
- 20.Guidi M, et al. Spatial reorganization of telomeres in long-lived quiescent cells. Genome Biol. 2015;16(1):206. doi: 10.1186/s13059-015-0766-2. [DOI] [PMC free article] [PubMed] [Google Scholar]
- 21.Tjong H, Gong K, Chen L, Alber F. Physical tethering and volume exclusion determine higher-order genome organization in budding yeast. Genome Res. 2012;22(7):1295–1305. doi: 10.1101/gr.129437.111. [DOI] [PMC free article] [PubMed] [Google Scholar]
- 22.Aparicio OM. Location, location, location: It’s all in the timing for replication origins. Genes Dev. 2013;27(2):117–128. doi: 10.1101/gad.209999.112. [DOI] [PMC free article] [PubMed] [Google Scholar]
- 23.Ferguson BM, Fangman WL. A position effect on the time of replication origin activation in yeast. Cell. 1992;68(2):333–339. doi: 10.1016/0092-8674(92)90474-q. [DOI] [PubMed] [Google Scholar]
- 24.Friedman KL, et al. Multiple determinants controlling activation of yeast replication origins late in S phase. Genes Dev. 1996;10(13):1595–1607. doi: 10.1101/gad.10.13.1595. [DOI] [PubMed] [Google Scholar]
- 25.Knott SRV, et al. Forkhead transcription factors establish origin timing and long-range clustering in S. cerevisiae. Cell. 2012;148(1-2):99–111. doi: 10.1016/j.cell.2011.12.012. [DOI] [PMC free article] [PubMed] [Google Scholar]
- 26.Hsieh T-HS, et al. Mapping nucleosome resolution chromosome folding in yeast by micro-C. Cell. 2015;162(1):108–119. doi: 10.1016/j.cell.2015.05.048. [DOI] [PMC free article] [PubMed] [Google Scholar]
- 27.Roberts CJ, et al. Signaling and circuitry of multiple MAPK pathways revealed by a matrix of global gene expression profiles. Science. 2000;287(5454):873–880. doi: 10.1126/science.287.5454.873. [DOI] [PubMed] [Google Scholar]
- 28.Dileep V, et al. Topologically associating domains and their long-range contacts are established during early G1 coincident with the establishment of the replication-timing program. Genome Res. 2015;25(8):1104–1113. doi: 10.1101/gr.183699.114. [DOI] [PMC free article] [PubMed] [Google Scholar]
- 29.de Wit E, et al. The pluripotent genome in three dimensions is shaped around pluripotency factors. Nature. 2013;501(7466):227–231. doi: 10.1038/nature12420. [DOI] [PubMed] [Google Scholar]
- 30.Jin F, et al. A high-resolution map of the three-dimensional chromatin interactome in human cells. Nature. 2013;503(7475):290–294. doi: 10.1038/nature12644. [DOI] [PMC free article] [PubMed] [Google Scholar]
- 31.MacIsaac KD, et al. An improved map of conserved regulatory sites for Saccharomyces cerevisiae. BMC Bioinformatics. 2006;7(1):113. doi: 10.1186/1471-2105-7-113. [DOI] [PMC free article] [PubMed] [Google Scholar]
- 32.Glynn EF, et al. Genome-wide mapping of the cohesin complex in the yeast Saccharomyces cerevisiae. PLoS Biol. 2004;2(9):E259. doi: 10.1371/journal.pbio.0020259. [DOI] [PMC free article] [PubMed] [Google Scholar]
- 33.Sperling AS, Jeong KS, Kitada T, Grunstein M. Topoisomerase II binds nucleosome-free DNA and acts redundantly with topoisomerase I to enhance recruitment of RNA Pol II in budding yeast. Proc Natl Acad Sci USA. 2011;108(31):12693–12698. doi: 10.1073/pnas.1106834108. [DOI] [PMC free article] [PubMed] [Google Scholar]
- 34.Berger AB, et al. High-resolution statistical mapping reveals gene territories in live yeast. Nat Methods. 2008;5(12):1031–1037. doi: 10.1038/nmeth.1266. [DOI] [PubMed] [Google Scholar]
- 35.Eser U, Falleur-Fettig M, Johnson A, Skotheim JM. Commitment to a cellular transition precedes genome-wide transcriptional change. Mol Cell. 2011;43(4):515–527. doi: 10.1016/j.molcel.2011.06.024. [DOI] [PMC free article] [PubMed] [Google Scholar]
- 36.Ferrezuelo F, Colomina N, Futcher B, Aldea M. The transcriptional network activated by Cln3 cyclin at the G1-to-S transition of the yeast cell cycle. Genome Biol. 2010;11(6):R67. doi: 10.1186/gb-2010-11-6-r67. [DOI] [PMC free article] [PubMed] [Google Scholar]
- 37.Doncic A, Falleur-Fettig M, Skotheim JM. Distinct interactions select and maintain a specific cell fate. Mol Cell. 2011;43(4):528–539. doi: 10.1016/j.molcel.2011.06.025. [DOI] [PMC free article] [PubMed] [Google Scholar]
- 38.Yaffe E, et al. Comparative analysis of DNA replication timing reveals conserved large-scale chromosomal architecture. PLoS Genet. 2010;6(7):e1001011. doi: 10.1371/journal.pgen.1001011. [DOI] [PMC free article] [PubMed] [Google Scholar]
- 39.Masai H, Matsumoto S, You Z, Yoshizawa-Sugata N, Oda M. Eukaryotic chromosome DNA replication: Where, when, and how? Annu Rev Biochem. 2010;79:89–130. doi: 10.1146/annurev.biochem.052308.103205. [DOI] [PubMed] [Google Scholar]
- 40.Rhind N, Gilbert DM. DNA replication timing. Cold Spring Harb Perspect Biol. 2013;5(8):a010132. doi: 10.1101/cshperspect.a010132. [DOI] [PMC free article] [PubMed] [Google Scholar]
- 41.Raghuraman MK, et al. Replication dynamics of the yeast genome. Science. 2001;294(5540):115–121. doi: 10.1126/science.294.5540.115. [DOI] [PubMed] [Google Scholar]
- 42.Zhu G, et al. Two yeast forkhead genes regulate the cell cycle and pseudohyphal growth. Nature. 2000;406(6791):90–94. doi: 10.1038/35017581. [DOI] [PubMed] [Google Scholar]
- 43.Ma W, et al. Fine-scale chromatin interaction maps reveal the cis-regulatory landscape of human lincRNA genes. Nat Methods. 2015;12(1):71–78. doi: 10.1038/nmeth.3205. [DOI] [PMC free article] [PubMed] [Google Scholar]
- 44.Lõoke M, Kristjuhan K, Värv S, Kristjuhan A. Chromatin-dependent and -independent regulation of DNA replication origin activation in budding yeast. EMBO Rep. 2013;14(2):191–198. doi: 10.1038/embor.2012.196. [DOI] [PMC free article] [PubMed] [Google Scholar]
- 45.Pohl TJ, Brewer BJ, Raghuraman MK. Functional centromeres determine the activation time of pericentric origins of DNA replication in Saccharomyces cerevisiae. PLoS Genet. 2012;8(5):e1002677. doi: 10.1371/journal.pgen.1002677. [DOI] [PMC free article] [PubMed] [Google Scholar]
- 46.Fragkos M, Ganier O, Coulombe P, Méchali M. DNA replication origin activation in space and time. Nat Rev Mol Cell Biol. 2015;16(6):360–374. doi: 10.1038/nrm4002. [DOI] [PubMed] [Google Scholar]
- 47.Pope BD, et al. Topologically associating domains are stable units of replication-timing regulation. Nature. 2014;515(7527):402–405. doi: 10.1038/nature13986. [DOI] [PMC free article] [PubMed] [Google Scholar]
- 48.Bickmore WA, van Steensel B. Genome architecture: Domain organization of interphase chromosomes. Cell. 2013;152(6):1270–1284. doi: 10.1016/j.cell.2013.02.001. [DOI] [PubMed] [Google Scholar]
- 49.Smallwood A, Ren B. Genome organization and long-range regulation of gene expression by enhancers. Curr Opin Cell Biol. 2013;25(3):387–394. doi: 10.1016/j.ceb.2013.02.005. [DOI] [PMC free article] [PubMed] [Google Scholar]
- 50.Kitamura E, Blow JJ, Tanaka TU. Live-cell imaging reveals replication of individual replicons in eukaryotic replication factories. Cell. 2006;125(7):1297–1308. doi: 10.1016/j.cell.2006.04.041. [DOI] [PMC free article] [PubMed] [Google Scholar]
- 51.Méchali M, Yoshida K, Coulombe P, Pasero P. Genetic and epigenetic determinants of DNA replication origins, position and activation. Curr Opin Genet Dev. 2013;23(2):124–131. doi: 10.1016/j.gde.2013.02.010. [DOI] [PubMed] [Google Scholar]
- 52.Ben-Elazar S, Yakhini Z, Yanai I. Spatial localization of co-regulated genes exceeds genomic gene clustering in the Saccharomyces cerevisiae genome. Nucleic Acids Res. 2013;41(4):2191–2201. doi: 10.1093/nar/gks1360. [DOI] [PMC free article] [PubMed] [Google Scholar]
- 53.Homouz D, Kudlicki AS. The 3D organization of the yeast genome correlates with co-expression and reflects functional relations between genes. PLoS One. 2013;8(1):e54699. doi: 10.1371/journal.pone.0054699. [DOI] [PMC free article] [PubMed] [Google Scholar]
- 54.Papantonis A, Cook PR. Transcription factories: Genome organization and gene regulation. Chem Rev. 2013;113(11):8683–8705. doi: 10.1021/cr300513p. [DOI] [PubMed] [Google Scholar]
- 55.Deng X, et al. Bipartite structure of the inactive mouse X chromosome. Genome Biol. 2015;16(1):152. doi: 10.1186/s13059-015-0728-8. [DOI] [PMC free article] [PubMed] [Google Scholar]
- 56.Ay F, Noble WS. Analysis methods for studying the 3D architecture of the genome. Genome Biol. 2015;16(1):183. doi: 10.1186/s13059-015-0745-7. [DOI] [PMC free article] [PubMed] [Google Scholar]
- 57.Imakaev M, et al. Iterative correction of Hi-C data reveals hallmarks of chromosome organization. Nat Methods. 2012;9(10):999–1003. doi: 10.1038/nmeth.2148. [DOI] [PMC free article] [PubMed] [Google Scholar]
- 58.Pokholok DK, et al. Genome-wide map of nucleosome acetylation and methylation in yeast. Cell. 2005;122(4):517–527. doi: 10.1016/j.cell.2005.06.026. [DOI] [PubMed] [Google Scholar]
- 59.Churchman LS, Weissman JS. Nascent transcript sequencing visualizes transcription at nucleotide resolution. Nature. 2011;469(7330):368–373. doi: 10.1038/nature09652. [DOI] [PMC free article] [PubMed] [Google Scholar]
- 60.Grant CE, Bailey TL, Noble WS. FIMO: Scanning for occurrences of a given motif. Bioinformatics. 2011;27(7):1017–1018. doi: 10.1093/bioinformatics/btr064. [DOI] [PMC free article] [PubMed] [Google Scholar]
- 61.Teixeira MC, et al. The YEASTRACT database: An upgraded information system for the analysis of gene and genomic transcription regulation in Saccharomyces cerevisiae. Nucleic Acids Res. 2014;42(Database issue):D161–D166. doi: 10.1093/nar/gkt1015. [DOI] [PMC free article] [PubMed] [Google Scholar]
- 62.Doncic A, Eser U, Atay O, Skotheim JM. An algorithm to automate yeast segmentation and tracking. PLoS One. 2013;8(3):e57970. doi: 10.1371/journal.pone.0057970. [DOI] [PMC free article] [PubMed] [Google Scholar]
- 63.Skotheim JM, Di Talia S, Siggia ED, Cross FR. Positive feedback of G1 cyclins ensures coherent cell cycle entry. Nature. 2008;454(7202):291–296. doi: 10.1038/nature07118. [DOI] [PMC free article] [PubMed] [Google Scholar]
Associated Data
This section collects any data citations, data availability statements, or supplementary materials included in this article.


