Significance
Hydrogenases are among the most active of enzymes, with active sites that compare with platinum metals in regard to rates of hydrogen production and oxidation. Attached to an electrode, [FeFe]-hydrogenases behave as reversible electrocatalysts close to the equilibrium potential, with only a minimal overpotential being required to oxidize H2 or reduce protons. Electrochemical impedance spectroscopy, which uses a small amplitude potential modulation over a wide frequency range, has been used to measure the “electrocatalytic exchange rate”—the “idle speed” at which the cycle runs back and forth at the formal potential. The results also quantify the efficacy of Fe–S clusters, at the active site or in the relay, in controlling the rates of catalytic electron flow.
Keywords: hydrogen, electrocatalysis, impedance spectroscopy, hydrogenase, electron transfer
Abstract
The kinetics of hydrogen oxidation and evolution by [FeFe]-hydrogenases have been investigated by electrochemical impedance spectroscopy—resolving factors that determine the exceptional activity of these enzymes, and introducing an unusual and powerful way of analyzing their catalytic electron transport properties. Attached to an electrode, hydrogenases display reversible electrocatalytic behavior close to the 2H+/H2 potential, making them paradigms for efficiency: the electrocatalytic “exchange” rate (measured around zero driving force) is therefore an unusual parameter with theoretical and practical significance. Experiments were carried out on two [FeFe]-hydrogenases, CrHydA1 from the green alga Chlamydomonas reinhardtii, which contains only the active-site “H cluster,” and CpI from the fermentative anaerobe Clostridium pasteurianum, which contains four low-potential FeS clusters that serve as an electron relay in addition to the H cluster. Data analysis yields catalytic exchange rates (at the formal 2H+/H2 potential, at 0 °C) of 157 electrons (78 molecules H2) per second for CpI and 25 electrons (12 molecules H2) per second for CrHydA1. The experiments show how the potential dependence of catalytic electron flow comprises frequency-dependent and frequency-independent terms that reflect the proficiencies of the catalytic site and the electron transfer pathway in each enzyme. The results highlight the “wire-like” behavior of the Fe–S electron relay in CpI and a low reorganization energy for electron transfer on/off the H cluster.
Despite their giant size, many redox enzymes are now established as reversible electrocatalysts through investigations by protein film electrochemistry (PFE) (1). Attached to an electrode, these enzymes catalyze rapid oxidation and reduction, with only a minimum overpotential being required to swap the current direction either side of the equilibrium potential (2–5). Of particular interest are hydrogenases, which catalyze the oxidation and production of H2 with activities that may rival platinum (6–11) and are inspirational in the quest for future electrocatalysts as well as in artificial photosynthesis (12, 13).
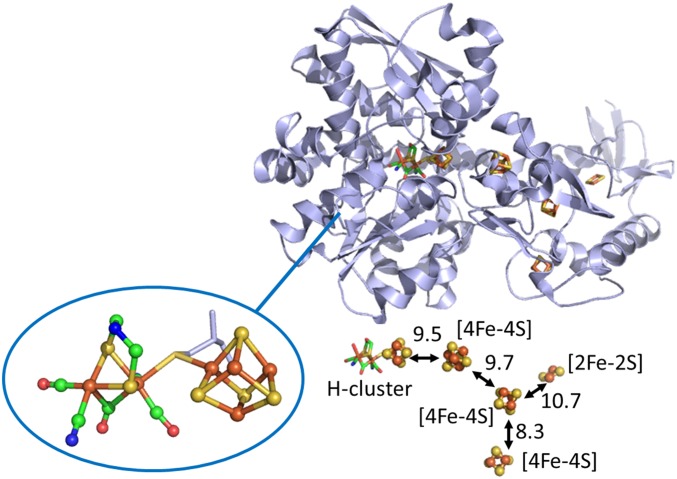
The enzymes known as [FeFe]-hydrogenases contain a unique bimetallic active site known as the H cluster (Fig. 1), which contains six Fe atoms in two domains: a 2Fe domain that is the site for H2 activation and a [4Fe–4S] cluster domain that presumably acts as the immediate electron donor/acceptor and internal electron buffer within the H cluster (14–16). Key representatives are hydrogenase 1 from a fermentative anaerobe Clostridium pasteuranium (CpI) and hydrogenase A1 from a photosynthetic alga Chlamydomonas reinhardtii (CrHydA1). Fig. 1 shows that CpI contains an electron transfer relay consisting of three [4Fe–4S] clusters and one [2Fe–2S] cluster (17). The assumed natural redox partner of CpI is a 2[4Fe–4S] ferredoxin (18). The internal relay allows long-range electron transport (ET) between the H cluster and the protein surface, and it may be significant that it branches into two pathways that could provide improved coupling to an electrode surface. In contrast, CrHydA1 contains only the H cluster: in the living cell, it receives electrons from photosystem I via a small [2Fe–2S] ferredoxin known as PetF (19). No accessory internal Fe–S clusters are present to mediate or store electrons.
Fig. 1.
Structure of the [FeFe]-hydrogenase I (CpI) from Clostridium pasteurianum, Protein Data Bank (PDB) ID code 3C8Y. A close-up view of the active site H cluster is also shown (Lower Left) along with the [FeS]-cluster relay and intersite distances (Lower Right) measured in angstrom units.
For enzymes, PFE has focused entirely on net catalytic electron flow that is observed as direct current (DC) in voltammograms (2, 3, 10). Use of DC cyclic voltammetry as opposed to single potential sweeps alone helps to distinguish rapid, steady-state catalytic activity at different potentials from relatively slow, potential-dependent changes in activity that are revealed as hysteresis (10). However, only net electron flow is observed and little information is obtained on certain inherent factors that underline the reversible nature of the catalysis. For example, it would be significant to know how rapidly the catalytic cycle can turn back and forth at the equilibrium potential: this unusual quantity is related to the familiar exchange current for an electrode reaction that is obtained by extrapolating the exponential current–overpotential relationship (a Tafel plot) and is the catalytic resemblant of the Marcus electron self-exchange rate (at zero driving force) (20). In reality, the electrocatalytic exchange constant encompasses a combination of long-range electron transfer efficiency and inherent catalytic proficiency of the active site, and cannot be extracted directly by voltammetric methods. Additionally, to understand the “design principles” of an electron transport enzyme, it is highly relevant to measure and resolve the responses to a bias, analogous to electronic circuitry: we might thus distinguish between limitations due to time-dependent chemical steps occurring at the active site from those due to the properties of relay sites that mediate long-range ET in what is often casually referred to as “wire-like” conductivity. Such information can be obtained by electrochemical impedance spectroscopy (EIS), which uses a small-amplitude sinusoidal AC voltage to measure the impedance components at given values of the electrode potential (20–23). Impedance is generalized resistance and the opposite of conductance—the electronic term expressing the ease of electron flow. We have now used EIS to study CrHydA1 and CpI: our goals have been to determine, quantitatively, the catalytic proficiency of the H cluster in terms of electrocatalytic exchange rate, and to examine the influence of the electron relay in mediating long-range electron transfer.
Results and Discussion
Cyclic Voltammetry.
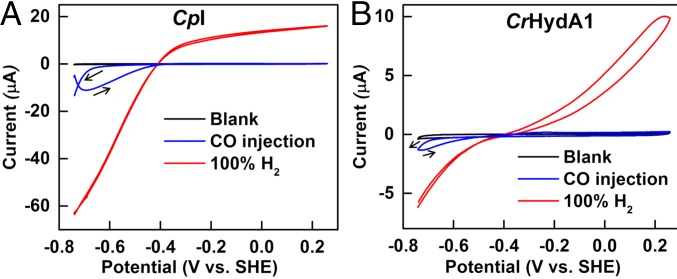
All experiments were carried out at 0 °C, with 0.10 M sodium phosphate buffer at pH 7.0, under strictly anaerobic conditions, using a rotating disk pyrolytic graphite edge (PGE) electrode at which CpI and CrHydA1 adsorb tightly on the rough surface in a highly electroactive state (2). Under 100% H2, catalytic activity is close to optimal for each enzyme and electrode rotation at 1,000 rpm ensured that H2 mass transport is not limiting (24). The catalytic electrochemistry of CpI and CrHydA1 is highly reproducible (Fig. 2) (24). In either case, the steady-state catalytic current (red traces) changes direction sharply either side of the equilibrium 2H+/H2 potential, justifying the description of [FeFe]-hydrogenases as reversible electrocatalysts with Pt-like activity. There are notable differences: CpI appears particularly efficient at catalyzing H2 evolution, whereas the H2 oxidation current levels off within 0.2 V of the reversible value. Although not cutting the x axis as sharply as CpI, CrHydA1 catalyzes both H2 production and H2 oxidation reactions at similar rates for a given overpotential. At more positive potentials, both hydrogenases undergo conversion to an inactive oxidized form, the conversion being more rapid for CrHydA1 and evident from the hysteresis observed during H2 oxidation; hence, we restricted EIS measurements to an upper potential limit of 0 V vs. SHE. Both hydrogenases are inhibited by carbon monoxide, which binds tightly at a potential more positive than −0.5 V but is released at a potential below −0.6 V(24, 25). This inhibition provides a benign and reversible “on/off switch” by which to identify the impedance components that are unique to electrocatalysis.
Fig. 2.
Cyclic voltammetry profiles of [FeFe]-hydrogenases, CpI (A) and CrHydA1 (B), on PGE electrodes and equilibrated with 100% H2 flowing in the headspace (red trace): the trace shows that, depending upon the potential applied, both H2 oxidation and H+ reduction are carried out by the enzyme. When CO is injected, the enzymes are unable to carry out H2 oxidation, and H+ reduction begins at a more negative potential (below −0.6 V vs. SHE) where CO is released (blue trace). Conditions: pH 7.0 (0.10 M phosphate buffer); temperature, 0 °C; scan rate, 20 mV⋅s−1.
Electrochemical Impedance Spectroscopy.
Nyquist spectra at equilibrium potential.
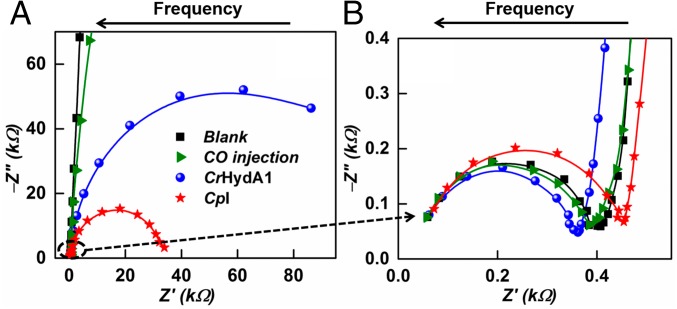
Detailed insight into the processes taking place at the enzyme-modified electrodes was provided by EIS, where the system responds to the application of a small perturbation [10 mV root-mean-square (rms)] modulation over a range of frequencies at different potentials under steady-state conditions. The modulation amplitude was chosen as the best compromise to obtain conditions closest to the equilibrium potential without adverse noise. Fig. 3A shows EIS spectra for CpI and CrHydA1 adsorbed at a PGE electrode under 1-bar H2, recorded at the equilibrium cell potential [the potential of zero net current, which we also define as the formal potential of the reversible hydrogen electrode (RHE)] in the frequency range of 0.1 Hz to 100 kHz. At high frequency (see expanded plot in Fig. 3B), the results obtained for CpI and CrHydA1 are similar and resemble the results obtained for a blank PGE electrode and that observed when CO is introduced to inhibit electrocatalysis (shown for CpI). The Nyquist spectra for both CpI and CrHydA1 with CO inhibition almost overlay each other, and hence only data for CpI are shown. The EIS spectra show similar high-frequency arcs (Fig. 3B) that deviate in behavior at lower frequencies to give almost straight lines in the case of blank and CO-inhibited enzymes, and semicircular arcs of different radii for the two enzymes catalyzing 2H+/H2 interconversion.
Fig. 3.
(A) Impedance spectra of the [FeFe]-hydrogenase systems at the equilibrium potential. (B) Enlargement focusing on the high-frequency details. Conditions: pH 7.0 (0.10 M phosphate buffer); temperature, 0 °C. The symbols are experimental data points, and the lines represent the fits obtained.
Modeling catalytic electron transport by equivalent circuit analysis.
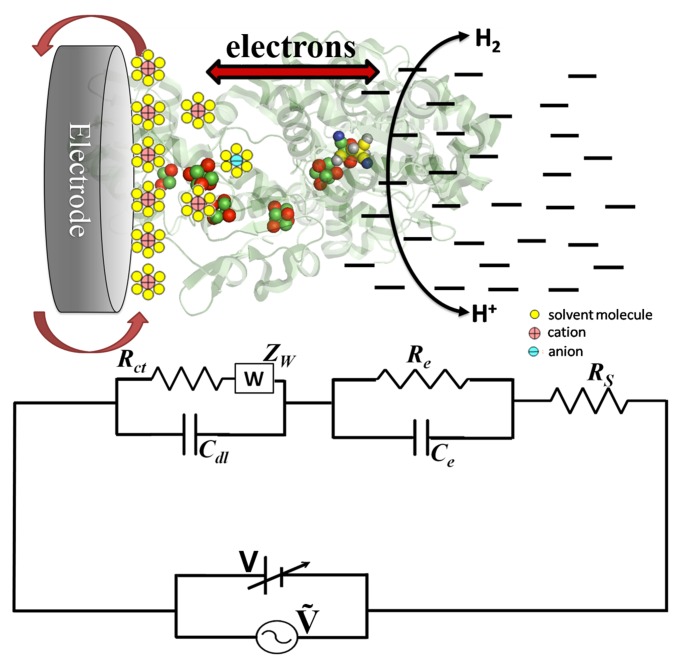
The results and discussion are based upon the scheme shown in Fig. 4, which represents the entire catalytic charge transport process at the electrode–enzyme solution region in terms of an equivalent circuit diagram. The circuit consists of three components in series; the cell resistance, the impedance due to the electrical double layer, and the impedance that describes catalytic electron flow through the enzyme, each of which is revealed in turn as the frequency is lowered. By considering all of the circuit elements, the net impedance at any point on the spectra is given as follows: Z = Z′ + jZ″, where Z′ and Z″ are the real and imaginary components of EIS (26, 27). Algebraic manipulation of Z′ + jZ″ leads to values for resistance R and capacitance C at each given frequency. Further details are given in ESI.
Fig. 4.
Equivalent circuit used to fit the Nyquist spectra obtained for hydrogenases attached to an electrode, with a schematic showing the dominance of circuit elements in the different regions of charge transfer.
The cell resistance.
The cell resistance Rs was revealed from the extrapolated intercept of the high-frequency semicircle with the Z′ axis and was the same for all experiments, which were conducted under the same conditions with the same electrochemical cell. The value is 57.5 Ω.
The electrical double layer.
The high-frequency arc and midfrequency portions of the EIS spectra are modeled by the cell elements Rct, Cdl, and W. The Rct and Cdl elements describe the ion transport inside the double layer formed at the electrode, whereas W corresponds to the semiinfinite diffusion of the charged particles and has the form ZW = α /(jω)1/2 (22, 27). The arc intercepts the Z′ axis at Rct + Rs, and it is likely that the slightly differing values of Rct reflect differences in the surface characteristics of the two enzymes. The fact that Rct values vary so little provides confidence to interpret the remaining data, which relate to the specific electrocatalytic activities of each enzyme.
Catalytic electron transport through the enzyme.
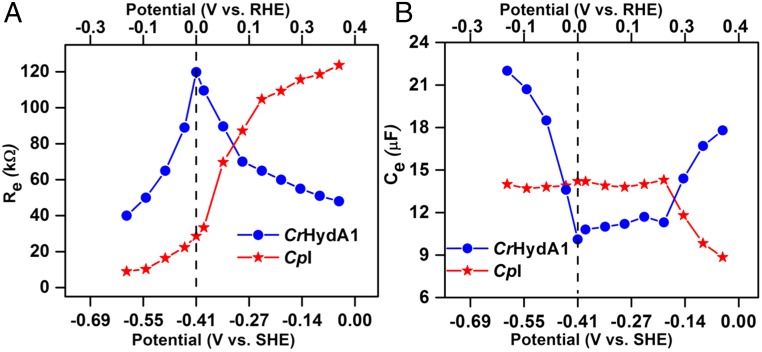
The low-frequency arc that appears when catalytic activity is not inhibited by CO shows that each enzyme molecule attached to the electrode behaves as a resistor and capacitor connected in parallel (20). To understand how this relates to electron flow back and forth through an enzyme attached to the electrode, we consider what is happening at the limits of the arc. At the high-frequency limit, the impedance response is simply Rct and is similar for both enzymes with and without CO: even with uninhibited enzyme, the frequency is sufficiently high that the enzyme is unable to contribute through catalytic turnover. The response in the low-frequency region represents the resistance Re to electron flow. The responses at intermediate frequencies across the arc reflect the increasing and decreasing contributions from the frequency-dependent catalytic activity as electrons are now able to flow back and forth between the electrode and H2 or H+aq in solution. The frequency-independent resistance Re quantifies the difficulty of moving electrons from the electrode to the active site and reflects such factors as distance, medium, and the influence of an FeS relay (28, 29). The frequency-dependent resistance arises from the capacitance Ce (as 1/ωC): it reflects engagement of the cyclic contribution from reversible chemical steps ranging from binding/release of H2 to atom/ion transfer, as well as electron transfers that are tightly coupled to these steps (30, 31). Expressed another way, Re represents the DC resistance always offered by the combined electron relay and active site, whereas Ce is analogous to a time-dependent charging and discharging of the active site (this is a Faradaic process because catalytic cycling allows electrons to flow). The variation of Re and Ce with potential allows more in-depth interpretation of the electrocatalytic activity than is possible from voltammograms.
Quantitative values from EIS spectra at the equilibrium potential (E = 0 V vs. RHE) were extracted by fitting the experimental data (23) and are summarized in Table 1. Agreement between the theoretical fits and the experimental Nyquist spectra is within 1.3%, and RS has been independently fitted for each set of data. Most notably, the much lower Re value for CpI compared with that for CrHydA1 shows that electron flow through CpI is particularly facile. This result is as expected because CpI has an extensive relay system of low-potential FeS clusters to connect the H cluster with the distal [4Fe–4S] and [2Fe–2S] clusters that each lie within 8 Å of the accessible protein surface, whereas the H cluster of CrHydA1 has no internal relay. In biology, the buried H cluster in CrHydA1 must exchange electrons directly with a small protein—a ferredoxin known as PetF—in encounters that are necessarily transient but likely to be more efficient in regard to electronic coupling than achieved with an electrode. A calculated protein–protein structure suggests a distance of 11 Å between the H cluster of CrHydA1 and the [2Fe–2S] cluster of PetF (32). Negligible differences between the blank and CO-inhibited enzymes, in the values of all of the elements, reflect the fact that the inhibitor CO acts as an excellent “off” switch in both cases (24): notably, noncatalytic electron transfers to and within the enzyme barely register in the EIS experiments.
Table 1.
Parameters obtained by fitting the experimental Nyquist spectra for the enzymes on PGE electrode (at equilibrium potentials) to yield equivalent circuits by MATLAB software
| Condition | RS, Ω | Rct, Ω | Cdl, μF | Re, kΩ | Ce, μF |
| Blank | 57.5 | 350.2 | 0.031 | — | — |
| CO inhibition | 57.5 | 350.1 | 0.031 | — | — |
| CpI (H2) | 57.5 | 410.7 | 0.022 | 28.6 | 14.8 |
| CrHydA1 (H2) | 57.5 | 338.3 | 0.038 | 119.8 | 10.8 |
Determination of exchange current density.
The exchange current density i0 at the equilibrium cell potential was determined from the expression, i0 = RT/nFRe, where R, T, n, and F are the universal gas constant, temperature in Kelvin, overall number (=2) of electrons taking part in the reaction, and Faraday’s constant, respectively (33). In a typical experiment as just described, an exchange current density of 27.7 μA⋅cm−2 was obtained for CpI, whereas that of CrHydA1 was nearly fivefold lower at 6.07 μA⋅cm−2. To draw molecular-level conclusions from these data requires knowing the electroactive coverage Γ for each case (current density = nkexFΓ) as this allows the exchange turnover frequency kex to be determined. However, neither CpI nor CrHydA1 are present at high enough coverage to exhibit nonturnover signals that are due to simple, noncatalytic oxidation and reduction of internal electron transfer components. However, an independent value of kex could be determined from a Bode plot, an alternate means of presenting the data in which phase angle is plotted against frequency.
Determination of catalytic exchange frequency: Analysis of Bode plots at the equilibrium potential.
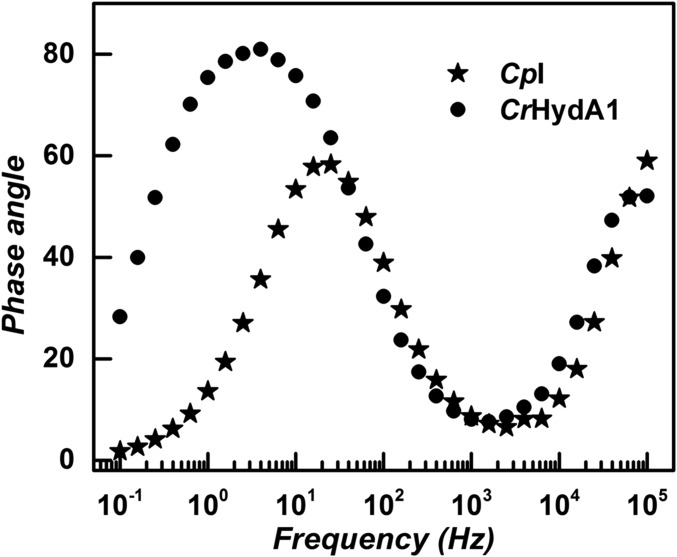
Fig. 5 shows Bode plots for CpI and CrHydA1 at the equilibrium potential. The time constant at the peak maxima is related to the electrocatalytic exchange rate constant kex. For CpI, the peak in the phase angle corresponds to a higher frequency (f) than for CrHydA1, signifying a smaller time constant. Quantitatively, using kex = 2πf, the kex values for CpI and CrHydA1 are 157 and 25 s−1, corresponding to 78 and 12 molecules H2 per second, respectively. These are useful but approximate values erring on the high side, as the modulation amplitude (10 mV rms equates to Eeq ± 5 mV) can never be zero.
Fig. 5.
Bode representations for the [FeFe]-hydrogenases poised at the equilibrium potential. Conditions: pH 7.0 (0.10 M phosphate buffer); temperature, 0 °C. The symbols are experimental data points, and the lines are included to guide the eye.
By backcalculation, the kex values allow estimation of the electroactive coverage in the experiment conducted. We obtained 0.91 × 10⁻¹² mol⋅cm−2 for CpI, and 1.26 × 10⁻¹² mol⋅cm−2 for CrHydA1. The low values are consistent with the inability to observe any signals due to Fe–S clusters under noncatalytic (CO-inhibited) conditions.
Analysis of Nyquist spectra to resolve the dependences of catalytic turnover rate on potential.
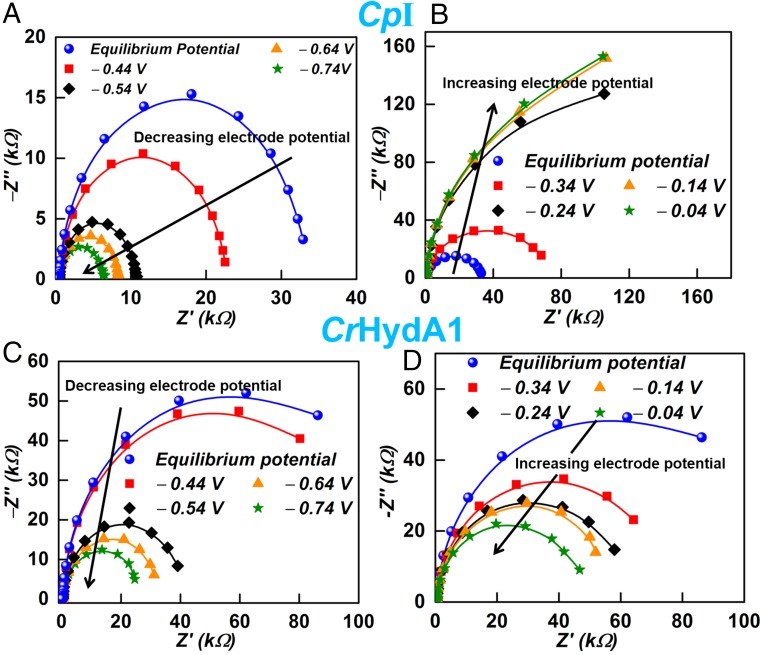
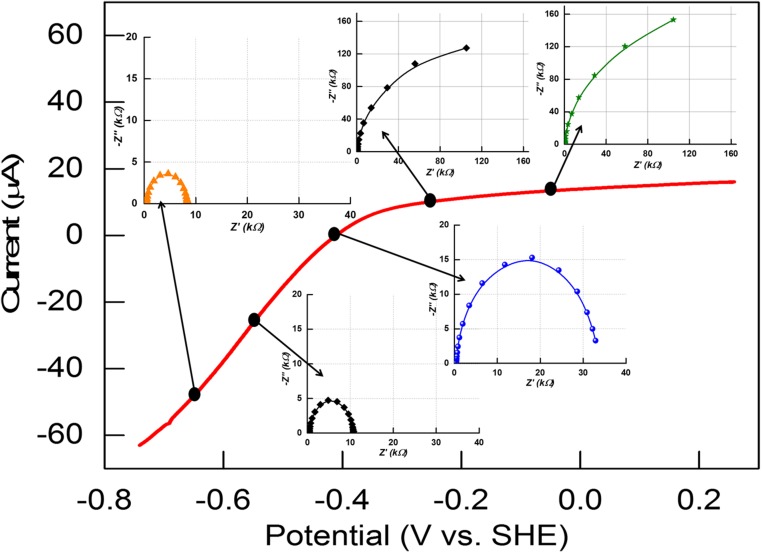
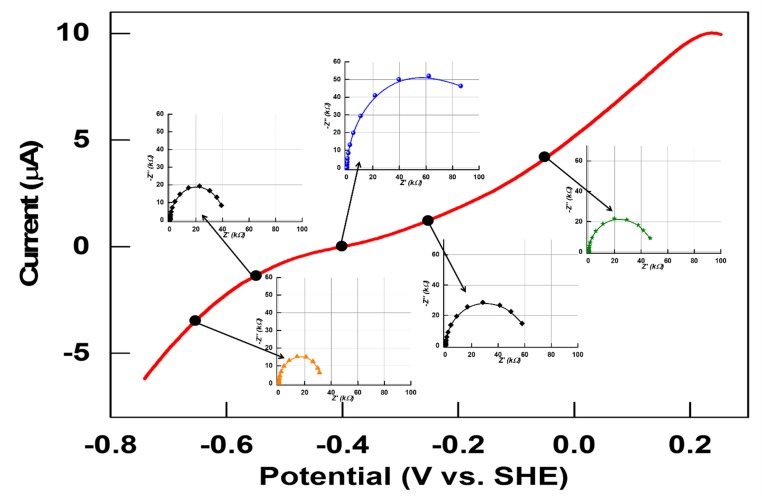
Impedance measurements (Fig. 6) were carried out at various potentials from −1.0 to −0.250 V vs. saturated calomel electrode (SCE), the blue symbols corresponding to the equilibrium potential. Figs. S1 and S2 show how impedance spectroscopy measurements relate to the cyclic voltammograms at different potentials. For both CpI and CrHydA1, applying an increasing overpotential in the proton-reducing direction causes the low-frequency semicircles to contract in size and cut the x axis at increasingly lower Z′ values on the right. However, CpI and CrHydA1 show completely different behavior upon increasing the overpotential in the H2 oxidation direction: whereas CrHydA1 displays the expected semicircle contraction, CpI shows a strong expansion.
Fig. 6.
Impedance measurements at various potentials vs. SHE: (A) at electrode potentials where CpI catalyzes net H+ reduction [black arrow signifies decreasing (more negative) electrode potential]; (B) at electrode potentials where CpI catalyzes the net oxidation of H2 [black arrow signifies increasing (more positive) electrode potential]; (C) at electrode potentials where CrHydA1 catalyzes net H+ reduction [black arrow signifies decreasing (more negative) electrode potential]; (D) at electrode potentials where CrHydA1 catalyzes the net oxidation of H2 [black arrow signifies increasing (more positive) electrode potential]. Conditions: pH 7.0 (0.10 M phosphate buffer), temperature, 0 °C. The symbols are experimental data points, and the lines are the theoretical fit.
Fig. S1.
A series of EIS spectra measured at different potentials of cyclic voltammograms for CpI.
Fig. S2.
A series of EIS spectra measured at different potentials of cyclic voltammograms for CrHydA1.
Fig. 7A shows how Re values vary within a narrow potential range (±0.4 V) on either side of the equilibrium value. The results were obtained by fitting the Nyquist spectra to the standard model for the circuit shown in Fig. 4. The two enzymes are distinguished by their contrasting behavior either side of the equilibrium potential (0 V vs. RHE): notably, the potential dependences of Re closely mirror the DC voltammograms shown in Fig. 2. For CpI, Re is low and fairly constant at potentials less than −0.15 V vs. RHE but increases steeply after the potential is raised through ERHE = 0 before starting to level off above 0.2 V vs. RHE. In contrast, for CrHydA1, Re is maximal around ERHE = 0 and falls away either side, coincident with catalytic rates increasing fairly symmetrically. Fig. 7B shows how Ce values vary with potential. First, for CpI, Ce remains constant and large up to an overpotential η = 0.2, thereby showing that the active site operates proficiently over an equally large overpotential each side of ERHE = 0. Only above 0.2 V vs. ERHE does the decrease in Ce suggest that the H2 oxidation rate is becoming limited by a decrease in the catalytic efficacy of the H cluster. In contrast, the equivalent Ce data for CrHydA1 show a broad and constant minimum extending between 0 and +0.2 V vs. ERHE, then increasing either side, the latter correlating broadly with decreasing Re and lowering of ET limitation.
Fig. 7.
Potential-dependent variation of (A) Re, and (B) Ce, extracted from the low-frequency arcs of Nyquist spectra at various potentials for the [FeFe]-hydrogenases adsorbed on a PGE electrode. The symbols are experimental data points, and the lines are included to guide the eye. The vertical broken line marks the formal reversible hydrogen potential (RHE) derived from the measured zero-current potential and used to correlate the upper RHE scale with the lower SHE scale.
Although both hydrogenases contain the H cluster, with the basic arrangement of atoms expected to be conserved, the environments and routes for H2 and H+ transport may differ (16). Without ruling these factors out in terms of influence, by far the most obvious difference between CpI and CrHydA1 is the presence of an extended FeS relay in the former case. For CpI, the fact that the internal Fe–S relay offers little resistance at potentials close to and more negative than ERHE = 0 must be an important factor in determining the catalytic bias that lies well in favor of H2 evolution vs. H2 oxidation at neutral pH values. According to a recent model (3), which assumes that the H2 concentration is high enough that its binding or dissociation are removed from consideration, a key factor in determining the catalytic bias of an enzyme is the difference between the reduction potential of the site(s) at which electrons enter or leave the enzyme and the reduction potential of the reaction being catalyzed: even a small difference (<50 mV) can result in a large difference between oxidation and reduction rate. The FeS centers of CpI that are detectable by EPR have an average reduction potential of approximately −420 mV vs. SHE (18, 34), although specific values for the two distal FeS centers are currently unknown and may be more negative. Lacking a long-range FeS relay, CrHydA1 displays no such catalytic bias; instead, as confirmed by the Re values, the catalytic rate is limited by electron transfer in each direction.
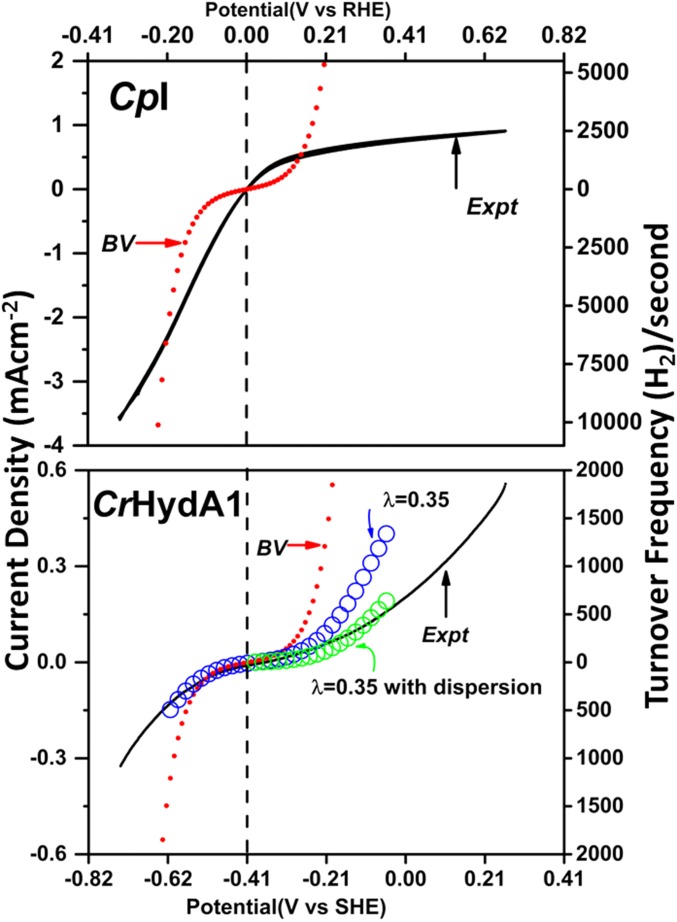
The Butler–Volmer equation, iE = i0{exp(−αηF/RT) − exp((1 − α)ηF/RT)}, where η is the overpotential, was used as a first approximation to calculate how the electrocatalytic current should vary with electrode potential if it is limited by interfacial one-electron transfers (3). Fig. 8 shows the results obtained by inputting either exchange current density i0 (left-hand ordinate) or electrocatalytic exchange rate expressed as H2 molecules per second (right-hand ordinate). For CpI, the catalytic current close to ERHE = 0 greatly exceeds the BV model in each direction, a consequence of ET being mediated through the low-potential electron relay. For CrHydA1, the BV model gives good agreement between observed and calculated curves over the range E ± 0.1 V vs. ERHE, but at higher overpotentials, the observed values drop away. Use of a Marcus–Hush–Chidsey (MHC) model with reorganization energy λ = 0.35 eV gave a better fit (35), and a further improvement was obtained by introducing some dispersion (optimized at βd0 = 11; Fig. S3) that is expected in view of the complexity of protein interactions with the rough electrode surface (36). Although the MHC approach is approximate, and λ is likely to vary across the wide potential range where different intermediate states dominate, there is no doubt that it is more applicable than the BV model. A simulation and list of variables giving the best fit for CpI are given in Fig. S4 and Table S1. The electrocatalytic exchange rate for CrHydA1 is thus controlled by long-range ET and the value of 12 molecules H2 per second must understate the inherent activity of the H cluster. Even at 0 °C, CpI attains a turnover frequency exceeding 5,000 s−1 for H2 evolution (molecules H2 produced per molecule of enzyme) at η = 0.2 V, whereas H2 oxidation is limited to below 2,000 s−1. The values may be compared with the broad result of 21,000 ± 12,000 s−1 for H+ reduction at 25 °C, pH 7.0 with η ∼ 0.1 V, reported for a similar enzyme (HydA from Clostridium acetobutylicum) (11). It is probable that similar rates would be observed for CrHydA1 were long-range electron transfer to be more efficient, no doubt a result of the PGE electrode being a poor substitute for the natural ET partner PetF (19). As long realized, the H cluster is a superb catalyst of H2 activation; the low value for λ suggests that it is also optimized for electron transfer.
Fig. 8.
Analysis of voltammograms for CpI and CrHydA1 scaled with respect to current densities and turnover frequencies determined from the experiments described in this paper. Comparisons are made in each case with current–potential dependencies calculated using a simple Butler–Volmer model. The vertical broken line marks the equilibrium potential at ERHE = 0. For CrHydA1, comparisons are also shown with current–potential dependencies determined using MHC theory (open circles) with λ = 0.35 eV, with and without inclusion of some dispersion (see text). The vertical broken line marks the formal reversible hydrogen potential (RHE) derived from the measured zero-current potential and used to correlate the upper RHE scale with the lower SHE scale.
Fig. S3.
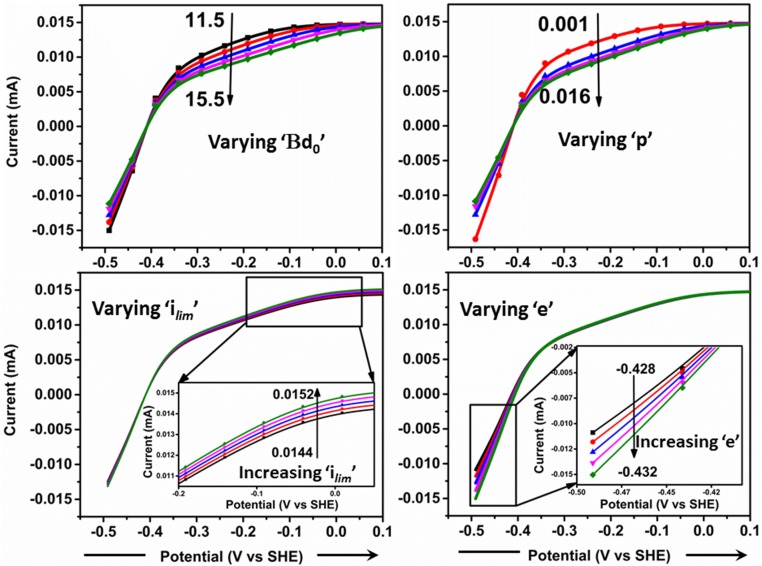
Schemes showing effects of varying factors βd0, the quantity p, ilim, and e on the value of j. The values of the parameters, unless being explicitly varied, are βd0 = 13.5, p = 0.006, ilim = 0.0148, and e = −0.430.
Fig. S4.
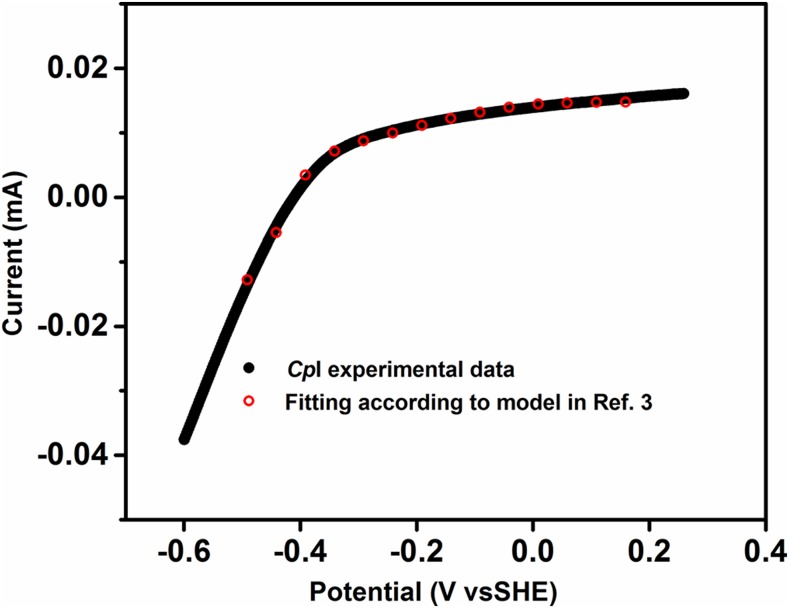
The best fit of the experimental data to the model in ref. 3, obtained using the variables ilim = 0.0148, βd0 = 13.5, p = 0.006, and e = −0.430 V.
Table S1.
Values of the variables producing the best fit and corresponding information about the catalytic bias in CpI
| Variable | Information about the enzyme |
| βd0 = 13.5 | A larger value of βd0 results in a more shallow increase in current with increasing overpotential. For a β value in the range 10–12 nm−1, the point of entry d0 is calculated to be 1.125−1.35 nm. |
| The value of e = −0.430 leads to e2 = 2.008 | A value of e2 > 1 (EOx/R < Eeqm) indicates a catalytic entity that is more proficient at catalyzing the cathodic (reduction) reaction relative to the anodic (oxidation) reaction. |
| p = 0.006 | When p < < 1, the inherent rate constants for the catalytic reaction are small compared with k0. |
Materials and Methods
CpI and CrHydA1 were prepared as described previously, using the semisynthetic procedure (37). All electrochemical experiments were carried out using a Ivium CompactStat E800 workstation equipped with a frequency response analyzer. A PGE electrode was used as working electrode in the main thermostated (0 °C) compartment of a three-electrode cell, in which a Pt wire was used as the counterelectrode and a SCE contained in a Luggin capillary side arm maintained at room temperature was used as a nonisothermal reference (24). To form each film of enzyme, 1 μL of 50 μM enzyme solution was pipetted onto the freshly polished PGE electrode, and excess solution was removed after 1 min. The electrochemical cell was housed in a glove box (Vacuum Atmospheres, O2 < 5 ppm). The main compartment contained 0.10 M phosphate buffer at pH 7.0, and H2 gas (100%) was flowed through the cell headspace. The electrode was rotated at 1,000 rpm. Potentials were converted to the standard hydrogen scale using ESHE = ESCE + 241 mV to relate to most literature available (20). A formal RHE scale was generated using the potential of zero net current. To switch off hydrogenase electrocatalysis, the flow of H2 was stopped, 5 mL of CO-saturated buffer was injected into the cell to give an initial concentration of 77 μM CO, and a potential of −250 mV (vs. SCE) was applied for 5 min before recording impedance measurements (24). Due care was taken, for example, by conducting experiments at 0 °C, to maximize enzyme film stability, which was checked by recording a cyclic voltammogram after each set of impedance measurements.
Experimental Conditions for EIS Measurements
Resistance is normally defined as the ratio between voltage V and current I through Ohm’s law . However, this relationship is limited to an ideal resistor, and it is therefore necessary to introduce a circuit element “impedance” that accounts for more complex behavior. Electrochemical impedance is measured by applying a small potential modulation: the current response to a sinusoidal potential is a sinusoidal wave at the same frequency but shifted in phase. The excitation signal as a function of time has the following form:
where is the potential at time t, is the amplitude of the signal, and is the angular frequency. The response current is shifted in phase () and has a different amplitude, :
The impedance is therefore expressed in terms of a magnitude,, and a phase shift,
An AC response model for the enzyme-modified electrodes is summarized in Fig. 4 of the main article. In an EIS experiment, a constant potential is combined with a frequency-dependent sinusoidal modulation voltage through the equation , where is the perturbation frequency, is the amplitude of the AC signal, and . Generally, a sufficiently small voltage modulation is used, that is, kBT/|e| ∼ 25 mV (rms) to avoid a nonlinear response. In the experiments described, AC modulation voltages of 5 and 10 mV (rms) were tested; they gave similar results at each frequency, but better resolution was obtained with 10-mV modulation. Data obtained using an AC modulation voltage of 20 mV were distorted by a nonlinear response. Hence, an AC modulation amplitude of 10 mV was used for all EIS measurements. Measurements were carried out at different potentials in the frequency range of 0.1 Hz to 100 kHz.
The frequency-dependent Nyquist plot is represented by complex impedance (), which has real () and imaginary () components. The net impedance () is a series combination of impedances due to the cell resistance, electrical double layer, and catalytic electron transport through the enzyme. Considering the individual impedance elements, the net impedance (Z) is given by the following:
where and are the real and imaginary parts of the complex impedance.
To obtain the exchange rate constant, the frequency (f) response was analyzed using a Bode plot in which net impedance and/or phase angle () are plotted against log f. The net impedance for a Bode plot is given by the following:
Selected EIS spectra around cyclic voltammograms for CpI and CrHydA1 are shown below to help clarify the measurements of impedance data.
Computational Modeling Using Marcus–Hush–Chidsey Theory
The following equations used to model the electrocatalytic voltammetry of CrHydA1 are based on equations 7 and 8 in ref. 35. Rate constants were also converted into current density (in milliamperes per square centimeter) using i = kFAΓ (F is Faraday constant, A is geometric electrode area, and Γ is surface coverage). The equations were written as a program in Wolfram Mathematica 10.4 to obtain the theoretical current density curve shown in Fig. 8 of the main article:
The equations correspond to reduction (f) and oxidation (g). The two variables are y and λ: y is the overpotential term and equivalent to (E − Ef0), where E is the applied potential and Ef0 is the formal potential of the 2H+/H2 couple; λ is the reorganization energy term, measured in electronvolts. For the modeling, the k0 value was 25 s−1 and α was 0.5.
Computational Modeling for CrHydA1 Including Effect of Dispersion
The effect of inhomogeneity (dispersion) of interfacial electron transfer rate constants was introduced as described in ref. 36 (equation 6a in that article). The assumption was made that the exchange rate constant value of 25 s−1 corresponds to kmin: hence k0min =k0maxexp(−βd0), where βd0 is the decay constant × distance of closest approach (equation 3 of ref. 36). This results in the following equation, where kcat is the turnover frequency:
Computational Modeling for CpI with Incorporation of a Catalytic Bias
The model described in ref. 3 was adopted to model the electrocatalytic voltammetry of CpI. The input function, j, depends on ilim, βd0, and the quantity p (the ratio of the rate constants for the catalytic reaction compared with exchange rate constant, k0):
Additionally, j depends on the applied potential E and the effective potential (e) of the relay center that serves as the electron entry/exit point (the best fit was obtained with e = −0.43 V vs. SHE). The variation of j with ilim, βd0, and the quantity p are plotted in Fig. S3. The best fit is shown in Fig. S4 and was obtained with ilim = 0.0148, βd0 = 13.5, p = 0.006, and e = −0.430 V.
Acknowledgments
This research was supported by the ERASynBio Consortium “Sun2Chem.” F.A.A. thanks the UK Biotechnology and Biological Sciences Research Council for funding (Grant BB/M005720/1). K.P. thanks the British Council for a Newton Bhabha PhD Placement Award. S.T.A.I. was supported through the Merit Scholarship Programme for High Technology administered by the Islamic Development Bank. T.H. gratefully acknowledges support from the Deutsche Forschungsgemeinschaft (Cluster of Excellence RESOLV, EXC1069) and the Volkswagen Foundation (LigH2t). F.A.A. is a Royal Society–Wolfson Research Merit Award holder.
Footnotes
The authors declare no conflict of interest.
This article is a PNAS Direct Submission.
This article contains supporting information online at www.pnas.org/lookup/suppl/doi:10.1073/pnas.1619961114/-/DCSupplemental.
References
- 1.Armstrong FA, Hirst J. Reversibility and efficiency in electrocatalytic energy conversion and lessons from enzymes. Proc Natl Acad Sci USA. 2011;108:14049–14054. doi: 10.1073/pnas.1103697108. [DOI] [PMC free article] [PubMed] [Google Scholar]
- 2.Hexter SV, Grey F, Happe T, Climent V, Armstrong FA. Electrocatalytic mechanism of reversible hydrogen cycling by enzymes and distinctions between the major classes of hydrogenases. Proc Natl Acad Sci USA. 2012;109:11516–11521. doi: 10.1073/pnas.1204770109. [DOI] [PMC free article] [PubMed] [Google Scholar]
- 3.Hexter SV, Esterle TF, Armstrong FA. A unified model for surface electrocatalysis based on observations with enzymes. Phys Chem Chem Phys. 2014;16:11822–11833. doi: 10.1039/c3cp55230f. [DOI] [PubMed] [Google Scholar]
- 4.Abou Hamdan A, et al. Understanding and tuning the catalytic bias of hydrogenase. J Am Chem Soc. 2012;134:8368–8371. doi: 10.1021/ja301802r. [DOI] [PubMed] [Google Scholar]
- 5.Hansen HA, Varley JB, Peterson AA, Nørskov JK. Understanding trends in the electrocatalytic activity of metals and enzymes for CO2 reduction to CO. J Phys Chem Lett. 2013;4:388–392. doi: 10.1021/jz3021155. [DOI] [PubMed] [Google Scholar]
- 6.Jones AK, Sillery E, Albracht SPJ, Armstrong FA. Direct comparison of the electrocatalytic oxidation of hydrogen by an enzyme and a platinum catalyst. Chem Commun (Camb) 2002;2002:866–867. doi: 10.1039/b201337a. [DOI] [PubMed] [Google Scholar]
- 7.Alonso-Lomillo MA, et al. Hydrogenase-coated carbon nanotubes for efficient H2 oxidation. Nano Lett. 2007;7:1603–1608. doi: 10.1021/nl070519u. [DOI] [PubMed] [Google Scholar]
- 8.Hambourger M, et al. [FeFe]-hydrogenase-catalyzed H2 production in a photoelectrochemical biofuel cell. J Am Chem Soc. 2008;130:2015–2022. doi: 10.1021/ja077691k. [DOI] [PubMed] [Google Scholar]
- 9.Matsumoto T, et al. [NiFe]Hydrogenase from Citrobacter sp. S-77 surpasses platinum as an electrode for H2 oxidation reaction. Angew Chem Int Ed Engl. 2014;53:8895–8898. doi: 10.1002/anie.201404701. [DOI] [PubMed] [Google Scholar]
- 10.Armstrong FA, et al. Guiding principles of hydrogenase catalysis instigated and clarified by protein film electrochemistry. Acc Chem Res. 2016;49:884–892. doi: 10.1021/acs.accounts.6b00027. [DOI] [PubMed] [Google Scholar]
- 11.Madden C, et al. Catalytic turnover of [FeFe]-hydrogenase based on single-molecule imaging. J Am Chem Soc. 2012;134:1577–1582. doi: 10.1021/ja207461t. [DOI] [PubMed] [Google Scholar]
- 12.Rodriguez-Maciá P, Dutta A, Lubitz W, Shaw WJ, Rüdiger O. Direct comparison of the performance of a bio-inspired synthetic nickel catalyst and a [NiFe]-hydrogenase, both covalently attached to electrodes. Angew Chem Int Ed Engl. 2015;54:12303–12307. doi: 10.1002/anie.201502364. [DOI] [PubMed] [Google Scholar]
- 13.Priyadarshani N, et al. Achieving reversible H2/H+ interconversion at room temperature with enzyme-inspired molecular complexes: A mechanistic study. ACS Catal. 2016;6:6037–6049. [Google Scholar]
- 14.Lubitz W, Ogata H, Rüdiger O, Reijerse E. Hydrogenases. Chem Rev. 2014;114:4081–4148. doi: 10.1021/cr4005814. [DOI] [PubMed] [Google Scholar]
- 15.Berggren G, et al. Biomimetic assembly and activation of [FeFe]-hydrogenases. Nature. 2013;499:66–69. doi: 10.1038/nature12239. [DOI] [PMC free article] [PubMed] [Google Scholar]
- 16.Knörzer P, et al. Importance of the protein framework for catalytic activity of [FeFe]-hydrogenases. J Biol Chem. 2012;287:1489–1499. doi: 10.1074/jbc.M111.305797. [DOI] [PMC free article] [PubMed] [Google Scholar]
- 17.Peters JW, Lanzilotta WN, Lemon BJ, Seefeldt LC. X-ray crystal structure of the Fe-only hydrogenase (CpI) from Clostridium pasteurianum to 1.8 angstrom resolution. Science. 1998;282:1853–1858. doi: 10.1126/science.282.5395.1853. [DOI] [PubMed] [Google Scholar]
- 18.Adams MWW. The mechanisms of H2 activation and CO binding by hydrogenase I and hydrogenase II of Clostridium pasteurianum. J Biol Chem. 1987;262:15054–15061. [PubMed] [Google Scholar]
- 19.Winkler M, Kuhlgert S, Hippler M, Happe T. Characterization of the key step for light-driven hydrogen evolution in green algae. J Biol Chem. 2009;284:36620–36627. doi: 10.1074/jbc.M109.053496. [DOI] [PMC free article] [PubMed] [Google Scholar]
- 20.Bard AJ, Faulkner LR. Electrochemical Methods: Fundamentals and Applications. Wiley; New York: 2001. [Google Scholar]
- 21.Bertoluzzi L, Lopez-Varo P, Jimenez Tejada JA, Bisquert J. Charge transfer processes at the semiconductor/electrolyte interface for solar fuel production: Insight from impedance spectroscopy. J Mater Chem A Mater Energy Sustain. 2016;4:2873–2879. [Google Scholar]
- 22.Pandey K, Yadav P, Mukhopadhyay I. Elucidating the effect of copper as a redox additive and dopant on the performance of a PANI based supercapacitor. Phys Chem Chem Phys. 2015;17:878–887. doi: 10.1039/c4cp04321a. [DOI] [PubMed] [Google Scholar]
- 23.Yadav P, Tripathi B, Pandey K, Kumar M. Recombination kinetics in a silicon solar cell at low concentration: Electro-analytical characterization of space-charge and quasi-neutral regions. Phys Chem Chem Phys. 2014;16:15469–15476. doi: 10.1039/c4cp01115e. [DOI] [PubMed] [Google Scholar]
- 24.Goldet G, et al. Electrochemical kinetic investigations of the reactions of [FeFe]-hydrogenases with carbon monoxide and oxygen: Comparing the importance of gas tunnels and active-site electronic/redox effects. J Am Chem Soc. 2009;131:14979–14989. doi: 10.1021/ja905388j. [DOI] [PubMed] [Google Scholar]
- 25.Foster CE, et al. Inhibition of [FeFe]-hydrogenases by formaldehyde and wider mechanistic implications for biohydrogen activation. J Am Chem Soc. 2012;134:7553–7557. doi: 10.1021/ja302096r. [DOI] [PubMed] [Google Scholar]
- 26.Moganty SS, Baltus RE, Roy D. Electrochemical windows and impedance characteristics of [Bmim+][BF4−] and [Bdmim+][ BF4−] ionic liquids at the surfaces of Au, Pt, Ta and glassy carbon electrodes. Chem Phys Lett. 2009;483:90–94. [Google Scholar]
- 27.Zheng J, Moganty SS, Goonetilleke PC, Baltus RE, Roy D. A comparative study of the electrochemical characteristics of [Emim+][BF4−] and [Bmim+][BF4−] ionic liquids at the surfaces of carbon nanotube and glassy carbon electrodes. J Phys Chem C. 2011;115:7527–7537. [Google Scholar]
- 28.Gray HB, Winkler JR. Electron flow through metalloproteins. Biochim Biophys Acta-Bioenerg. 2010;1797:1563–1572. doi: 10.1016/j.bbabio.2010.05.001. [DOI] [PubMed] [Google Scholar]
- 29.Page CC, Moser CC, Chen X, Dutton PL. Natural engineering principles of electron tunnelling in biological oxidation-reduction. Nature. 1999;402:47–52. doi: 10.1038/46972. [DOI] [PubMed] [Google Scholar]
- 30.Schlicht S, et al. An electrochemically functional layer of hydrogenase extract on an electrode of large and tunable specific surface area. J Mater Chem A Mater Energy Sustain. 2016;4:6487–6494. [Google Scholar]
- 31.Vidaković-Koch T, Mittal VK, Do TQN, Varničić M, Sundmacher K. Application of electrochemical impedance spectroscopy for studying of enzyme kinetics. Electrochim Acta. 2013;110:94–104. [Google Scholar]
- 32.Rumpel S, et al. Structural insight into the complex of ferredoxin and [FeFe] hydrogenase from Chlamydomonas reinhardtii. ChemBioChem. 2015;16:1663–1669. doi: 10.1002/cbic.201500130. [DOI] [PubMed] [Google Scholar]
- 33.Katz E, Willner I. Probing biomolecular interactions at conductive and semiconductive surfaces by impedance spectroscopy: Routes to impedimetric immunosensors, DNA-sensors, and enzyme biosensors. Electroanalysis. 2003;15:913–947. [Google Scholar]
- 34.Adams MWW, Eccleston E, Howard JB. Iron-sulfur clusters of hydrogenase I and hydrogenase II of Clostridium pasteurianum. Proc Natl Acad Sci USA. 1989;86:4932–4936. doi: 10.1073/pnas.86.13.4932. [DOI] [PMC free article] [PubMed] [Google Scholar]
- 35.Henstridge MC, Laborda E, Rees NV, Compton RG. Marcus-Hush-Chidsey theory of electron transfer applied to voltammetry: A review. Electrochim Acta. 2012;84:12–20. [Google Scholar]
- 36.Léger C, Jones AK, Albracht SPJ, Armstrong FA. Effect of a dispersion of interfacial electron transfer rates on steady state catalytic electron transport in [NiFe]-hydrogenase and other enzymes. J Phys Chem B. 2002;106:13058–13063. [Google Scholar]
- 37.Esselborn J, et al. Spontaneous activation of [FeFe]-hydrogenases by an inorganic [2Fe] active site mimic. Nat Chem Biol. 2013;9:607–609. doi: 10.1038/nchembio.1311. [DOI] [PMC free article] [PubMed] [Google Scholar]


