

Abstract
Thyroid hormone (TH) may control the ratio of oligodendrocytes to astrocytes in white matter by acting on a common precursor of these two cell types. If so, then TH should produce an equal but opposite effect on the density of these two cells types across all TH levels. To test this, we induced graded TH insufficiency by treating pregnant rats with increasing doses of propylthiouracil. Propylthiouracil induced a dose-dependent decrease in serum T4 in postnatal d 15 pups, a dose-dependent decrease in the density of MAG-positive oligodendrocytes, and an equal increase in the density of glial fibrillary acidic protein-positive astrocytes in both the corpus callosum and anterior commissure. Linear regression analyses demonstrated a strong correlation between glial densities and serum T4; this correlation was positive for astrocytes and negative for oligodendrocytes. Surprisingly, oligodendrocyte density in the corpus callosum was more sensitive to changes in TH than in the anterior commissure, as indicated by the slope of the regressions. Furthermore, we measured an overall reduction in the cellular density that was independent of changes in myelin-associated glycoprotein and glial fibrillary acidic protein-positive cells. These data strongly support the interpretation that TH controls the balance of production of oligodendrocytes and astrocytes in major white matter tracts of the developing brain by acting on a common precursor of these cell types. Moreover, these findings indicate that major white matter tracts may differ in their sensitivity to TH insufficiency.
THYROID HORMONE (TH) is essential for normal brain development in humans and in animals (1). Recent studies of children with congenital hypothyroidism (CH) reveal some of the complexity in the relationship between low TH and cognitive development. For example, newborn screening for CH has virtually eliminated mental retardation associated with this disease by allowing early detection and prevention of postnatal hypothyroidism (2). However, cognitive deficits remain in these children, depending on the severity of CH at diagnosis as well as the duration of exposure to TH insufficiency and the therapeutic treatment paradigm used (3, 4, 5, 6, 7). These and other findings show that the residual cognitive deficits associated with CH are related to the severity and developmental timing of the insult (8).
An important event regulated by TH is white matter development (9, 10). Children born with low circulating levels of TH (i.e. congenital hypothyroidism) exhibit abnormal myelination as defined by both biochemical analysis (11) and proton magnetic resonance spectroscopy (12). Likewise, structural disturbances in white matter tracts in the brain are associated with behavioral deficits, especially attentional deficits (13, 14, 15). Finally, children with congenital hypothyroidism exhibit attentional deficits (13), indicating that at least some of the cognitive deficits caused by low TH are related to structural abnormalities in white matter tracts.
This conclusion is supported by work in experimental animals. Developmental hypothyroidism causes a decrease in the number of oligodendrocytes in major white matter tracts such as the corpus callosum (CC) and anterior commissure (AC), which results in a decrease in the number of myelinated axons (14, 15, 16, 17). We recently found that severe developmental hypothyroidism also leads to an increase in astrocyte numbers in the CC and AC that is exactly balanced by the decrease in oligodendrocyte number such that the sum of these two cell types is not altered in the hypothyroid animal (14). This observation is consistent with in vitro studies showing that TH acts on a glial-restricted precursor (GRP)/oligodendrocyte type II astrocyte (O2A) cell to induce oligodendrocyte differentiation at the cost of astrocyte differentiation (38, 39, 40).
Although there is strong evidence in vitro that oligodendrocytes and astrocytes are derived from a common precursor (18), several recent studies indicate that oligodendrocytes may also be derived from precursor cells that generate γ-aminobutyric acid interneurons in the telencephalon (19), rather than from common precursors of oligodendrocytes and astrocytes. In addition, fate-mapping studies demonstrate that oligodendrocytes in the telencephalon are derived from progenitors that arise from at least three different embryonic brain regions (20); therefore, different subpopulations of oligodendrocyte lineages may exhibit regional differences in their abundance and may not be related to astrocyte number.
Because we previously used severe hypothyroidism to study the effects of TH on the number of oligodendrocytes and astrocytes in white matter, it is possible that our results were misleading. Specifically, in the complete absence of TH, oligodendrocyte number may be maximally suppressed and astrocyte number may be maximally increased, and it may be fortuitous that the sum of these two cell types is not altered (14). In contrast, if these two cell types are derived from a common precursor and if this precursor is the site of TH action to regulate the balance of production of oligodendrocytes and astrocytes, then the sum of these two cell types should be the same across all levels of TH. To test this hypothesis, we examined oligodendrocyte, astrocyte and total cell density in the corpus callosum and anterior commissure of rat pups on postnatal d 15 (P15) after exposure to various doses of propylthiouracil.
Materials and Methods
Animals
All animal treatments were completed at the U.S. Department of Environmental Protection (Research Triangle Park, NC) in an Assessment and Accreditation of Laboratory Animal Care-approved animal facility. Treatments were in strict accordance with the National Institutes of Health Guide for the Care and Use of Laboratory Animals and had been approved by an institutional animal care and use committee. Timed pregnant Long-Evans rats were purchased from Charles River (Raleigh, NC) and shipped to the treatment facility at the U.S. Department of Environmental Protection on gestational d (G) 2 and housed individually in standard hanging plastic cages. Rats were randomly assigned to one of four groups: control (0 ppm), 1 ppm (0.0001%) propylthiouracil (PTU; Sigma, St. Louis, MO), 2 ppm PTU (0.0002%), and 3 ppm PTU (0.0003%). PTU was provided in the drinking water and was initiated on G6 and continued until pups were killed on P15. On P15, one female pup from each litter was weighed and killed by decapitation. Trunk blood was collected and the brain was removed and immediately frozen on pulverized dry ice and stored at −80 C.
RIA
Total serum T4 was measured as described previously (14). Briefly, total T4 was measured in 5 μl of rat serum using a barbital buffer system. After a 30-min incubation at 37 C with anti-T4 antibody and 125I-labeled T4, bound counts were precipitated by addition of ice-cold polyethylene glycol 8000 [20% (wt/vol); Sigma], centrifuged, and counted in a γ-counter. Standards were prepared from T4 (Sigma) measured using a Cahn electrobalance (Cahn Electrobalance, Inc., Madison, WI); standards were run in triplicate, whereas samples were run in duplicate. Standards were calibrated to measure serum T4 levels from 0.4 to 25.6 μg/dl. The assay was run at 40–50% binding; nonspecific binding was generally less than 8%. All samples were measured in a single assay.
In situ hybridization
Brains harvested in North Carolina were shipped on dry ice overnight to the University of Massachusetts-Amherst. Frozen brains were sectioned at 12 μm in coronal plane using a cryostat (Reichert-JungFrigocut 2800N; Leica Corp., Deerfield, IL). These sections were taken approximately 0.48–1.0 mm caudal to Bregma (corresponding to Figs. 14–16 in Ref. 21). Sections were thaw mounted onto twice gelatin-coated slides and stored at −80 C until hybridization.
The mRNA coding for myelin-associated glycoprotein (MAG) was detected using a 48-base oligonucleotide directed toward exon 8 of the rat MAG gene (5′-CAG GAT GGA GAC TGT CTC CCC CTC TAC CGC CAC CAC CGT CCC ATT CAC-3′; accession no. X05301, bp 1163–1116). This oligonucleotide was purchased from IDT DNA (Coralville, IA), and 3′ end labeled using terminal deoxynucleotidyl transferase (Roche Applied Sciences, Indianapolis, IN) according to the manufacturer’s instructions. We used a 10-fold molar excess of α33P-dATP relative to the oligonucleotide to produce an average tail length of 10 radiolabeled nucleotides per probe. Glial fibrillary acidic protein (GFAP) mRNA was detected using a α33P-labeled cRNA probe generated from a cDNA fragment in vitro coding for bp 2290–1365 of GFAP (accession no. NM017009) as previously described (14, 22).
Pre- and posthybridization treatments were performed as previously described (14, 23). Briefly, for each probe, two slides from each brain, each containing two adjacent fresh-frozen sections, were fixed in 4% formaldehyde/PBS for 30 min and then washed with PBS. Tissue sections were then acetylated, dehydrated through a graded series of alcohol, delipidated with chloroform, rehydrated to 95% ethanol, and air dried. Fifty microliters of hybridization buffer containing 2 × 10⁶ cpm were applied to each slide, coverslipped, and incubated at 52 C (cRNA) or 37 C (oligo) for 16 h. After hybridization, coverslips were removed in 1× saline sodium citrate and then processed to remove unhybridized probe as previously described (14).
Film autoradiography and signal quantification
After in situ hybridization, slides were arranged in x-ray cassettes and exposed to BioMax film (Eastman Kodak, Rochester, NY) for either 2 d (MAG) or 3 d (GFAP). Radiographic signals were developed using an automated film processor (Konica SRX-101A; Alliance Imaging Inc., Warham, MA) and analyzed as follows. A magnified image was captured using a Nikon macro lens mounted to a SPOT Insight camera (Diagnostic Instruments, Sterling Heights, MI) interfaced to a Macintosh computer operating SPOT Third Party software (Diagnostic Instruments). Using NIH Image J (freeware provided by W. Rashband, National Institute of Mental Health, Bethesda, MD), density values corresponding to the CC and AC radiographic signals were measured by encircling these areas with the drawing tool of Image J. Tissue background was measured for each section and subtracted from the paired signal image. The resulting density values for individual target mRNAs were averaged for each brain region within an animal. Statistical analysis was then performed on the resulting corrected mean densities.
Single-cell mRNA measurements
After exposure to film, slides were dipped in NTB radiographic emulsion (Eastman Kodak), air dried, boxed in a light-tight container, and stored at 4 C for either 4 d (MAG) or 6 d (GFAP). Emulsion-coated slides were developed in Dektol for 2 in, rinsed in water, fixed for 5 min in Kodak fixer, rinsed in water, counterstained with 0.5% methyl green, and coverslipped in Permount (Sigma-Aldrich, St. Louis, MO). Cellular levels of MAG and GFAP mRNAs were determined as previously described (14). Briefly, all slides were randomized, coded, and analyzed blindly. Images of the AC and CC were captured using a SPOT Insight camera (Diagnostic Instruments) mounted on a Nikon ES-600 microscope. Images were captured at ×200 magnification under dark-field optics. Using Image J (gift of W. Rashband, National Institute of Mental Health), a threshold was set such that only silver grains were detected and the area of silver grains associated with individual cells was determined by placing a circle of a fixed area (0.002 mm2 at ×200) over each cluster of silver grains. Ten cells per brain region were measured for a total of 40 cells per animal. The average of these 40 measurements was used as a point estimate of relative cellular levels of the target mRNA (i.e. proportional to amount of radioactive probe sequestered in each cell) (24). This method of estimating cellular mRNA levels has been demonstrated to closely resemble results obtained from directly counting silver grains (25). After analysis was complete, slides were decoded, averaged for each animal, and statistical analysis was performed.
Cell density measurements
To determine the density of MAG-positive and GFAP-positive cells per unit area in the CC, methyl green-stained nuclei associated with silver grain clusters were counted at a magnification of ×200 using an 5- × 5-mm ocular reticule. At this magnification, the reticule represents an area of 0.0625 mm2. Four fields were measured in each section, for a total of 16 fields per animal. In the AC, all MAG-positive and GFAP-positive nuclei were counted. The resulting cell counts were then normalized to AC area by measuring the area of the AC using the morphometric function in Image J. Each AC was analyzed unilaterally and averaged for each animal (two per section, four per slide, eight per animal).
To determine the total cellular density in the AC and CC, slides containing adjacent sections to those analyzed for MAG-positive cells were stained with 4′,6-diamidino-2-phenylindole (DAPI), which labels all nuclei within each section. DAPI-stained nuclei were visualized using a Nikon Eclipse microscope and ×400 magnified images were captured with a RT Slider charge-coupled device camera (Diagnostic Instruments). Cellular density was estimated by individually counting the number of nuclei contained within a box measuring 0.0225 mm2 at ×400 magnification on each digitally captured image. Two fields were measured for each section, producing eight estimates of overall cell density for each animal. The resulting estimates of cell density were averaged for each animal and statistical analysis was performed.
Statistical analysis
Results were analyzed using a one-way ANOVA. Post hoc test, when appropriate, were performed using Bonferroni’s t test. The Grubbs test was used to identify statistical outliers in all data. Although statistical outliers were identified in some data sets, the overall results were not altered by their omission. ANOVAs, post hoc tests, Grubbs test, and linear regressions were completed using GraphPad Prism statistical software (San Diego, CA).
Results
Animals and T4
PTU treatment was associated with a significant and graded reduction in serum total T4 in P15 pups. One-way ANOVA on serum total T4 revealed a significant effect of PTU treatment (F(3,30) = 65.27; P < 0.0001), and post hoc analysis demonstrated that T4 levels were significantly reduced at all PTU doses (Fig. 1A). On average, 1 ppm PTU produced a 28% decrease in serum total T4; 2 and 3 ppm PTU produced a 63 and 82% decrease, respectively. In contrast, one-way ANOVA revealed no significant effect of PTU treatment on P15 pup body weights (F(3,31) = 1.261; P = 0.3047 (Fig. 1B).
Fig. 1.
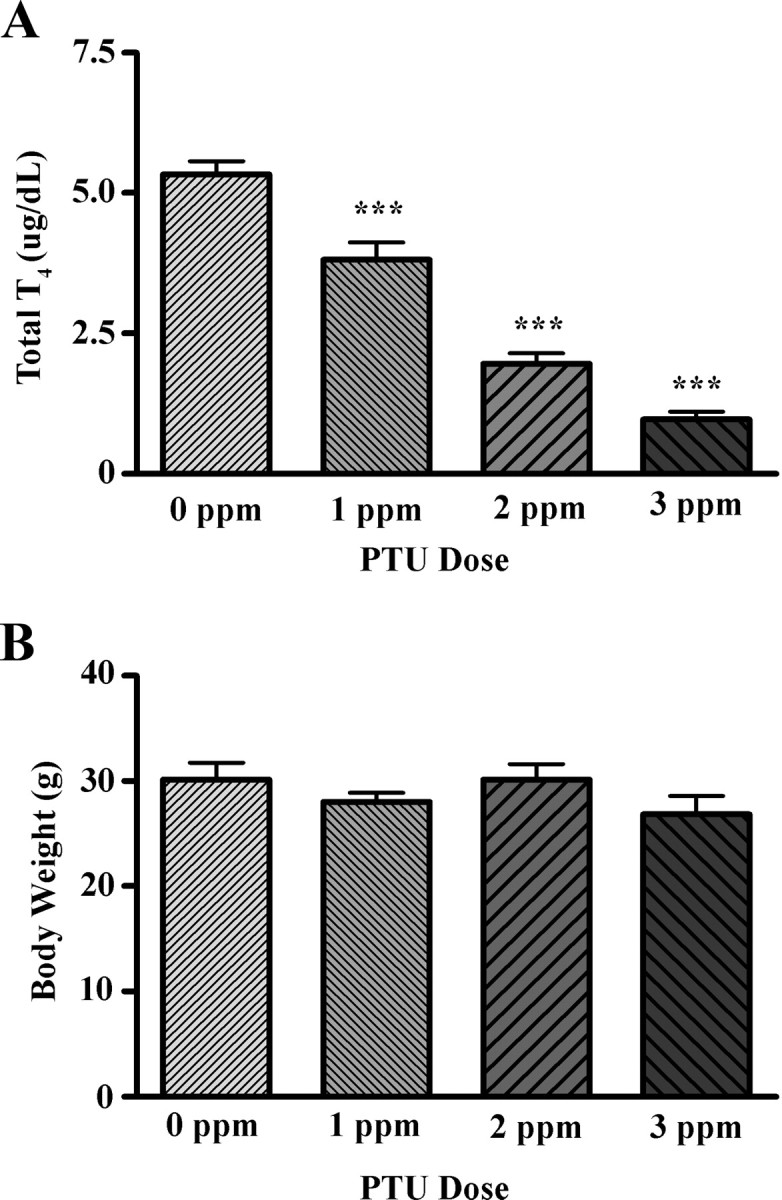
The effect of PTU on serum total T4 (A) and body weight (B) in P15 pups. All doses of PTU produced a significant degrease in serum total T4 but did not affect body weight (n = 7–10/group). ***, Significant difference from control at the P < 0.001 level.
Treatment effects on MAG expression
Film analysis of MAG expression in the AC and CC revealed a significant effect of PTU treatment on MAG expression in both regions of white matter (F(3,26) = 8.092, P = 0.0006 and F(3,27) = 15.82, P < 0.0001; AC, CC, respectively). Bonferroni’s t test demonstrated that MAG mRNA was significantly reduced by 3 ppm PTU in the AC but by both 2 and 3 ppm PTU in the CC (Fig. 2C).
Fig. 2.
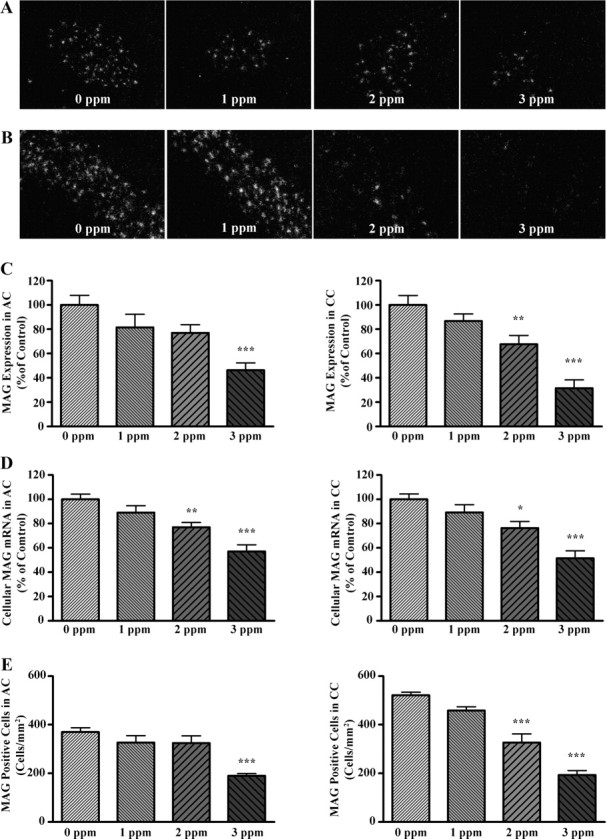
Treatment effects on MAG mRNA levels and MAG-positive oligodendrocyte density in the AC and CC. A and B, Dark-field micrographs of AC (A) and CC (B) after in situ hybridization for MAG mRNA using liquid photographic emulsion. Note the reduction in reflective puncta (single cells) with increased PTU dose. C, Quantification of density measurements from film autoradiography depicted as bar graphs showing the relative abundance of MAG mRNA in the AC (left panel) and CC (right panel). D, Quantification of relative cellular levels of MAG mRNA using silver grain area from dark-field images in A and B are shown for the AC (left panel) and CC (right panel). E, Quantification of MAG-positive cells in AC (left panel) and CC (right panel). Bars represent the mean ± sem of density values (C), silver grain area (D), or MAG-positive oligodendrocytes/mm2 (E) (n = 5–8/group). **, P < 0.01; ***, P < 0.001 (significantly different from control group using Bonferroni’s t test after a one-way ANOVA).
Effects of PTU on MAG expression using film analysis may not identify differences in cellular levels of MAG mRNA, or changes in the number of MAG-expressing cells (14). Therefore, we evaluated cellular levels of MAG mRNA using liquid photographic emulsion; the resulting dark-field images are shown in Fig. 2, A and B. The one-way ANOVA revealed a significant effect of PTU treatment on cellular levels of MAG mRNA in the AC and CC (F(3,26) = 13.17, P < 0.0001 and F(3,27) = 11.96, P < 0.0001; AC, CC, respectively). Post hoc analysis demonstrated that cellular levels of MAG mRNA were significantly reduced in animals exposed to PTU at 2 and 3 ppm in the both the AC and CC (Fig. 2D).
We next assessed whether the number of MAG-positive cells (terminally differentiated oligodendrocytes) was reduced in white matter tracts after PTU treatment. One-way ANOVA revealed a significant effect of PTU treatment on the density of MAG-positive oligodendrocytes in both the AC and CC (F(3,21) = 10.05, P = 0.0002 and F(3,26) = 31.57, P < 0.0001; AC, CC, respectively). Bonferroni’s t test demonstrated that the density of MAG-positive oligodendrocytes was significantly reduced in the AC of animals exposed to 3 ppm PTU and in the CC in animals exposed to 2 and 3 ppm (Fig. 2E).
Treatment effects on GFAP expression
Considering that thyroid hormone plays a role in the differentiation of oligodendrocytes from precursors that also generate astrocytes, we evaluated the effects of PTU treatment on GFAP expression and astrocyte number in white matter tracts. One-way ANOVA revealed a significant effect of PTU treatment on GFAP expression only in the CC (F(3,26) = 18.26, P < 0.0001). However, a strong trend of PTU exposure on GFAP expression in the AC was noted (F(3,24) = 2.791, P = 0.061). Bonferroni’s t test demonstrated that in the CC, PTU exposure significantly increased GFAP expression in animals exposed at 2 and 3 ppm (Fig. 3C).
Fig. 3.
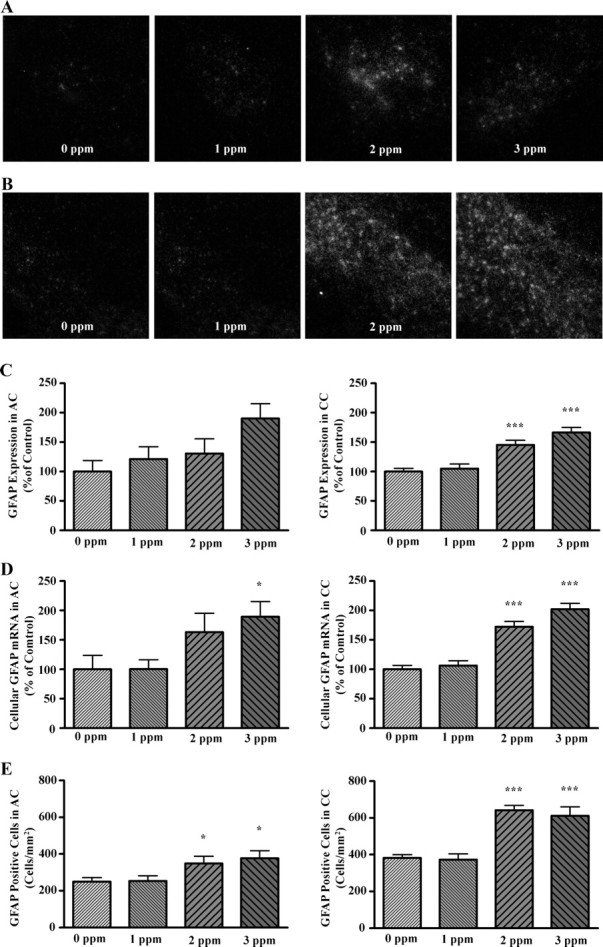
The effects of PTU treatment on GFAP expression, cellular levels of GFAP, and GFAP-positive cell density in the AC (A) and CC (B). A and B, Representative photomicrographs obtained after in situ hybridization for GFAP mRNA using liquid photographic emulsion. C, Quantification of GFAP mRNA abundance in AC (left panel) and CC (right panel) of film autoradiograms by microdensitometry. Data are depicted as bar graphs showing the relative abundance of GFAP. D, Bar graphs quantifying cellular GFAP mRNA levels in the AC (left panel) and CC (right panel). Dark-field images were thresholded and analyzed for silver grain area. PTU treatment significantly elevated cellular GFAP mRNA levels in the AC and CC. D, Bar graphs representing the mean density of astrocytes in the AC (left panel) and CC (right panel). PTU treatment significantly increased astrocyte density in the AC and CC in a dose-depend manner. Bars represent the mean ± sem of background corrected density values (C), silver grain area per cell (D), and number of GFAP-positive cells per square millimeter (E) (n = 6–9/group). ***, P < 0.001; **, P < 0.01; *, P < 0.05 (significantly different from control group using Bonferroni’s t test after a one-way ANOVA).
PTU treatment exerted significant effects on cellular levels of GFAP mRNA in cells of the AC and CC (Fig. 3, A, B, and D; F(3,28) = 3.01, P = 0.047 and F(3,27) = 32.17, P < 0.0001; AC, CC, respectively). Bonferroni’s t test demonstrated that cellular levels of GFAP were significantly increased at 3 ppm PTU in the AC and 2 and 3 ppm PTU in the CC.
PTU treatment also exerted significant effects on the density GFAP-positive cells in the AC and CC (F(3,25) = 3.355, P = 0.0348 and F(3,27) = 21.34, P < 0.0001; AC, CC respectively). Bonferroni’s t test demonstrated that the density of GFAP-positive cells is significantly increased at 2 and 3 ppm PTU in both the AC and CC (Fig. 3E).
Treatment effects on total cellular packing density
We next addressed whether total cellular density was altered in parallel with the observed reduction in density of MAG-positive cells or with the observed increase in density of GFAP-positive cells. One-way ANOVA revealed a significant effect of PTU treatment on total cellular density (i.e. DAPI stained nuclei) in the AC and CC (F(3,22) = 4.91, P = 0.0092 and F(3,26) = 27.59, P < 0.0001; AC, CC, respectively). Bonferroni’s t test demonstrated that the total cellular density was significantly reduced in the AC of animals exposed to 3 ppm PTU only and in the CC in animals exposed to 1, 2, and 3 ppm PTU (Fig. 4, C and D).
Fig. 4.
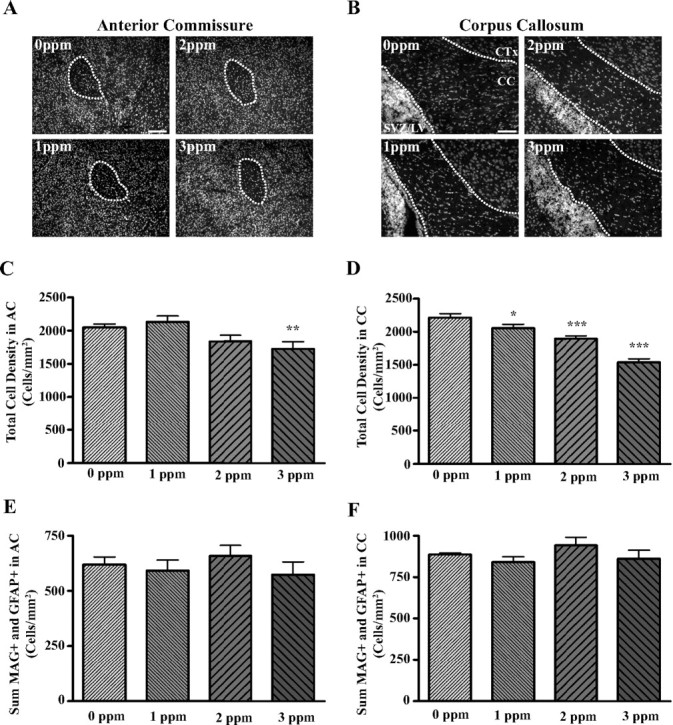
Treatment effects on total cellular packing density and sum of oligodendrocyte and astrocyte densities in the AC and CC. A and B, Fluorescent photomicrographs showing DAPI-stained nuclei in AC (A) and CC (B). DAPI staining was used to visualize nuclei in sections adjacent to those that MAG-positive cells were quantified. C and D, Bar graphs corresponding to the number of nuclei in the AC (C) and CC (D) per unit area. These results show that PTU treatment significantly reduced the density of cells in AC and CC in a dose-dependent manner and that the CC is more sensitive to TH insufficiency than the AC. E and F, Sum of oligodendrocyte and astrocyte densities in the AC (E) and CC (F). Note that the sum of cell densities of oligodendrocytes and astrocytes is not significantly altered with PTU treatment. Bars represent the means ± sem of the number of nuclei per square millimeter (C and D) and sum of MAG-positive cells and GFAP-positive cells (E and F) (n = 6–8/group). *, P < 0.05; **, P < 0.01; ***, P < 0.001 (significantly different from control group using Bonferroni’s t test after a two-way ANOVA).
Treatment effects on the sum of oligodendrocyte and astrocyte density
If TH controls the ratio of oligodendrocytes to astrocytes in white matter tracts by acting on a cell type that serves as precursor to both oligodendrocytes and astrocytes, then the sum of these two glial cell lineages should not be altered with TH insufficiency. Figure 4, E–F, demonstrates that the sum of MAG-positive cells and GFAP-positive cells was unaffected by PTU treatment in the AC and CC (F(3,22) = 0.068, P = 0.6168 and F(3,27) = 1.093, P = 0.3689; AC, CC, respectively).
Correlation between oligodendrocyte and astrocyte density and serum T4
Using linear regression, we analyzed the relationship between serum T4 and oligodendrocyte and astrocyte densities after PTU exposure (Fig. 5, A and B). In the CC, there was a strong correlation (r2 = 0.68) between serum total T4 and MAG-positive cells, and the slope of the relationship significantly deviated from zero (y = 7.324 × −237.3; F(1,28) = 62.37, P < 0.0001; Fig. 5A). GFAP-positive cells in the CC showed a similar relationship with serum total T4 to that of MAG-positive cells except the correlation was slightly less strong (r2 = 0.45). Nonetheless, the slope of the relationship significantly deviated from zero (y = −6.668 × + 1065; F(1,28) = 23.15, P < 0.0001; Fig. 5A). However, in the AC, much weaker correlations were observed for both MAG-positive and GFAP-positive cells (r2 = 0.27 and r2 = 0.33; MAG-positive and GFAP-positive, respectively; Fig. 5B). However, as with CC, the slopes of the relationships remained significantly different from zero (y = 2.681 × +91.06; F(1,23) = 8.452, P = 0.0079 and y = −3.801 × +631.3; F(1,26) = 17.55, P = 0.0015; MAG-positive and GFAP-positive, respectively; Fig. 5B).
Fig. 5.
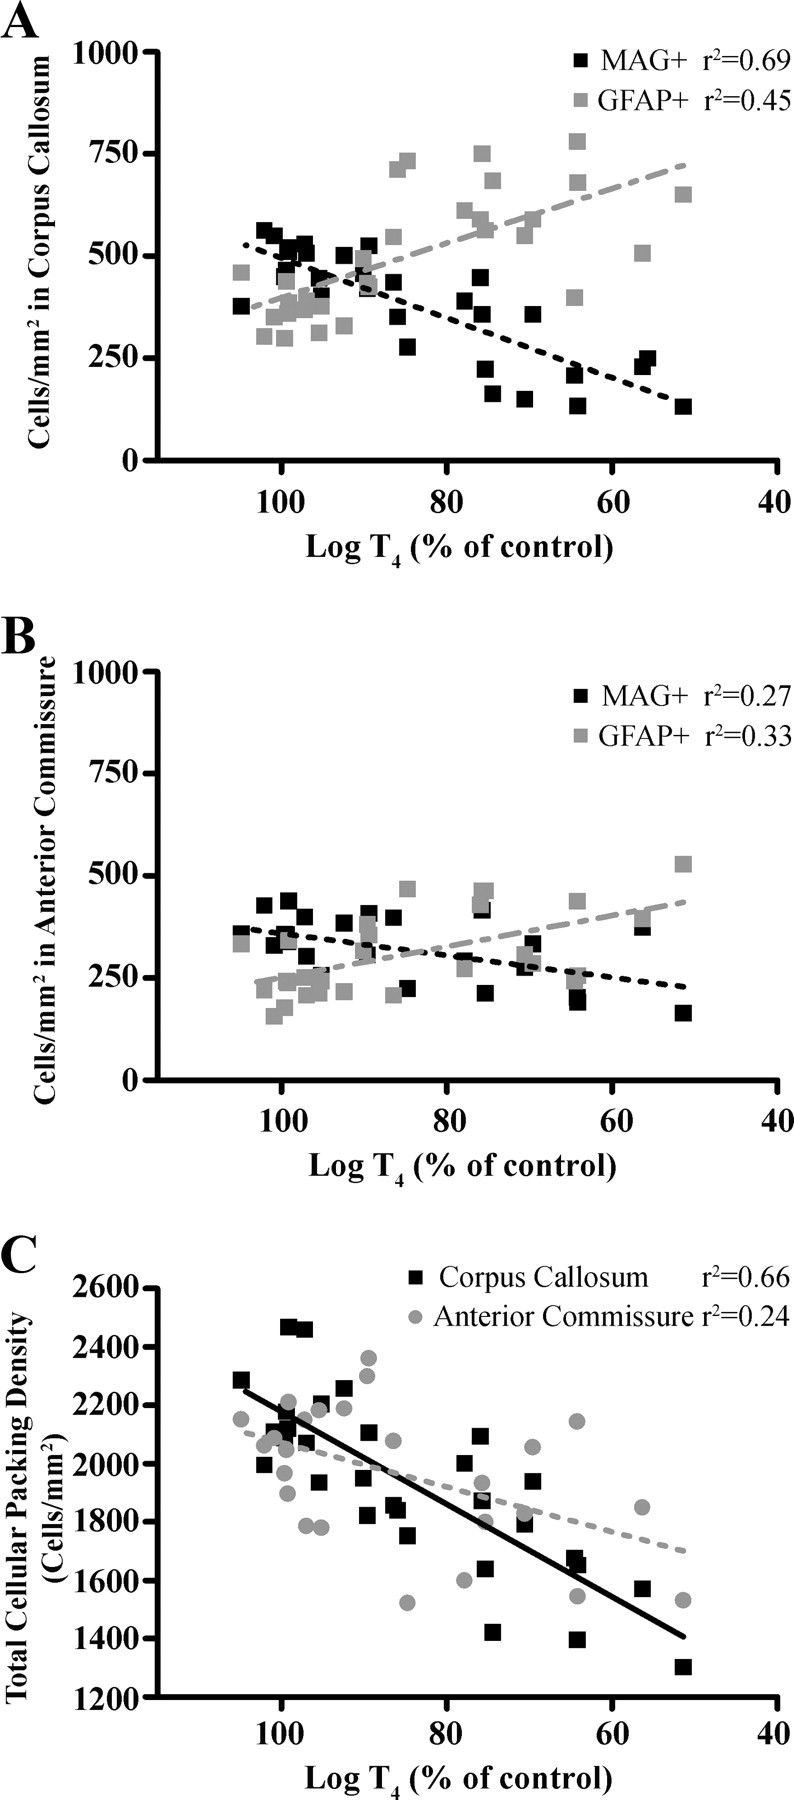
The relationship between changes in total serum log T4 and oligodendrocyte or astrocyte numbers (A and B), and total serum log T4 and total cellular packing density in the AC and CC (C) in P15 pups after developmental PTU exposure. Best fit lines were derived using a linear regression model. Note the strong linear relationship (correlation coefficient, r2) between serum log T4 and a change in cell numbers that occurs in the CC and that this relationship is not as strong in the AC.
Relationship between total cell density and serum T4
Considering the differential sensitivity of the CC and AC to TH insufficiency, we explored the relationship between total cellular packing density measured by DAPI staining and serum T4 (Fig. 5C). Linear regression analysis demonstrated a strong correlation (r2 = 0.66) between serum total T4 and total cellular packing density in the CC, and that the slope of the relationship significantly deviated from zero (F(1,28) = 53.16, P < 0.0001). The correlation was weaker in the AC (r2 = 0.24), but the slope was significantly different from zero (F(1,25) = 7.414, P = 0.0121). Interestingly, the relationship between packing density and serum total T4 (i.e. the slope of the line) was different in the CC than the AC (F(1,51) = 5.52, P = 0.0023).
Discussion
The present findings strongly support the conclusion that TH controls the balance of oligodendrocyte and astrocyte density in the CC and AC and that this balance is quite sensitive to changes in circulating levels of T4. The sum of astrocyte and oligodendrocyte density in the AC and CC was unchanged by circulating level of T4; however, oligodendrocyte density was linearly and positively related to serum T4, and astrocyte density was linearly and negatively related to serum T4. This observation strongly supports the hypothesis that TH acts on a common precursor of oligodendrocytes and astrocytes in white matter, favoring the development of the former at the expense of the later. Linear regression analysis indicated that a 1 μg/dl reduction in total serum T4 will produce a 12% reduction in the density of MAG-positive cells in the CC but only a 6% reduction in the AC. Similarly, a 1 μg/dl reduction in total serum T4 will produce a 12% increase in the density of GFAP-positive astrocytes in the CC but only a 7% increase in the AC, suggesting that the CC is more sensitive to changes in serum total T4 than the AC.
These observations have several important implications about the role of TH in brain development. First, the observation that TH controls the ratio of oligodendrocytes to astrocytes in white matter indicates for the first time that neurological deficits associated with TH insufficiency during development may be due to the combination of decreased oligodendrocyte numbers and concomitant increased astrocyte numbers. Fewer oligodendrocytes will result in decreased myelination which will alter efficient neuronal transmission along axons. An increase in astrocytes during development may alter synapse formation and synaptic transmission; two important astrocyte-regulated events (26, 27). In addition, astrocytes are the major cell type in the brain that express the type II deiodinase, which converts T4 to the more biologically active hormone T3, thereby regulating local tissue TH levels (28, 29). Therefore, an increase in astrocytes may alter local TH levels. However, it is not clear whether white matter astrocytes express the type II deiodinase enzyme (30). Second, as little as a 28% reduction in serum total T4 was sufficient to significantly reduce the cellular density of the corpus callosum; thus, developmental events in the brain are far more sensitive to fluctuations in TH than previously observed. Lastly, the CC and AC exhibited different sensitivities to TH insufficiency; thus, the brain is not uniformly sensitive to TH insufficiency.
Several lines of evidence support the hypothesis that TH acts on a common precursor in the AC and CC to favor oligodendrocyte differentiation at the expense of astrocyte differentiation. First, several in vitro studies demonstrated that TH acts on GRP/O2As. These cells generate both oligodendrocytes and astrocytes in vitro under the direction of TH, which induces cell cycle exit and initiate terminal differentiation in oligodendrocyte precursors (31, 32, 33). Second, studies in vivo using a model of developmental TH insufficiency demonstrate that mature oligodendrocytes are reduced in number in large white matter tracts (14, 15) and mature astrocytes are reciprocally increased (14). However, because previous studies used severe hypothyroidism in vivo, it is possible that the relationship between oligodendrocytes and astrocytes was fortuitous. In contrast, if these two cell types are derived from a common precursor and if this precursor is the site of TH action to regulate the balance of production of oligodendrocytes and astrocytes, then the sum of these two cell types should be the same across all levels of TH. Thus, our observation that the sum of astrocytes and oligodendrocytes remains the same for all levels of serum TH is strong support for the interpretation that TH acts on common precursor to oligodendrocytes and astrocytes.
However, regression analysis also indicated that additional mechanism(s) controlled by TH may contribute to the pattern of white matter development in the CC. Specifically, the slope of the relationship between serum T4 and MAG-positive cell density in the CC was significantly different from that of serum T4 and GFAP-positive cell density. In contrast, the slopes of these relationships were not different in the AC. If the effects on white matter associated with reduced TH were solely due to altered TH action at the GRP/O2A, it would be predicted that the slopes would not be significantly different. Thus, TH may affect more than one developmental event in the CC, e.g. both fate specification of a GRP/O2A precursor cell and postmitotic cell survival. TH is known to be a survival factor for developing oligodendrocytes (34). Therefore, the reduction in MAG-positive cells observed in animals with TH insufficiency may be due to a combination of effects on cell fate and selective cell death in the oligodendrocyte lineage. However, the observation that the sum of oligodendrocytes and astrocytes in the CC is not altered after any degree of TH reduction argues that differences in the slope are not due to cell death in the oligodendrocyte lineage.
An important but unexpected finding was that the strength of the relationship (r2) between serum total T4 and oligodendrocyte number, astrocyte number, and total cell density was greater in the CC than the AC. These observations indicate that the CC is more sensitive to changes in T4 than in the AC. Furthermore, this observation suggests that that neuropsychological tasks that rely on proper myelination of the CC [e.g. response inhibition (35)] may be more sensitive to changes in TH than those that rely on the AC.
One possible explanation for this difference is that the proportion of TH-sensitive GRP/O2A precursors may differ between the two brain regions. The density of oligodendrocytes in the CC was slightly higher than that of the AC (about 500/mm2 in the CC, compared with about 380/mm2 in the AC) but declined to about 200/mm2 in both regions. Moreover, the density of astrocytes in the CC was also slightly higher than in the AC (400/mm2 in the CC, compared with about 250/mm2 in the AC) and increased to about 600/mm2 in the CC and 400/mm2 in the AC. Thus, proportional changes in the numbers of oligodendrocytes and astrocytes in response to changes in serum T4 may be attributable to the proportion of TH-sensitive precursors in these two regions.
Differences in the sensitivity of oligodendrocyte numbers in the CC and AC to TH may also be related to the different origins of oligodendrocytes in these two brain regions. Specifically, Kessaris et al. (20) demonstrated using a Cre-lox genetic fate mapping approach that the first forebrain oligodendrocyte progenitors originate from the medial ganglionic eminence and anterior entopeduncular area of the ventral forebrain during midembryonic development. They migrate from these points of origin to populate the entire embryonic telencephalon, including the AC and CC. These pioneering progenitors are then joined by a second wave of oligodendrocyte progenitors from the lateral/caudal ganglionic eminences. Finally, a third, postnatal wave arises directly from within the cortex. However, in the adult CC, the early pioneering oligodendrocytes are eliminated, and the postnatal wave is maintained. In contrast, in the ventrally located AC, the early progenitors persist (20). If these two populations of oligodendrocyte progenitors are differentially sensitive to TH insufficiency or if the reduction in TH is greater postnatally by PTU treatment, thereby preferentially affecting the development of the postnatal wave, these two brain regions could exhibit different sensitivities to TH. Moreover, because the timing of these waves differs, it suggests that the differential sensitivity of the CC and AC to TH insufficiency may relate to the timing of the analysis.
It is worth noting that we observed an overall decrease in cellular packing density independent of changes in MAG-positive and GFAP-positive cells. Although it is not immediately clear what the nature of these lost cells are, MAG- and GFAP-positive cells can account for only roughly 50% of the cellular composition of the AC or CC on P15. This reduction may be due, in part, to the loss of microglia in white matter induced by TH insufficiency (36) and/or due to a reduction in the number MAG-negative or GFAP-negative cells not quantified in the present study (14). Interestingly, total cellular packing density in the CC was the most sensitive biomarker of TH insufficiency. Our lowest dose of PTU (1 ppm per 0.0001%) reduced total serum T4 by 28.5%, significantly reducing cellular packing density in the CC. This was the only end point in the present study that was significantly affected at 1 ppm PTU. This observation clearly demonstrates that cellular packing density in the CC is extremely sensitive to perturbations in TH during brain development and more sensitive than other reported TH-mediated developmental events such as hearing (37).
Finally, it is important to recognize that the present observations were made in animals exposed to very low concentrations of PTU, compared with other studies. For example, we previously used 0.1% methimazole in combination with perchlorate to produce severe hypothyroidism (14). The current dose of PTU is 1000 times less than this. In addition, body weight was unaffected in these animals. Thus, this low dose of PTU may more accurately represent a model of TH insufficiency observed in CH children with inadequate treatment or pregnant women with subclinical hypothyroidism. Despite the lack of effects of PTU treatment on pup body weight, serum thyroid hormones remained significantly reduced in the pups and dams (data not shown). In addition, serum TSH was elevated in the dams (data not shown), indicating that pups were exposed to TH insufficiency both before and after birth.
In conclusion, the current data support the hypothesis that at least some proportion of oligodendrocytes and astrocytes are derived from a common precursor that is sensitive to TH in the CC and AC. In addition, CC oligodendrocytes are more sensitive to TH insufficiency than those in the AC. The implications of this latter finding are important in that specific cognitive deficits may be more sensitive to TH insufficiency than others, thus providing insight in to the neurological and behavioral deficits measured in children born with or to mothers with thyroid dysfunction (8).
Acknowledgments
The authors thank W. Anderson for help with animal experiments. The authors also thank R. Bansal for her technical help and critically reading the manuscript.
Footnotes
Current address for D.S.S.: National Institutes of Health, The National Institute of Diabetes and Digestive and Kidney Diseases, Bethesda, Maryland.
This work was supported in part by U.S. Environmental Protection Agency Science to Achieve Results (STAR) Grant RD-3213701-0 (to R.T.Z.) and a U.S. Environmental Protection Agency STAR predoctoral fellowship STAR FP916424 (to D.S.S.).
This document has been subjected to review by the National Health and Environmental Effects Research Laboratory and approved for publication. Approval does not signify that the contents reflect the views of the agency, nor does mention of trade names or commercial products constitute endorsement or recommendation for use.
Disclosure Statement: The authors have nothing to declare.
First Published Online February 14, 2008
Abbreviations: AC, Anterior commissure; CC, corpus callosum; CH, congenital hypothyroidism; DAPI, 4′,6-diamidino-2-phenylindole; G, gestational day; GFAP, glial fibrillary acidic protein; GRP, glial-restricted precursor; MAG, myelin-associated glycoprotein; O2A, oligodendrocyte type II astrocyte; P, postnatal day; PTU, propylthiouracil; TH, thyroid hormone.
References
- 1.Zoeller RT, Tan SW, Tyl RW 2007. General background on the hypothalamic-pituitary-thyroid (HPT) axis. Crit Rev Toxicol 37:11–53 [DOI] [PubMed] [Google Scholar]
- 2.Brosco JP, Seider MI, Dunn AC 2006. Universal newborn screening and adverse medical outcomes: a historical note. Ment Retard Dev Disabil Res Rev 12:262–269 [DOI] [PubMed] [Google Scholar]
- 3.Oerbeck B, Reinvang I, Sundet K, Heyerdahl S 2007. Young adults with severe congenital hypothyroidism: cognitive event related potentials (ERPs) and the significance of an early start of thyroxine treatment. Scand J Psychol 48:61–67 [DOI] [PubMed] [Google Scholar]
- 4.Kempers MJ, van der Sluijs Veer L, Nijhuis-van der Sanden MW, Kooistra L, Wiedijk BM, Faber I, Last BF, de Vijlder JJ, Grootenhuis MA, Vulsma T 2006. Intellectual and motor development of young adults with congenital hypothyroidism diagnosed by neonatal screening. J Clin Endocrinol Metab 91:418–424 [DOI] [PubMed] [Google Scholar]
- 5.Hepworth SL, Pang EW, Rovet JF 2006. Word and face recognition in children with congenital hypothyroidism: an event-related potential study. J Clin Exp Neuropsychol 28:509–527 [DOI] [PubMed] [Google Scholar]
- 6.Selva KA, Harper A, Downs A, Blasco PA, Lafranchi SH 2005. Neurodevelopmental outcomes in congenital hypothyroidism: comparison of initial T4 dose and time to reach target T4 and TSH. J Pediatr 147:775–780 [DOI] [PubMed] [Google Scholar]
- 7.Bongers-Schokking JJ 2001. Pre- and postnatal brain development in neonates with congenital hypothyroidism. J Pediatr Endocrinol Metab 14:1463–1468 [PubMed] [Google Scholar]
- 8.Zoeller RT, Rovet J 2004. Timing of thyroid hormone action in the developing brain: clinical observations and experimental findings. J Neuroendocrinol 16:809–818 [DOI] [PubMed] [Google Scholar]
- 9.Rodriguez-Pena A 1999. Oligodendrocyte development and thyroid hormone. J Neurobiol 40:497–512 [DOI] [PubMed] [Google Scholar]
- 10.Bernal J 2005. Thyroid hormones and brain development. Vitam Horm 71:95–122 [DOI] [PubMed] [Google Scholar]
- 11.Annunziata P, Federico A, D’Amore I, Corona RM, Guazzi GC 1983. Impairment of human brain development: glycoconjugate and lipid changes in congenital athyroidism. Early Hum Dev 8:269–278 [DOI] [PubMed] [Google Scholar]
- 12.Jagannathan NR, Tandon N, Raghunathan P, Kochupillai N 1998. Reversal of abnormalities of myelination by thyroxine therapy in congenital hypothyroidism: localized in vivo proton magnetic resonance spectroscopy (MRS) study. Brain Res Dev Brain Res 109:179–186 [DOI] [PubMed] [Google Scholar]
- 13.Rovet J, Daneman D 2003. Congenital hypothyroidism: a review of current diagnostic and treatment practices in relation to neuropsychologic outcome. Paediatr Drugs 5:141–149 [DOI] [PubMed] [Google Scholar]
- 14.Sharlin DS, Bansal R, Zoeller RT 2006. Polychlorinated biphenyls exert selective effects on cellular composition of white matter in a manner inconsistent with thyroid hormone insufficiency. Endocrinology 147:846–858 [DOI] [PubMed] [Google Scholar]
- 15.Schoonover CM, Seibel MM, Jolson DM, Stack MJ, Rahman RJ, Jones SA, Mariash CN, Anderson GW 2004. Thyroid hormone regulates oligodendrocyte accumulation in developing rat brain white matter tracts. Endocrinology 145:5013–5020 [DOI] [PubMed] [Google Scholar]
- 16.Gravel C, Sasseville R, Hawkes R 1990. Maturation of the corpus callosum of the rat: II: Influence of thyroid hormones on the number and maturation of axons. J Comp Neurol 291:147–161 [DOI] [PubMed] [Google Scholar]
- 17.Berbel P, Guadano-Ferraz A, Angulo A, Ramon Cerezo J 1994. Role of thyroid hormones in the maturation of interhemispheric connections in rats. Behav Brain Res 64:9–14 [DOI] [PubMed] [Google Scholar]
- 18.Noble M, Proschel C, Mayer-Proschel M 2004. Getting a GR(i)P on oligodendrocyte development. Dev Biol 265:33–52 [DOI] [PubMed] [Google Scholar]
- 19.Petryniak MA, Potter GB, Rowitch DH, Rubenstein JL 2007. Dlx1 and Dlx2 control neuronal versus oligodendroglial cell fate acquisition in the developing forebrain. Neuron 55:417–433 [DOI] [PMC free article] [PubMed] [Google Scholar]
- 20.Kessaris N, Fogarty M, Iannarelli P, Grist M, Wegner M, Richardson WD 2006. Competing waves of oligodendrocytes in the forebrain and postnatal elimination of an embryonic lineage. Nat Neurosci 9:173–179 [DOI] [PMC free article] [PubMed] [Google Scholar]
- 21.Paxinos G, Watson C 1986. The rat brain in stereotaxic coordinates. 2nd ed. San Diego: Academic Press
- 22.Zoeller RT, Butnariu OV, Fletcher DL, Riley EP 1994. Limited postnatal ethanol exposure permanently alters the expression of mRNAs encoding myelin basic protein and myelin-associated glycoprotein in cerebellum. Alcohol Clin Exp Res 18:909–916 [DOI] [PubMed] [Google Scholar]
- 23.Zoeller RT, Fletcher DL, Butnariu O, Lowry C, Moore FL 1997. N-ethylmaleimide (NEM) can significantly improve in situ hybridization results using 35S-labeled oligodeoxynucleotide or complementary RNA probes. J Histochem Cytochem 45:1035–1041 [DOI] [PubMed] [Google Scholar]
- 24.Rogers AW 1979. Techniques of autoradiography. Amsterdam: Elsevier/North Holland
- 25.Petersen SL, McCrone S, Keller M, Shores S 1995. Effects of estrogen and progesterone on luteinizing hormone-releasing hormone messenger ribonucleic acid levels: consideration of temporal and neuroanatomical variables. Endocrinology 136:3604–3610 [DOI] [PubMed] [Google Scholar]
- 26.Fields RD, Stevens-Graham B 2002. New insights into neuron-glia communication. Science 298:556–562 [DOI] [PMC free article] [PubMed] [Google Scholar]
- 27.He F, Sun YE 2007. Glial cells more than support cells? Int J Biochem Cell Biol 39:661–665 [DOI] [PubMed] [Google Scholar]
- 28.Kester MH, Martinez de Mena R, Obregon MJ, Marinkovic D, Howatson A, Visser TJ, Hume R, Morreale de Escobar G 2004. Iodothyronine levels in the human developing brain: major regulatory roles of iodothyronine deiodinases in different areas. J Clin Endocrinol Metab 89:3117–3128 [DOI] [PubMed] [Google Scholar]
- 29.Guadano-Ferraz A, Obregon MJ, St Germain DL, Bernal J 1997. The type 2 iodothyronine deiodinase is expressed primarily in glial cells in the neonatal rat brain. Proc Natl Acad Sci USA 94:10391–10396 [DOI] [PMC free article] [PubMed] [Google Scholar]
- 30.Guadano-Ferraz A, Obregón MJ, St Germain DL, Bernal J 1997. The type 2 iodothyronine deiodinase is expressed primarily in glial cells in the neonatal rat brain. Proc Natl Acad Sci USA 94:10391–10396 [DOI] [PMC free article] [PubMed] [Google Scholar]
- 31.Barres BA, Lazar MA, Raff MC 1994. A novel role for thyroid hormone, glucocorticoids and retinoic acid in timing oligodendrocyte development. Development 120:1097–1108 [DOI] [PubMed] [Google Scholar]
- 32.Durand B, Fero ML, Roberts JM, Raff MC 1998. p27Kip1 alters the response of cells to mitogen and is part of a cell-intrinsic timer that arrests the cell cycle and initiates differentiation. Curr Biol 8:431–440 [DOI] [PubMed] [Google Scholar]
- 33.Durand B, Raff M 2000. A cell-intrinsic timer that operates during oligodendrocyte development. Bioessays 22:64–71 [DOI] [PubMed] [Google Scholar]
- 34.Jones SA, Jolson DM, Cuta KK, Mariash CN, Anderson GW 2003. Triiodothyronine is a survival factor for developing oligodendrocytes. Mol Cell Endocrinol 199:49–60 [DOI] [PubMed] [Google Scholar]
- 35.Stewart P, Fitzgerald S, Reihman J, Gump B, Lonky E, Darvill T, Pagano J, Hauser P 2003. Prenatal PCB exposure, the corpus callosum, and response inhibition. Environ Health Perspect 111:1670–1677 [DOI] [PMC free article] [PubMed] [Google Scholar]
- 36.Lima FR, Gervais A, Colin C, Izembart M, Neto VM, Mallat M 2001. Regulation of microglial development: a novel role for thyroid hormone. J Neurosci 21:2028–2038 [DOI] [PMC free article] [PubMed] [Google Scholar]
- 37.Zoeller RT, Crofton KM 2005. Mode of action: developmental thyroid hormone insufficiency—neurological abnormalities resulting from exposure to propylthiouracil. Crit Rev Toxicol 35:771–781 [DOI] [PubMed] [Google Scholar]
- 38.Raff MC, Miller RH, Noble M 1983. A glial progenitor cell that develops in vitro into an astrocyte or an oligodendrocyte depending on culture medium. Nature 303:390–396 [DOI] [PubMed] [Google Scholar]
- 39.Murray K, Dubois-Dalcq M 1997. Emergence of oligodendrocytes from human neural spheres. J Neurosci Res 50:146–156 [DOI] [PubMed] [Google Scholar]
- 40.Johe KK, Hazel TG, Muller T, Dugich-Djordjevic MM, McKay RD 1996. Single factors direct the differentiation of stem cells from the fetal and adult central nervous system. Genes Dev 10:3129–3140 [DOI] [PubMed] [Google Scholar]