

Abstract
Dysregulation of blood glucose and triglycerides are the major characteristics of type 2 diabetes mellitus. We sought to identify the mechanisms regulating blood glucose and lipid homeostasis. Cell-based studies established that the Foxo forkhead transcription factors Forkhead box O (Foxo)-1, Foxo3, and Foxo4 are inactivated by insulin via a phosphatidylinositol 3-kinase/Akt-dependent pathway, but the role of Foxo transcription factors in the liver in regulating nutrient metabolism is incompletely understood. In this study, we used the Cre/LoxP genetic approach to delete the Foxo1, Foxo3, and Foxo4 genes individually or a combination of two or all in the liver of lean or db/db mice and assessed the role of Foxo inactivation in regulating glucose and lipid homeostasis in vivo. In the lean mice or db/db mice, hepatic deletion of Foxo1, rather than Foxo3 or Foxo4, caused a modest reduction in blood glucose concentrations and barely affected lipid homeostasis. Combined deletion of Foxo1 and Foxo3 decreased blood glucose levels, elevated serum triglyceride and cholesterol concentrations, and increased hepatic lipid secretion and caused hepatosteatosis. Analysis of the liver transcripts established a prominent role of Foxo1 in regulating gene expression of gluconeogenic enzymes and Foxo3 in the expression of lipogenic enzymes. Our findings indicate that Foxo1 and Foxo3 inactivation serves as a potential mechanism by which insulin reduces hepatic glucose production and increases hepatic lipid synthesis and secretion in healthy and diabetic states.
Blood glucose and lipid homeostasis is tightly regulated by fuel hormones, such as insulin, which triggers the intracellular protein kinases and activates or inactivates the hormone-responsive gene transcriptional profiles that integrate to the metabolic pathways and maintain a steady level of blood glucose and lipids. In response to insulin, the liver plays a central role in suppressing hepatic glucose production and promoting lipid synthesis (1). In mice, blocking insulin action by deleting hepatic insulin receptor or both the insulin receptor substrate-1 (Irs1) and insulin receptor substrate-2 (Irs2) genes prevents the effect of insulin upon activating the phosphatidylinositol 3-kinase → protein kinase B (Akt) cascade in the liver, elevates blood glucose levels, and lowers blood lipid concentrations (2, 3). Activation of Akt plays an important role in glucose homeostasis and its mutation is involved in type 2 diabetes mellitus in humans and mice (4, 5). Targets of Akt include glycogen synthase kinase 3, mammalian target of rapamycin, sterol regulatory element-binding protein 1c, and Forkhead box O1 (Foxo1) transcription factors that contribute to the synthesis of glycogen, protein, lipids, and glucose, respectively (1). Foxo1 has recently received attention for its role in metabolic regulation (6).
Our early discoveries demonstrated that Foxo1, a member of the Foxo subfamily of forkhead winged/helix transcription factors, serves as a target of Akt in the insulin signaling cascade regulating gene expression of IGF-binding protein-1 (Igfbp1), glucose-6-phosphatase (G6pc), and phosphoenolpyruvate carboxykinase (Pck1) in hepatocytes (7–9). G6pc and Pck are the rate-limiting enzymes regulating gluconeogenesis and hepatic glucose production. Akt activation inhibits Foxo1 by phosphorylating serine/threonine residues at T24, S256, and S319 (7, 10), corresponding sites are also found in other Foxo members including Foxo3 and Foxo4 (11, 12). Phosphorylation of these residues enhances Foxo1 interaction with E3 ubiquitin ligase for Foxo1 degradation (7, 13–15). Importantly, because Foxo1 interacts with an insulin-responsive element (IRE) on the promoter region(s) of Igfbp1, G6pc, and Pck to promote hepatic gene expression, it is speculated that Foxo1 is a major mediator of insulin action in the control of a set of insulin-responsive genes and nutrient homeostasis (7). In fact, mice lacking the Foxo1 gene in the liver displayed reduced gluconeogenic gene expression, improved glucose tolerance, and reduced hepatic glucose production (16). Moreover, heploinsufficiency or hepatic expression of dominant negative Foxo1 in mice or hepatic Foxo1 deletion in mice lacking both the Irs1 and Irs2 genes reduces gluconeogenic gene expression and rescues diabetic phenotype of insulin resistance (17–19), suggesting that targeting hepatic insulin→Akt→Foxo1 signaling cascade provides a strategy to prevent the progression of diabetes mellitus.
Members of Foxo proteins, Foxo1, Foxo3, and Foxo4, contain conserved Akt phosphorylation sites; share a target consensus sequence similar to the IRE; and govern a variety of cellular processes including development, survival, and metabolism (20). Some functions of each member appear to be unique. For example, Foxo1-null mice are embryo lethal and Foxo3- and Foxo4-null mice are viable (21). Recently it has been shown that Foxo proteins synergistically promote hepatic glucose production (22), but their role in the control of lipid homeostasis is unclear.
In this study, we used genetic approaches to assess the role of hepatic Foxo1, Foxo3, and Foxo4 in regulating glucose and lipid homeostasis in mice and demonstrated that Foxo1 and Foxo3 differentially regulated glucose and lipid metabolism genes and that inactivation of both genes decreased hepatic glucose production and increased lipid synthesis and secretion in the lean and diabetic db/db mice.
Materials and Methods
Animals
Generation of mice with floxed (flanked by loxP) Foxo1, Foxo3, and Foxo4 has been described previously (23). To generate the liver-specific Foxo knockout mice, floxed Foxo1, Foxo3, or Foxo4 mice were crossed with Alb-Cre transgenic mice that express the Cre recombinase cDNA under the rat albumin promoter (3, 24). All mice were then backcrossed with C57BL/6J for four generations to achieve 93.75% C57BL6/J background with 6.25% 129/Sv background and fed with regular chow (Prolab isopro 5P76; Pittsburgh, PA). Diabetic db/db mice were resultant from db/+ breeding pair (C57BKS.Cg-m Leprdb/J, The Jackson laboratory, Bar harbor, ME), and db/db::Foxo knockout mice were generated by crossing db/+ mice with liver-specific Foxo1 knockout (F1KO), Foxo3 knockout (F3KO), or both Foxo1 and Foxo3 (F1/3KO) mice. All mice were housed in cages on a 12-h light, 12-h dark photocycle with free access to water and normal chow. If not specified elsewhere, the control and knockout mice were all male at the age of 8–12 wk. All animal experiments were performed according to procedures approved by the Texas A&M Health Science Center and Children's Hospital Boston Institutional Animal Care and Use Committee.
Blood chemistry and metabolic analysis
Serum samples were collected from mice that were 18 h overnight fasting or random-fed ad libitum and analyzed for insulin (Crystal Chem Inc., Chicago, IL), free fatty acid, triglyceride, cholesterol, and ketone body (Wako, Richmond, CA) using commercial kits. Serum albumin levels were assessed using BCG reagent, and alkaline phosphatase activities were measured using QuantiChrom alkaline phosphatase assay kit-DALP-250 (Bioassay System, Hayward, CA). Blood glucose levels were measured using a portable glucometer (Bayer, Indianapolis, IN). For glucose tolerance tests, mice were fasted overnight and injected with 2 g/kg body weight d-glucose ip, as previously described (3). For insulin tolerance tests, random-fed mice were injected ip with 1 U/kg body weight of human insulin (Eli Lilly, Indianapolis, IN), and blood glucose levels were measured at the indicated time points. Bone mineral density and fat accumulation were determined using dual-energy x-ray absorptiometry with a Lunar PIXImus II mouse densitometer (GE LUNAR Corp., Madison, WI).
For very low-density lipoprotein (VLDL) triglyceride secretion analysis, mice were fasted for 5 h during daytime and injected 500 mg/kg body weight tyloxapol (Sigma, St. Louis, MO) via tail vein, as previously described (17). Blood samples were collected at 0, 30, 60, 90, and 120 min after injections and then analyzed for triglyceride concentrations.
Lipid determination and fatty acid analysis
The lipids from plasma were extracted in the presence of authentic internal standards by the method of Folch et al. (25). Two hundred microliters of plasma of classes within the extract were separated by preparative thin-layer chromatography, as previously described (26).
Liver glycogen and lipid assay
Liver glycogen, triglyceride, and cholesterol concentrations were analyzed as previously described (3, 17, 27).
Histological analysis
Liver tissue was fixed in 10% formaldehyde for hematoxylin and eosin (H&E) staining and periodic acid-Shiff (PAS) staining. Frozen liver tissue was used for oil red O staining to evaluate hepatic lipid content.
Mouse primary hepatocyte isolation and cell culture
Primary mouse hepatocytes were isolated from 8- to 12-wk-old mice via collagenase (0.05% collagenase type 1; Worthington, Lakewood, NJ) digestion and Percoll (Amersham Biosciences AB, Piscataway, NJ) gradient purification and cultured in collagen-coated plates. Freshly isolated hepatocytes were resuspended in DMEM/25 mm glucose supplemented with 10% fetal bovine serum and antibiotics for 4 h; after cell attachment, hepatocytes were cultured in serum-free medium DMEM/25 mm glucose overnight and then treated with or without 100 nm insulin for further analysis.
Western blotting
Serum were collected, resolved by SDS-PAGE, and transferred to nitrocellulose membrane for immunoblotting analysis using apolipoprotein (Apo) B-100 antibody (BioDesign International, Saco, ME). Protein lysates extracted from liver or primary hepatocytes were used to detect protein expression level of Foxo1, Foxo3, Foxo4, and β-actin. Antibodies against each were purchased from Cell Signaling Technology (Danvers, MA), and the immunoblotting protocol was previously described (28).
Affymetrix GeneChip analysis
Liver mRNA expression in control, F1KO, F3KO, and F1/3KO mice fasted for 18 h (n = 2/group) was determined on MG430 2.0 GeneChips (Affymetrix, Santa Clara, CA). A total of eight fasted mice were used. Total RNA was isolated from the liver tissues using Trizol (Invitrogen, Grand Islands, NY), and 15 μg of each RNA sample was used for labeling and hybridization which was performed at the Harvard Medical School Children's Hospital Boston Genetic Core Facility. Affymetrix microarray Suite 5.0 was used to generate cell intensity files that were analyzed by robust multichip average analysis in planted in GeneSpring 7.2 (Agilent Technologies, Santa Clara, CA) and further analyzed by dChip software (http://biosun1.harvard.edu/complab/dchip).
Mammalian cell culture and gene transfection of Foxo1 and Foxo3 in vitro
To assess whether Foxo gene expression regulates hepatic gene expression in vitro, we cultured HepG2 cells from American Type Culture Collection (Manassas, VA) in 12-well plates in DMEM/5.5 mm glucose medium supplemented with 10% fetal bovine serum, 100 U/ml penicillin, and 100 μg/ml streptomycin for 4 h. After cell attachment, cells were transfected with plasmid DNA expressing green fluorescent protein (GFP), or human Foxo1, or human Foxo3 using TransIT-293 transfection reagent (Mirus, Madison, WI), as we previously described (7, 29). After 6 h of gene transfection, cells were cultured in in serum-free medium DMEM/5.5 mm glucose overnight and then treated with 30 mm high glucose for 24 h, a condition that promotes lipid synthesis in cells (30, 31). Then RNA was extracted from cells and measured by real-time PCR for relative expression of gene of interest.
Real-time PCR
One microgram of total RNA were reverse transcribed with random hexamer primers (Bio-Rad Laboratories, Hercules, CA). The relative mRNA abundance levels normalized to cyclophilin levels were determined with the threshold cycle method after amplification, using an iCycler IQ real-time PCR detection system with SYBER green (Bio-Rad Laboratories). Data are presented as means ± sem. The procedure was essentially same as previously described (28). The PCR primer sequences used for mouse tissue or cell are the following: cyclophilin, 5′-ctaaagcatacaggtcctggcatcttg-3′, and 5′-tgccatccagccattcagtcttg-3′; Foxo1, 5′-agatgagtgccctgggcagc-3′ and 5′-gatggactccatgtcacagt-3′; Foxo3, 5′-ctctcaggctcctcactgta-3′ and 5′-atgagttcactacggatgat-3′; Foxo4, 5′-cccaaccttctgtgatggc-3′ and 5′-tacatatcaagatccagatc-3′; FoxA2, 5′-ccgagcaccattacgccttc-3′ and 5′-tgggtagtgcatgacctgtt-3′; Pck1, 5′-ccatcggctacatccctaag-3′ and 5′-gacctggtcctccagatacc-3′; G6pc, 5′-cattgtggcttccttggtcc-3′ and 5′-ggcagtatgggataagactg-3′; Igfbp-1, 5′-cgccatcagcacctatagca-3′ and 5′-tgtagatttcatctcctgct-3′; peroxisome proliferator activated receptor gamma coactivator 1α (Pgc1α), 5′-ctaccgttacacctgtgacg-3′ and 5′-agttggtatctaggtctgca-3′; Irs1, 5′-cccgttcggtgccaaatagc-3′ and 5′-gccactggtgaggtatccacatagc-3′; Irs2, 5′-acttcccagggtcccactgctg-3′ and 5′-ggctttggaggtgccacgatag-3′; glucokinase (Gck), 5′-ccttcgaccctctgtcgccg-3′ and 5′-gcatcacgtcctcactgcgg-3′; fatty acid synthase (Fasn), 5′-atggcgaggacttgggtgct-3′ and 5′-ggagctatggatgatgttga-3′; 3-hydroxy-3-methylglutaryl-CoA reductase (Hmgcr), 5′-caagcctgcctgcagatgct-3′ and 5′-tgtcctgctgccaaggctgc-3′. The PCR primer sequences used for human HepG2 cells are the following: H-Foxo1, 5′-ctcccatacccaccctg-3′ and 5′-cttggtcaggcggttc-3′; H-Foxo3, 5′-ttcagtaagcaagccgtgca-3′ and 5′-tatccagcaggtcgtccatg-3′; H-Pck1, 5′-ctggcttagcatggcccagc-3′ and 5′-ccatcgatccggttgaacat-3′; H-G6pc, 5′-tcctcaagaacctgggcacg-3′ and 5′-ctacaatagagctgaggcgg-3′; H-Fasn, 5′-agcggctctgagacctcgga-3′ and 5′-gcaggctgtgtccagtgcga-3′; H-Hmgcr, 5′-atctgcatgatgtccatgaa-3′ and 5′-tacaggatggctatgcatcg-3′.
Statistical analysis
All results are presented as mean ± sem determined by two-tailed Student's t tests or one-way ANOVA. Paris comparisons of the means were made, and P < 0.05 was taken as a significant difference. The Bonferroni method was used to adjust the observed significance levels for the fact the multiple contrasts were being tested. Serial measurements made during glucose and insulin tolerance tests were summarized by determining the area under curve using Medcalc version 10.0 (http://www.medcalc.org), as previously described (3).
Results
Gene expression of Foxo1 and Foxo3 in the liver of mice and generation of Foxo-liver specific knockout mice
We first examined the relative expression levels of each Foxo isoform in the liver of mice by real-time PCR in comparison with another forkhead gene, FoxA2 (known as hepatocyte nuclear factor-3β). The expression levels of Foxo1 and Foxo3 are almost equally abundantly expressed in adult liver, almost 2-fold higher than that of FoxA2, whereas expression of Foxo4 is much less than Foxo1 and Foxo3 and reached only a half abundance of the FoxA2 mRNA level (Fig. 1A).
Fig. 1.

Relative expression levels of Foxo genes in the liver of mice and mice lacking Foxo1, Foxo3, and Foxo4. A, The liver of random-fed C57/BL6 at the age of 10 wk was collected and RNA was analyzed by real-time PCR. Values are relative to FoxA2 gene RNA (mean ± sem). *, P < 0.01 (n = 3). B, Genotyping of Cre, floxed Foxo alleles by PCR. Integration of Cre or insertion of 34 bp of loxp sites in Foxo1 and Foxo3 alleles caused an up-shift of the PCR product in 2% agarose gel and stained with ethidium bromide. The sizes of PCR products are indicated. L/L, Loxp homozygous; +/+, wild-type alleles; M, 100 bp DNA ladder. PCR primers 5′-gcttacagcagagatgttctcacatt, 5′-ccagagtctttgtatcaggcaaataa, and 5′-caagtccattaattcagcacattga are for Foxo1; 5′-attcctttggaaatcaacaaaactg, 5′-tgctttgatactattccacaaaccc, and 5′-agatttatgttcccacttgcttcct are for Foxo3; 5′-gctttcttagtgaaggatgggaaa, 5′-attccttcccttttcacccact, and 5′ cttctctgtgggaataaatgtttgg for Foxo4; 5′-agatgttcggcgattatcttc and 5′-ccagtgaaacagcattgctg are for Cre; NS, Nonspecific band. C–E, Protein content of Foxo1, Foxo3, and Foxo4 analyzed by specific immunoblotting of liver lysates extracted from 10-wk-old control (CNTR), F1KO, F3KO, or F4KO mice (n = 2 mice/group). F–H, Relative expression levels of Foxo1, Foxo3, and Foxo4 in the mutant mice. The liver of random-fed F1KO, F3KO, F4KO, F1/3KO, F1/4KO, F3/4KO, and F1/3/4KO mice at the age of 10–12 wk was collected and Foxo mRNA was analyzed by real-time PCR. Values are relative to the liver of control mice. *, P < 0.01 vs. control (n = 3/group).
Next, we used the Cre/loxP genetic approaches to generate mice lacking hepatic Foxo1 (F1KO mice), Foxo3 (F3KO mice), and Foxo4 (F4KO mice). Breeding the singular Foxo knockout mice with each other, we generated double- and triple-Foxo knockout mice: F1/3KO, F1/4KO, F3/4KO, or F1/3/4KO mice in which two Foxo genes or all three Foxo1, Foxo3, and Foxo4 genes were deleted in the liver of mice. All of the mice were born in the expected Mendelian ratios and appeared healthy. The Foxo1L/L::Foxo3L/L:: Foxo4L/L (LoxP mice) or CreAlb mice were used as control (CNTR mice). Mouse tail DNA was extracted for genotyping by PCR (Fig. 1B). Absence of Foxo1, Foxo3, or Foxo4 protein was achieved in the liver of F1KO, F3KO, or F4KO mice, respectively (Fig. 1, C–E). Relative expression level of Foxo1, Foxo3, and Foxo4 mRNA in the liver of F1KO, F3KO, and F4KO was reduced by at least 95% compared with that of control liver, respectively (Fig. 1, F–H). Moreover, the relative expression level of Foxo1, Foxo3, or Foxo4 in the liver of F3/4KO, F1/4KO, and F1/3KO mice, respectively, was not significantly changed compared with that of control liver (Fig. 1, F–H).
Hepatic Foxo inactivation differentially regulates blood glucose homeostasis
At 10 wk of age, F1KO mice reduced fasting blood glucose concentrations by 20% and feeding blood glucose level by 15%, compared with control mice, whereas F3KO and F4KO mice had no significant changes (Fig. 2, A and B). F1/3KO mice further reduced fasting blood glucose concentrations by 40% and feeding blood glucose levels by 20%, equivalent to the reduction observed in F1/3/4KO mice compared with control mice. F1/4KO mice were similar to F1KO mice, whereas F3/4KO mice had no changes in blood glucose concentrations (Fig. 2, A and B). Therefore, inactivation of Foxo4 had no effect on glucose homeostasis and had no additive effect with Foxo1 and Foxo3 inactivation. We then focused on the F1KO, F3KO, and F1/3KO mice for further investigations. In the glucose tolerance tests, F3KO mice displayed normal glucose tolerance after ip injection of glucose, whereas F1KO and F1/3KO mice showed reduced glucose levels during a period of 2 h after glucose administration (Fig. 2C). F1/3KO mice exhibited slightly greater glucose tolerance than F1KO mice, though statistically indistinguishable as determined by area under the curve (Fig. 2D). Thus, Foxo3 inactivation alone had a minimal impact and had a synergistic effect with Foxo1 inactivation on lowering blood glucose concentrations. In the insulin tolerance tests, F1KO, F3KO, and F1/3KO mice did not prevent the ability of insulin to lower the blood glucose concentration, suggesting that insulin sensitivity was maintained in all the mutant mice and the area under the curve measures did not show a significant difference among each group (Fig. 2, E and F).
Fig. 2.
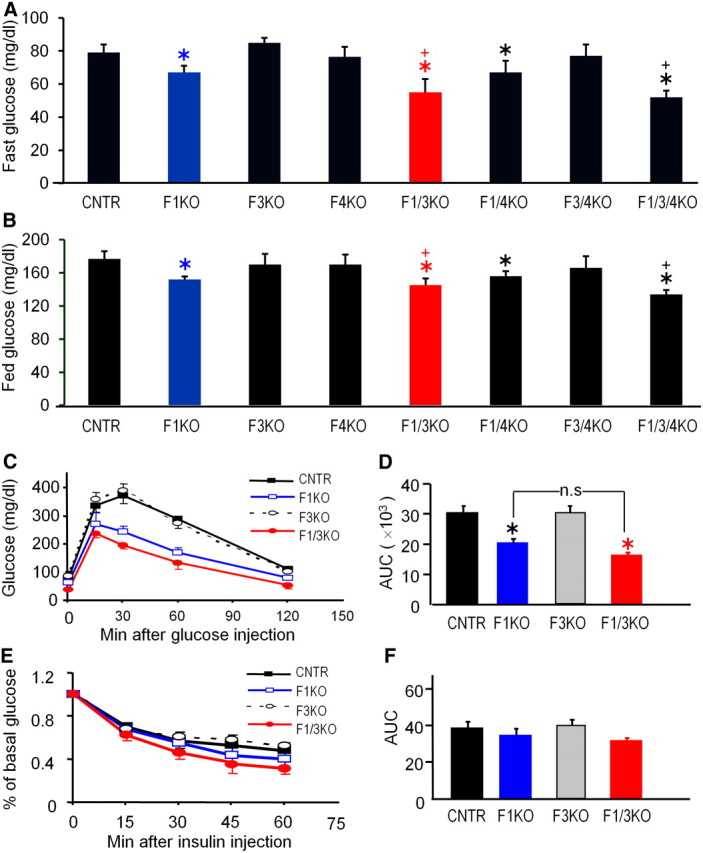
Hepatic inactivation of Foxo1, Foxo3, and Foxo4 differentially reduces blood glucose concentrations. A and B, Blood glucose concentrations in 18 h-fasted and random-fed mice at the age of 10 wk n = 6 mice/group), P < 0.05 vs. control mice (CNTR), +, P < 0.05 vs. F1KO mice, using one-way ANOVA followed by the Bonferroni correction for multiple comparisons. C and D, Glucose tolerance tests were conducted in mice after an 18-h overnight fast. Blood glucose levels (average ± sem, n = 6/group) were determined at the indicated time points after ip injection of 2 g d-glucose/kg body weight. The results are summarized by determining the area under curve (AUC), using Medcalc (version 10). One-way ANOVA was used to compare the groups. *, P < 0.05 vs. control mice. n.s., No significance. E and F, Insulin tolerance tests were performed in nonfasted 12-wk-old mice in each group. Blood glucose (mean ± sem, n = 6) was plotted against the time after the ip insulin injection; the results were summarized by determining the area under curve using Medcac version 10. One-way ANOVA was used to compare the groups.
Hepatic Foxo1 and Foxo3 inactivation synergistically alters lipid homeostasis
We next determined the effect of Foxo inactivation on lipid homeostasis in all of the mutant mice. F1KO, F3KO, F4KO, F1/4KO, and F3/4KO mice had no significant changes in the blood concentrations of triglyceride and total cholesterol; however, F1/3KO and F1/3/4KO mice had significantly elevated serum triglyceride and cholesterol concentrations by nearly 2-fold, compared with control or singular Foxo knockout mice (Fig. 3, A and B). We further performed experiments for quantitative analysis of the content of fatty acids in seven different fatty acid classes in the plasma sample of control and F1/3KO mice. The results indicated that the fatty acid concentrations in cholesterol ester, phosphatidylcholine, and phosphatidylethanolamine were significantly higher in F1/3KO mice compared with those of control mice (Fig. 3C). We also further measured the cholesterol contents in different lipoprotein complexes in the serum of mice. Total cholesterol content and high-density lipoprotein (HDL)- and VLDL/low-density lipoprotein (LDL)-associated cholesterol were all significantly increased in F1/3KO mice compared with control mice, although there was no significant change in F1KO and F3KO mice (Fig. 3D), suggesting there exists a synergistic effect on lipid metabolism following Foxo1 and Foxo3 inactivation.
Fig. 3.
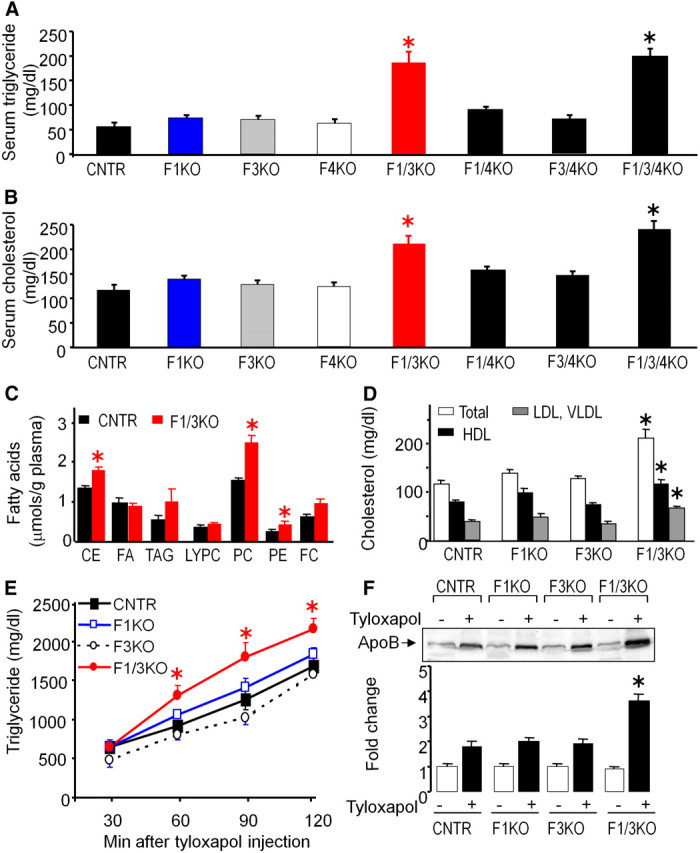
Hepatic Foxo inactivation increases blood triglyceride and cholesterol levels and promotes lipid secretion. Concentrations of serum triglyceride (A) and total cholesterol (B) in 18-h fasted mice were measured. *, P < 0.05 (n = 6). C, The content of fatty acids in seven different lipid classes in serum from 18-h fasted control (CNTR) and F1/3KO mice were measured. Data were the average ± sem from three different experiments in which samples from each group were from a pool of serum from five mice. CE, Cholesterol ester; FA, free fatty acids; TAG, triglycerides; LYPC, lysophosphatidylcholine; PC, phosphatidylcholine; PE, phosphatidylethanolamine; FC, free cholesterol. D, Serum total cholesterol, HDL-cholesterol, and LDL/VLDL-cholesterol levels were measured in 18-h fasted control, F1KO, F3KO, and F1/3KO mice using a commercial assay kit. Error bars represent sem. *, P < 0.05 vs. control mice (n = 4). E, Liver triglyceride secretion was analyzed in 12-wk-old control, F1KO, F3KO, and F1/3KO mice that were fasted for 5 h and then injected with tyloxapol by tail vein. Serum triglyceride concentrations were measured at 30, 60, 90, and 120 min after tyloxapol injection. Error bars represent sem. *, P < 0.05 vs. control mice (n = 4). F, Lipoprotein ApoB-100 levels in serum were analyzed by immunoblotting in 5-h fasted mice or mice after 2 h of tyloxapol injection (20 μg protein/each lane) from control, F1KO, F3KO, and F1/3KO mice. Data are representative from at least three different experiments. *, P < 0.05 vs. control (n = 3).
Given the significant increase in VLDL/LDL cholesterol in F1/3KO mice (66 vs. 38 mg/dl in control, P < 0.01), we examined whether Foxo1 and Foxo3 inactivation altered lipid secretion. We measured lipid secretion rate by tail vein injection of tyloxapol. Tail vein injecting mice with tyloxapol coats lipoprotein particles and inhibits peripheral absorption (32). Upon tyloxapol injection, serum lipid concentrations were increased in all mice; however, the lipid concentration in F1/3KO mice was higher than that of control, F1KO, or F3KO mice at every time point measured after tyloxapol injection (Fig. 3E), suggesting that both Foxo1 and Foxo3 inactivation caused a higher rate of lipid secretion into blood circulation. The lipoprotein ApoB-100 level in serum was markedly increased in all mice after 2 h of tyloxapol injection; however, the ApoB-100 level was much higher in F1/3KO mice than that of control, F1KO, and F3KO mice (Fig. 3F). Together, these results demonstrate that hepatic Foxo1 and Foxo3 inactivation promotes lipid secretion and contributes to elevation of blood lipid concentrations.
We performed histological analysis of the liver from these mice. Although the morphology of hepatocytes in the mice of each group was unchanged by H&E staining, oil-red O stain indicated that F1/3KO livers displayed mild hepatosteatosis, and PAS staining for glycogen was not different (Fig. 4A). Further chemical measurements indicated that triglyceride content was increased by 30% in F1/3KO liver compared with control liver (74.3 ± 6.5 vs. 91 ± 5.1 mg/g, P < 0.05) (Fig. 4B). Hormone measurements indicated that serum insulin concentration was unchanged in the mutant mice in the fasting state, but significantly reduced in F1/3KO mice in the fed state compared with control mice (0.53 ± 0.04 vs. 0.75 ± 0.03 ng/ml, P < 0.05) (Fig. 4B).
Fig. 4.
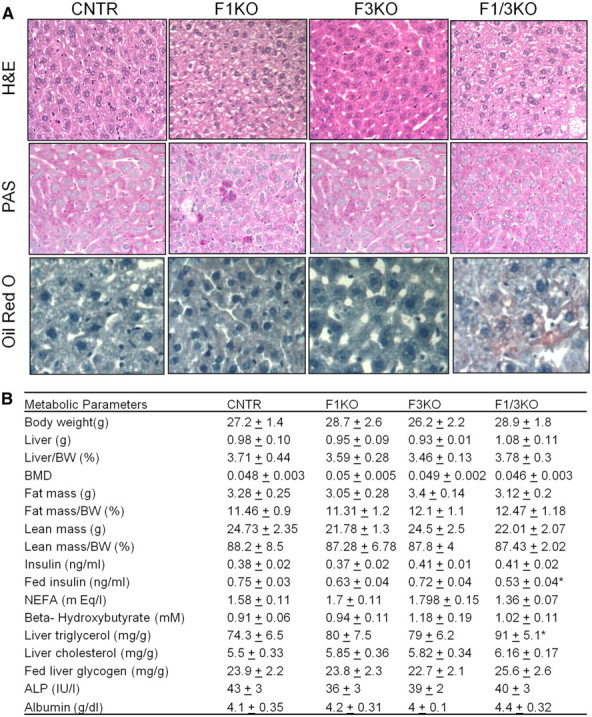
Foxo1 and Foxo3 inactivation induces mild hepatosteatosis. A, Liver morphology was analyzed by H&E stain in liver sections. Liver glycogen and lipid were analyzed by PAS reagent and oil red O stain in fed mice at the age of 10 wk, respectively, and representative sections are shown. (Magnification, ×200 for H&E and PAS, and ×400 for oil red O). B, Metabolic characteristics of the Foxo mutant mice. Data were presented as the average ± sem. Mice at the age of 10 wk, after 18 h fasting in each group, and their littermate controls were analyzed, unless otherwise indicated. CNTR, Control; BMD, bone mineral density; BW, body weight; NEFA, nonesterifed fatty acids; ALP, alkaline phosphatase. *, P < 0.05 vs. control mice (n = 6–8 mice/group).
Hepatic Foxo1 and Foxo3 differentially regulates gluconeogenic and lipogenic gene expression
To delineate the singular and synergistic contributions of hepatic Foxo1 and Foxo3 inactivation to the expression levels of genes key to metabolic regulation, we determined the Foxo1- and/or Foxo3-deficient liver transcriptome using Affymetrix GeneChips. Analysis of RNA samples from the liver of F1KO, F3KO, and F1/3KO mice and corresponding control mice revealed that F1KO liver decreased expression of genes encoding G6pc and Pck1, rate-limiting enzymes for gluconeogenesis, whereas F3KO liver had no such effect (Fig. 5A). However, F3KO liver showed increased expression of genes of lipogenesis, including Fasn and Hmgcr, two key enzymes regulating the synthesis of triglyceride and cholesterol, although F3KO liver demonstrated no effect on the expression of Gck, and F1KO increased Gck gene expression. Real-time PCR analysis confirmed that F1KO significantly reduced the gene transcriptional level of G6pc and Pck1 by 50% (log2-fold = −0.5 vs. control), and F3KO liver had little effect on expression of the two genes, but F1/3KO demonstrated almost completely diminished gene expression of G6pc and gluconeogenic transcription factor Pgc1α (log2-fold = −2.5 vs. control, P < 0.05) (Fig. 5B). By contrast, F3KO liver promoted expression of genes encoding Fasn and Hmgcr, revealing a stronger effect than that of F1KO liver. A synergistic effect of Fasn and Hmgcr stimulation in F1/3KO liver compared with singular F1KO and F3KO liver was also evident (Fig. 5B). Additionally, F1KO and F1/3KO liver reduced expression of other genes, including Irs2 and Igfbp1, whereas expression of Irs1 was unchanged (Fig. 5B). Together, these results indicate that Foxo1 inactivation impaired expression of genes regulating gluconeogenesis, and Foxo3 inactivation preferentially impaired the expression of genes regulating lipid synthesis, although the inactivation of both genes revealed a synergistic effect upon expression of genes controlling glucose and lipid production in the liver.
Fig. 5.
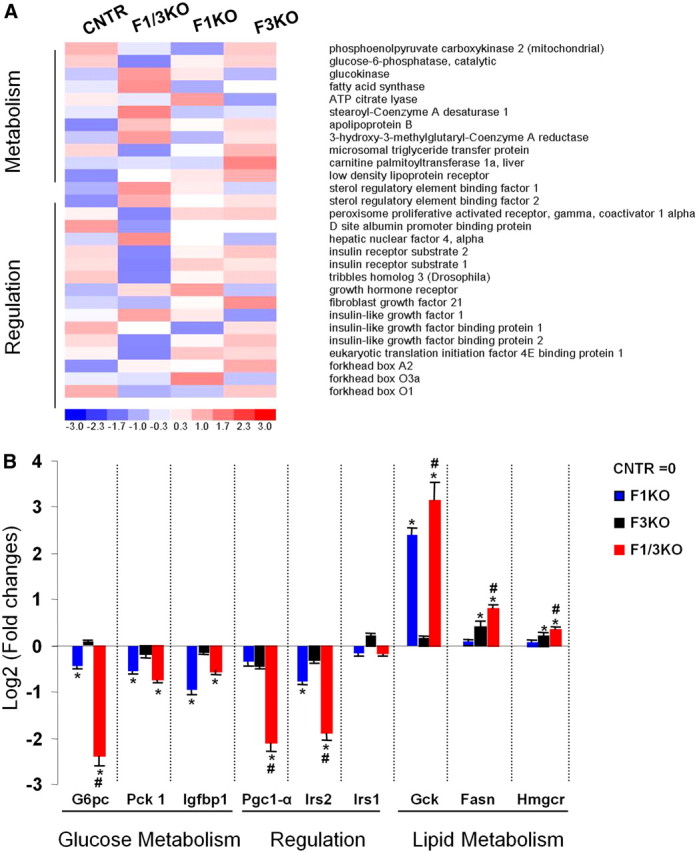
Hepatic Foxo inactivation alters expression levels of genes encoding metabolic enzymes. A, Affymetrix gene-chip analysis of 20 μg of mRNA from the livers of overnight-fasted control (CNTR), F1KO, F3KO, and F1/3KO mice. The blue and red indicate low and high levels of gene expression, respectively. B, Relative gene expression level of several genes regulating glucose and lipid metabolism was independently measured by real-time PCR in the liver of 18-h fasted mice at the ages of 10 wk. Data are presented as relative expression of the gene of interest over cyclophilin at a log2 scale (mean ± sem). Expression level of control liver was set up as log21 = 0. *, P < 0.05 vs. control mice; #, P < 0.05 vs. F1KO mice under the same condition by the Student's t test (n = 3).
Foxo1 and Foxo3 inactivation differently impairs the effect of insulin upon hepatic gene expression in vitro
To examine whether Foxo deficiency impairs the effect of insulin on hepatic gene expression, we isolated and cultured primary hepatocytes from control, F1KO, F3KO, and F1/3KO mice and treated the cells with insulin. Western blot analysis revealed that 100 nm insulin stimulation for 30 min promoted Foxo1 ubiquitylation in control and F3KO hepatocytes and caused an upper shift in Foxo3 protein, an indicative of phosphorylation in control and F1KO hepatocytes (Fig. 6A). Insulin treatment for 6 h suppressed Pck1 and G6Pc expression by at least 30% in control and F3KO hepatocytes. In contrast, the inhibitory effect of insulin was completely abolished in F1KO and F1/3KO hepatocytes (Fig. 6B). In addition, the expression level of Pck1 or G6pc was slightly but significantly reduced in F1KO and F1/3KO cells compared with that of control hepatocytes. On the other hand, insulin stimulated expression of Fasn and Hmgr by 1.5-fold in control cells, whereas F1KO, F3KO, and F1/3KO hepatocytes significantly increased expression of the two genes under both basal condition and insulin stimulation, and synergistic increases of Fasn and Hmgcr were evident in F1/3KO hepatocytes compared with F1KO or F3KO cells (Fig. 6C).
Fig. 6.

Effect of Foxo1 and Foxo3 inactivation upon insulin-regulated hepatic gene expression in mouse primary hepatocytes. A, Effect of insulin on Foxo1 and Foxo3 protein degradation. Mouse primary hepatoctyes isolated from the liver of 12-wk-old control (CNTR), F1KO, F3KO, and F1/3KO mice were cultured and treated were treated with 100 nm insulin for 0.5 h and then protein lysastes analyzed by immunoblotting against antibody of Foxo1, Foxo3, or β-actin. B and C, Effects of insulin on Pck1 and G6pc (B) and Fasn, and Hmgcr (C) gene expression in primary hepatocytes deficient in Foxo genes. The primary hepatocytes from A were cultured and treated with 100 nm insulin for 6 h. Then RNA was extracted and levels of gene expression were analyzed by real-time PCR, and data are presented in comparison with control. *, P < 0.05 indicates the difference between basal level and insulin treatment; #, P < 0.05 indicates the difference between control and other groups without insulin treatment (n = 3 different experiments).
Overexpression of Foxo1 and Foxo3 synergistically regulates hepatic gene expression
To further confirm whether Foxo1 and Foxo3 synergistically affect expression of gluconeogenic and lipogenic gene expression in a gain-of-gene function system in hepatocytes, we cultured HepG2 cells, a human hepatoma cell line, and overexpressed Foxo1 by 600-fold or Foxo3 by 1500-fold compared with the endogenous Foxo1 or Foxo3 level in cells expressing control vector GFP (Fig. 7A). Although it is shown that Foxo3 stimulates Foxo1 gene transcription in fibroblasts (33), overexpression of Foxo3 had no such effect on the endogenous Foxo1 gene expression or vice versa in HepG2 cells (Fig. 7A). Without insulin stimulation, overexpression of Foxo1 or Foxo3 increased Pck1 and G6pc gene expression by at least 2-fold and inhibited Fasn and Hmgcr gene expression by at least 50% compared with expression of GFP (P < 0.05). Overexpression of both Foxo1 and Foxo3 synergistically and significantly increased Pck1 and G6pc expression by more than 4-fold and inhibited Fasn and Hmgcr gene expression by more than 80% (Fig. 7, B and C).
Fig. 7.

Overexpression of Foxo1 and Foxo3 synergistically increases expression of gluconeogenic genes and inhibits expression of lipogenic genes in HepG2 cells. A. Relative mRNA levels of Foxo1 and Foxo3 in HepG2 cells transfected with plasmid DNA expressing GFP (1 μg), Foxo1 (0.5 μg plus 0.5 μg GFP), Foxo3 (0.5 μg Foxo3 plus 0.5 μg GFP), or both Foxo1 and Foxo3 − O1 + 3 (0.5 μg Foxo1 plus 0.5 μg Foxo3) for 30 h were analyzed by real-time PCR. *, P < 0.05 (n = 3 different experiments). B and C., Relative mRNA levels of Pck1 and G6pc (B) and Fasn and Hmgcr (C) in HepG2 cells without or with 100 nm insulin treatment for 24 h after 6 h of gene transfection. HepG2 cells were transfected with 1 μg GFP, Foxo1, Foxo3, or both Foxo1 and Foxo3 (O1 + 3), and RNA was extracted for analysis by real-time PCR. *, P < 0.05 indicates the difference between basal level and insulin treatment; #, P < 0.05 indicates the difference between control and other groups without insulin treatment (n = 3 different experiments).
Effect of hepatic Foxo1 and Foxo3 inactivation upon glucose and lipid homeostasis in db/db mice
To assess the role of hepatic Foxo inactivation in metabolic regulation in diabetes mellitus, we introduced the hepatic deletion of Foxo1, Foxo3, or both genes into the db/db mice and generated F1KO::db/db, F3KO::db/db, and F1/3KO::db/db mice. At 10 wk of age, blood glucose measurements indicated that F1KO::db/db mice had reduced fasting and fed blood glucose concentrations by 40%, whereas F3KO::db/db mice had a slight reduction compared with db/db mice; however, F1/3KO:: db/db mice had reduced fasting and fed blood glucose concentrations by nearly 60% (Fig. 8A). Glucose tolerance tests revealed that F1KO, but not F3KO, improved glucose tolerance. F1/3KO::db/db mice showed a trend toward to further improved glucose tolerance at the set point of time of glucose measurements but did not exhibit a significant difference in the blood glucose measurements compared with F1KO::db/db mice (Fig. 8B). In the insulin tolerance tests, F1/3KO::db/db mice slightly improved, even though insignificantly, the ability of insulin to lower blood glucose concentrations, similar to the F1KO::db/db mice (Fig. 8C).
Fig. 8.
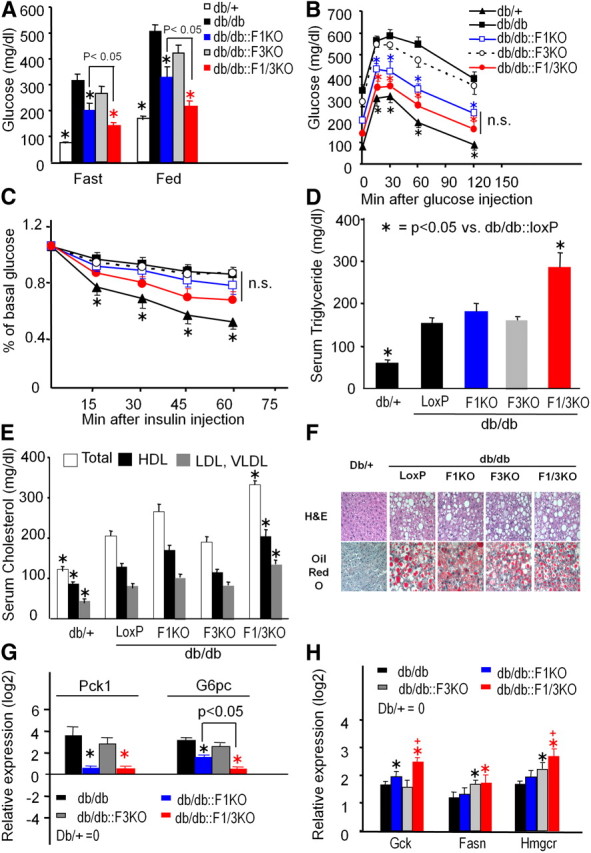
Glucose and lipid homeostasis in db/db mice lacking hepatic Foxo1 and Foxo3 genes. A, Blood glucose concentrations were measured from 18-h fasting or random-fed db/db mice with different Foxo inactivation. Data are shown average ± sem. *, P < 0.05 vs. db/db mice (n = 6). Glucose (B) and insulin tolerance tests (C) of 10-wk-old male db/db mice with hepatic Foxo inactivation. *, P < 0.05 vs. db/db mice. n.s, No significant difference (n = 6). D, Serum triglyceride concentrations of 18-h fasted db/db mice with hepatic Foxo deficiency. *, P < 0.05 vs. db/db mice (n = 4). E, Total cholesterol, HDL-cholesterol, and VLDL/LDL-cholesterol concentrations in serum from 18-h fasted mice. *, P < 0.05 vs. db/db control (n = 4). F, Liver sections of H&E and oil red O staining from db/+ and db/db mice with Foxo inactivation (magnification, ×200) are shown. Photos are representative from at least four sections per genotype. Relative expression levels of genes encoding Pck1 and G6pc (G) and lipogenic enzymes Gck, Fasn, and Hmgcr (H) were measured by real-time PCR in the liver of 18-h fasted mice. Expression level of each gene normalized by cyclophilin are shown at a log2 scale (mean ± sem), and expression level of control liver was set up as log21 = 0. *, P < 0.05 vs. db/db mice; +, <0.05 vs. db/db::F1KO (n = 3).
The serum triglyceride concentration was significantly increased in F1/3KO::db/db mice compared with control db/db mice (Fig. 8D), whereas F1KO::db/db and F3KO::db/db mice did not display a significant difference. Total serum cholesterol, cholesterol in HDL- or LDL/VLDL-lipoportein complex was significantly higher in F1/3KO::db/db mice, compared with control and other singular mutant mice. The VLDL/LDL-cholesterol concentrations were increased by 36% in F1/3KO db/db mice compared with db/db mice (150 vs. 96 mg/dl in db/db mice, P < 0.01) (Fig. 8E). The oil red O staining of liver section analysis indicated that F1KO::db/db, F3KO::db/db, and F1/3KO::db/db mice displayed severe hepatosteatosis similar to the db/db control liver (Fig. 8F).
We measured the gene expression level of G6pc and Pck1 in the liver of these mice. db/db liver demonstrated a markedly increased gene transcriptional level of G6pc, Pck1, and Gck, compared with nondiabetic db/+ liver (Fig. 8, G and H); however, the increase of G6pc and Pck1 in db/db liver was almost completely diminished in F1KO::db/db liver, whereas F3KO::db/db liver had few effects. By contrast, F3KO::db/db liver had a further increase in genes encoding Fasn and Hmgcr, although F1KO::db/db liver further increased Gck gene expression (Fig. 6H). The inhibitory effect of G6pc expression and stimulatory effect of Gck in F1KO::db/db liver compared with db/db liver was further enhanced upon both Foxo1 and Foxo3 deletion.
Discussion
In this study, we have generated Foxo1, Foxo3, and Foxo4 liver-specific knockout mice and characterized the glucose and lipid metabolism in the lean and diabetic db/db mice lacking the hepatic Foxo genes, and demonstrated that Foxo genes differently regulate nutrient homeostasis. Foxo1, Foxo3, and Foxo4 are expressed in the liver of adult mice and all interact with the conserved DNA sequence such as the IRE: TGTTTTG or CAAAACA on the promoter region of target genes, including G6pc, Pck1, and Igfbp-1 (34–38). Here we provided genetic and physiological evidence supporting that Foxo1, rather than Foxo3 or Foxo4 in the liver, served as an essential endogenous transcription factor for the IRE because Foxo1 inactivation in vivo diminished the transcriptional expression of genes encoding the gluconeogenic enzymes (Pck1 and G6pc) and reduced the blood glucose concentration. On the other hand, inactivation of Foxo3 preferentially promoted expression of genes encoding the lipogenic enzymes Fasn and Hmgcr. Inactivation of both Foxo1 and Foxo3 synergistically promoted expression of the lipogenic enzymes including Gck and enhanced the level of serum triglyceride, cholesterol, and lipid secretion and caused hepatosteatosis. Moreover, our data also show that Foxo1 inactivation in the liver of db/db mice diminished G6pc and Pck1 gene expression, reduced the blood glucose concentration, and Foxo3 inactivation elevated blood triglyceride and cholesterol concentrations in the context of Foxo1 inactivation.
Foxo proteins regulate liver metabolism by differentially controlling expression of the target genes, such as G6pc, Pck1, and Gck. There is at least one IRE motif present on the promoter region of Pck1 and at least three IRE motifs present on the promoter of G6pc (7, 34, 38). Although deficiency of Foxo1 rather than Foxo3 decreased expression of G6pc and Pck genes, deletion of both Foxo1 and Foxo3 has synergistic effects on lowering G6pc gene expression and stimulating Gck gene expression in F1/3KO liver, which may enhance the conversion of glucose to glucose-6-phosphate and lower hepatic glucose production, thereby reducing blood glucose concentration. Foxo3 binds the IRE and stimulates G6pc promoter activity in vitro (38), but Foxo1 is required for a full expression of G6pc promoter (7–9). Our data also support that Foxo3 contributes to the expression of G6pc in a Foxo1-dependent manner in vivo. Although Foxo4 is suggested to be involved in regulating glucose homeostasis because it is recently shown that F1/3/4KO mice displayed a further reduction in blood glucose concentration compared with F1/3KO mice (22), the unnoticeable role of Foxo4 in our studies may be from the difference of mouse genetic background most of which are C57/BL6 background in our animals and the expression level of Foxo4 is also lower than that of Foxo1 or Foxo3 (Fig. 1A). Other forkhead transcription factor FoxA2 has been identified to bind the IRE (39). However, in vitro mutagenesis studies revealed that the effect of insulin on Pck1 and Igfbp1 gene transcription does not correlate with the binding of these factors, similar to Foxo3 (37). FoxA2 is suggested to mimic the action of Foxo1 by insulin (40), but recent data indicate that FoxA2 nuclear localization is not responsive to insulin (41) and liver-specific FoxA2 had little effect on glucose homeostasis (22). Other factors that can interact with Foxo1 include cAMP response element-binding protein/p300 (42), CCAAT/enhancer-binding protein-β (43), and Pgc1α (44). The formation of CCAAT/enhancer-binding protein-β-Foxo1-cAMP response element-binding protein/p300 complex may play a key role in promoting gluconeogenic enzymes and Igfbp1 gene expression via the IRE on the promoter regions (42). Alternatively, Foxo1 does not directly bind the promtor region of Gck in which a functional IRE has not been demonstrated, but Foxo1 acts as an inhibitor for expression of Gck gene by suppressing the effect of hepatocyte nuclear factor HNF-4α, a transcription factor that binds the Gck promoter and stimulates Gck gene expression (45). Upon insulin stimulation, Foxo1 is rapidly phosphorylated and ubiquitylated for degradation (13, 14, 28, 38, 46). How Foxo1 modification and degradation is involved in disrupting its transcriptional complex, terminating or triggering target gene transcription, and reducing hepatic glucose production or enhancing lipid metabolism genes needs further investigation.
Several mechanisms likely contribute to the lipid accumulation in the liver of F1/3KO mice. The increased substrate availability may play a key role in enhancing VLDL secretion in the F1/3KO mouse model in both lean and db/db background. With increased substrate availability, F1KO mice elevated VLDL secretion in association with streptozotocin-induced type 1 diabetes (47). Additionally, F1/3/4KO mice receiving a high-fat diet had a reduced level of nicotinamide adenine dinucleotide oxidation to nicotinamide adenine dinucleotide hydroxide ratio that inactivates sirtuin (Sirt)-1, which can promote hepatic lipid accumulation (48). Moreover, Sirt1 serves as a Foxo1 target gene (49) and Sirt1 activates AMP-activated protein kinase to lower lipid levels in HepG2 cells (31). However, inhibition of Foxo1 in both liver and adipose tissue disrupted hepatosteatosis of high-fat diet-fed mice (50), suggesting that Foxo1 in the adipose tissue also plays a key role in regulating hepatic lipid accumulation, in which during fasting state lipolysis from the adipose tissue provides substrates, such as fatty acids, for gluconeogenesis and maintenance of glucose homeostasis. Recently it has been shown that Foxo1 stimulates several key genes controlling the autophagic process (51), a catabolic pathway the inhibition of which promotes hepatic lipid accumulation (52). It is speculated that reduced autophagic process in the liver of F1/3KO liver may also suppress autophagosome formation, which contributes to hepatic lipid accumulation. Regardless, without hepatic Foxo1 and Foxo3, glucose flux favors the lipogenic pathway and enhances lipid secretion from the liver.
Inactivation of Foxo1 and Foxo3 in F1/3KO liver diminished expression of Irs2 and unaltered Irs1, and insulin resistance was not developed in the insulin tolerance tests, which is consistent with results in which we recently demonstrated that Irs1 plays a dominant role in the control of hepatic nutrient homeostasis (3). In the feeding state, hypoglycemia is accompanied by a reduced blood insulin concentration in F1/3KO mice; thus, insulin sensitivity as well as the glycogen content in the liver the level of which was unchanged in F1/3KO mice is maintained, compared with control (Fig. 4B). It is also suggested that Irs2 plays a major role in the fasting or early postprandial period and that Irs1 plays a major role in the feeding or postprandial period for control of insulin action and glucose homeostasis (53). Diminished expression of Irs2 may also cause insulin resistance during the fasting or early postprandial period in fasting F1/3KO mice, in which hypoglycemia occurs with a normal blood insulin concentration (Fig. 4B). On the other hand, F1KO mice with a 50% decrease in hepatic Irs2 gene transcription in the fasting state reduced hepatic glucose production and required a 30% increase of glucose infusion rate to maintain euglycemia in hyperinsulinemic euglycemic clamp analysis, an indicative of enhanced insulin sensitivity (16). Consistent with this finding, the F1KO or F1/3KO mice in both lean and db/db background in our studies also displayed a trend toward improvement in whole-body insulin sensitivity (Figs. 2, E and F, and 8C). We showed that loss of hepatic Foxo1 and Foxo3 in vivo synergistically inhibited expression of G6pc and enhanced expression of Fasn and Hmgcr, whereas overexpression of Foxo1 and Foxo3 synergistically enhanced expression of G6pc and inhibited expression of Fasn and Hmgcr in vitro; however, the loss of Foxo1 or Foxo3 alone can be independent and not synergistic to alter gene expression levels of intracellular signaling components, secreted bioactive peptides, and hormones, including but not limited to the IGF-I, Igfbp1, and fibroblast growth factor-21 (Fig. 5A), which may also contribute to the regulation of insulin sensitivity in the target tissues or the whole body.
Hyperinsulinemia, hyperlipidemia, and hyperglycemia are three features of type 2 diabetes mellitus (54). Based on our studies, we expect that, during the early phase of type 2 diabetes hyperinsulinemia from pancreatic β-cell compensation promotes hepatic Akt activation and inhibits all FoxO, which contributes to reducing hepatic glucose production and increasing hepatic lipid synthesis and secretion and mild hepatostatosis. Lipids, such as palmitic acid, are known to serve as potent insulin desensitizers, and their accumulation in the liver can lead to insulin resistance (55, 56), attenuating Akt signaling and activating Foxo1 and Foxo3 that promote hepatic glucose production and contribute to hyperglycemia in concert with other elements. In the diabetic db/db mice, targeting Foxo1 and Foxo3 in the liver prevented the development of hyperglycemia, whereas hepatosteatosis is not improved. In fact, increased triglyceride and VLDL is observed in insulin-resistant humans before the development of hyperglycemia (57). Although the molecular mechanisms of synergistic activation of gluconeogenesis and inhibition of lipogenesis by Foxo1 and Foxo3 within different cellular context and environment are unclear and await further investigation, a combinatory strategy targeting both the Foxo1 pathway to prevent hyperglycemia and suppressing the lipogenic pathway to lower lipid profiles would be a key in the control of type 2 diabetes mellitus in the future.
Acknowledgments
We thank Drs. Morris F. White and Joseph Majzoub (Children's Hospital Boston) for their support and Dr. Kenneth M. Baker and his group for reading the manuscript. The GeneChips experiments were performed at the Children's Hospital Boston Molecular Genetic Core Facility, and plasma fatty acids measurements were performed at Lipomics Technologies, Inc. (West Sacramento, CA). We also thank Dr. C. Z. Wu (Dana Farber Cancer Institute, Boston, MA) for dCHIP and data statistical analysis.
This work was supported by the American Diabetes Association Junior Faculty Grant JF-7-07-27, the American Heart Association Grant BGIA7880040, and the Texas A&M Heath Science Center Start-up Funds (to S.G.).
Disclosure Summary: The authors have nothing to disclose.
For editorial see page 549
- Apo
- Apolipoprotein
- Fasn
- fatty acid synthase
- F1KO
- Foxo1 knockout
- F1/3KO
- Foxo1 and Foxo3
- F3KO
- Foxo3 knockout
- F4KO
- Foxo4 knockout
- Foxo1
- Forkhead box O1
- Gck
- glucokinase
- GFP
- green fluorescent protein
- G6pc
- glucose-6-phosphatase
- catalytic subunit HDL
- high-density lipoprotein
- H&E
- hematoxylin and eosin
- Hmgcr
- 3-hydroxy-3-methylglutaryl-CoA reductase
- Igfbp1
- IGF-binding protein-1
- IRE
- insulin-responsive element
- Irs1
- insulin receptor substrate-1
- Irs2
- insulin receptor substrate-2
- LDL
- low-density lipoprotein
- PAS
- periodic acid-Shiff
- Pck1
- phosphoenolpyruvate carboxykinase
- Pgc1α
- peroxisome proliferator activated receptor gamma coactivator 1α
- Sirt
- sirtuin
- VLDL
- very low-density lipoprotein.
References
- 1. Saltiel AR , Kahn CR. 2001. Insulin signalling and the regulation of glucose and lipid metabolism. Nature 414:799–806 [DOI] [PubMed] [Google Scholar]
- 2. Michael MD , Kulkarni RN , Postic C , Previs SF , Shulman GI , Magnuson MA , Kahn CR. 2000. Loss of insulin signaling in hepatocytes leads to severe insulin resistance and progressive hepatic dysfunction. Mol Cell 6:87–97 [PubMed] [Google Scholar]
- 3. Guo S , Copps KD , Dong X , Park S , Cheng Z , Pocai A , Rossetti L , Sajan M , Farese RV , White MF. 2009. The Irs1 branch of the insulin signaling cascade plays a dominant role in hepatic nutrient homeostasis. Mol Cell Biol 29:5070–5083 [DOI] [PMC free article] [PubMed] [Google Scholar]
- 4. George S , Rochford JJ , Wolfrum C , Gray SL , Schinner S , Wilson JC , Soos MA , Murgatroyd PR , Williams RM , Acerini CL , Dunger DB , Barford D , Umpleby AM , Wareham NJ , Davies HA , Schafer AJ , Stoffel M , O'Rahilly S , Barroso I. 2004. A family with severe insulin resistance and diabetes due to a mutation in AKT2. Science 304:1325–1328 [DOI] [PMC free article] [PubMed] [Google Scholar]
- 5. Cho H , Mu J , Kim JK , Thorvaldsen JL , Chu Q , Crenshaw EB , Kaestner KH , Bartolomei MS , Shulman GI , Birnbaum MJ. 2001. Insulin resistance and a diabetes mellitus-like syndrome in mice lacking the protein kinase Akt2 (PKBβ). Science 292:1728–1731 [DOI] [PubMed] [Google Scholar]
- 6. Gross DN , van den Heuvel AP , Birnbaum MJ. 2008. The role of FoxO in the regulation of metabolism. Oncogene 27:2320–2336 [DOI] [PubMed] [Google Scholar]
- 7. Guo S , Rena G , Cichy S , He X , Cohen P , Unterman T. 1999. Phosphorylation of serine 256 by protein kinase B disrupts transactivation by FKHR and mediates effects of insulin on insulin-like growth factor-binding protein-1 promoter activity through a conserved insulin response sequence. J Biol Chem 274:17184–17192 [DOI] [PubMed] [Google Scholar]
- 8. Schmoll D , Walker KS , Alessi DR , Grempler R , Burchell A , Guo S , Walther R , Unterman TG. 2000. Regulation of glucose-6-phosphatase gene expression by protein kinase Bα and the forkhead transcription factor FKHR. Evidence for insulin response unit-dependent and -independent effects of insulin on promoter activity. J Biol Chem 275:36324–36333 [DOI] [PubMed] [Google Scholar]
- 9. Yeagley D , Guo S , Unterman T , Quinn PG. 2001. Gene- and activation-specific mechanisms for insulin inhibition of basal and glucocorticoid-induced insulin-like growth factor binding protein-1 and phosphoenolpyruvate carboxykinase transcription. Roles of forkhead and insulin response sequences. J Biol Chem 276:33705–33710 [DOI] [PubMed] [Google Scholar]
- 10. Rena G , Guo S , Cichy SC , Unterman TG , Cohen P. 1999. Phosphorylation of the transcription factor forkhead family member FKHR by protein kinase B. J Biol Chem 274:17179–17183 [DOI] [PubMed] [Google Scholar]
- 11. Brunet A , Bonni A , Zigmond MJ , Lin MZ , Juo P , Hu LS , Anderson MJ , Arden KC , Blenis J , Greenberg ME. 1999. Akt promotes cell survival by phosphorylating and inhibiting a Forkhead transcription factor. Cell 96:857–868 [DOI] [PubMed] [Google Scholar]
- 12. Kops GJ , de Ruiter ND , De Vries-Smits AM , Powell DR , Bos JL , Burgering BM. 1999. Direct control of the Forkhead transcription factor AFX by protein kinase B. Nature 398:630–634 [DOI] [PubMed] [Google Scholar]
- 13. Huang H , Regan KM , Wang F , Wang D , Smith DI , van Deursen JM , Tindall DJ. 2005. Skp2 inhibits FOXO1 in tumor suppression through ubiquitin-mediated degradation. Proc Natl Acad Sci USA 102:1649–1654 [DOI] [PMC free article] [PubMed] [Google Scholar]
- 14. Matsuzaki H , Daitoku H , Hatta M , Tanaka K , Fukamizu A. 2003. Insulin-induced phosphorylation of FKHR (Foxo1) targets to proteasomal degradation. Proc Natl Acad Sci USA 100:11285–11290 [DOI] [PMC free article] [PubMed] [Google Scholar]
- 15. Biggs WH , Meisenhelder J , Hunter T , Cavenee WK , Arden KC. 1999. Protein kinase B/Akt-mediated phosphorylation promotes nuclear exclusion of the winged helix transcription factor FKHR1. Proc Natl Acad Sci USA 96:7421–7426 [DOI] [PMC free article] [PubMed] [Google Scholar]
- 16. Matsumoto M , Pocai A , Rossetti L , Depinho RA , Accili D. 2007. Impaired regulation of hepatic glucose production in mice lacking the forkhead transcription factor Foxo1 in liver. Cell Metab 6:208–216 [DOI] [PubMed] [Google Scholar]
- 17. Dong XC , Copps KD , Guo S , Li Y , Kollipara R , DePinho RA , White MF. 2008. Inactivation of hepatic Foxo1 by insulin signaling is required for adaptive nutrient homeostasis and endocrine growth regulation. Cell Metab 8:65–76 [DOI] [PMC free article] [PubMed] [Google Scholar]
- 18. Altomonte J , Richter A , Harbaran S , Suriawinata J , Nakae J , Thung SN , Meseck M , Accili D , Dong H. 2003. Inhibition of Foxo1 function is associated with improved fasting glycemia in diabetic mice. Am J Physiol Endocrinol Metab 285:E718–E728 [DOI] [PubMed] [Google Scholar]
- 19. Nakae J , Biggs WH , Kitamura T , Cavenee WK , Wright CV , Arden KC , Accili D. 2002. Regulation of insulin action and pancreatic β-cell function by mutated alleles of the gene encoding forkhead transcription factor Foxo1. Nat Genet 32:245–253 [DOI] [PubMed] [Google Scholar]
- 20. Barthel A , Schmoll D , Unterman TG. 2005. FoxO proteins in insulin action and metabolism. Trends Endocrinol Metab 16:183–189 [DOI] [PubMed] [Google Scholar]
- 21. Hosaka T , Biggs WH , Tieu D , Boyer AD , Varki NM , Cavenee WK , Arden KC. 2004. Disruption of forkhead transcription factor (FOXO) family members in mice reveals their functional diversification. Proc Natl Acad Sci USA 101:2975–2980 [DOI] [PMC free article] [PubMed] [Google Scholar]
- 22. Haeusler RA , Kaestner KH , Accili D. 2010. FoxOs function synergistically to promote glucose production. J Biol Chem 285:35245–35248 [DOI] [PMC free article] [PubMed] [Google Scholar]
- 23. Paik JH , Kollipara R , Chu G , Ji H , Xiao Y , Ding Z , Miao L , Tothova Z , Horner JW , Carrasco DR , Jiang S , Gilliland DG , Chin L , Wong WH , Castrillon DH , DePinho RA. 2007. FoxOs are lineage-restricted redundant tumor suppressors and regulate endothelial cell homeostasis. Cell 128:309–323 [DOI] [PMC free article] [PubMed] [Google Scholar]
- 24. Postic C , Magnuson MA. 2000. DNA excision in liver by an albumin-Cre transgene occurs progressively with age. Genesis 26:149–150 [DOI] [PubMed] [Google Scholar]
- 25. Folch J , Lees M , Sloane Stanley GH. 1957. A simple method for the isolation and purification of total lipides from animal tissues. J Biol Chem 226:497–509 [PubMed] [Google Scholar]
- 26. Watkins SM , Lin TY , Davis RM , Ching JR , DePeters EJ , Halpern GM , Walzem RL , German JB. 2001. Unique phospholipid metabolism in mouse heart in response to dietary docosahexaenoic or α-linolenic acids. Lipids 36:247–254 [DOI] [PubMed] [Google Scholar]
- 27. Lo S , Russell JC , Taylor AW. 1970. Determination of glycogen in small tissue samples. J Appl Physiol 28:234–236 [DOI] [PubMed] [Google Scholar]
- 28. Guo S , Dunn SL , White MF. 2006. The reciprocal stability of FOXO1 and IRS2 creates a regulatory circuit that controls insulin signaling. Mol Endocrinol 20:3389–3399 [DOI] [PubMed] [Google Scholar]
- 29. Abid MR , Guo S , Minami T , Spokes KC , Ueki K , Skurk C , Walsh K , Aird WC. 2004. Vascular endothelial growth factor activates PI3K/Akt/forkhead signaling in endothelial cells. Arterioscler Thromb Vasc Biol 24:294–300 [DOI] [PubMed] [Google Scholar]
- 30. Zang M , Zuccollo A , Hou X , Nagata D , Walsh K , Herscovitz H , Brecher P , Ruderman NB , Cohen RA. 2004. AMP-activated protein kinase is required for the lipid-lowering effect of metformin in insulin-resistant human HepG2 cells. J Biol Chem 279:47898–47905 [DOI] [PubMed] [Google Scholar]
- 31. Hou X , Xu S , Maitland-Toolan KA , Sato K , Jiang B , Ido Y , Lan F , Walsh K , Wierzbicki M , Verbeuren TJ , Cohen RA , Zang M. 2008. SIRT1 regulates hepatocyte lipid metabolism through activating AMP-activated protein kinase. J Biol Chem 283:20015–20026 [DOI] [PMC free article] [PubMed] [Google Scholar]
- 32. Li X , Catalina F , Grundy SM , Patel S. 1996. Method to measure apolipoprotein B-48 and B-100 secretion rates in an individual mouse: evidence for a very rapid turnover of VLDL and preferential removal of B-48- relative to B-100-containing lipoproteins. J Lipid Res 37:210–220 [PubMed] [Google Scholar]
- 33. Essaghir A , Dif N , Marbehant CY , Coffer PJ , Demoulin JB. 2009. The transcription of FOXO genes is stimulated by FOXO3 and repressed by growth factors. J Biol Chem 284:10334–10342 [DOI] [PMC free article] [PubMed] [Google Scholar]
- 34. O'Brien RM , Lucas PC , Forest CD , Magnuson MA , Granner DK. 1990. Identification of a sequence in the PEPCK gene that mediates a negative effect of insulin on transcription. Science 249:533–537 [DOI] [PubMed] [Google Scholar]
- 35. Cichy SB , Uddin S , Danilkovich A , Guo S , Klippel A , Unterman TG. 1998. Protein kinase B/Akt mediates effects of insulin on hepatic insulin-like growth factor-binding protein-1 gene expression through a conserved insulin response sequence. J Biol Chem 273:6482–6487 [DOI] [PubMed] [Google Scholar]
- 36. O'Brien RM , Granner DK. 1996. Regulation of gene expression by insulin. Physiol Rev 76:1109–1161 [DOI] [PubMed] [Google Scholar]
- 37. Hall RK , Yamasaki T , Kucera T , Waltner-Law M , O'Brien R , Granner DK. 2000. Regulation of phosphoenolpyruvate carboxykinase and insulin-like growth factor-binding protein-1 gene expression by insulin. The role of winged helix/forkhead proteins. J Biol Chem 275:30169–30175 [DOI] [PubMed] [Google Scholar]
- 38. Onuma H , Vander Kooi BT , Boustead JN , Oeser JK , O'Brien RM. 2006. Correlation between FOXO1a (FKHR) and FOXO3a (FKHRL1) binding and the inhibition of basal glucose-6-phosphatase catalytic subunit gene transcription by insulin. Mol Endocrinol 20:2831–2847 [DOI] [PubMed] [Google Scholar]
- 39. Ghosh AK , Lacson R , Liu P , Cichy SB , Danilkovich A , Guo S , Unterman TG. 2001. A nucleoprotein complex containing CCAAT/enhancer-binding protein β interacts with an insulin response sequence in the insulin-like growth factor-binding protein-1 gene and contributes to insulin-regulated gene expression. J Biol Chem 276:8507–8515 [DOI] [PubMed] [Google Scholar]
- 40. Wolfrum C , Asilmaz E , Luca E , Friedman JM , Stoffel M. 2004. Foxa2 regulates lipid metabolism and ketogenesis in the liver during fasting and in diabetes. Nature 432:1027–1032 [DOI] [PubMed] [Google Scholar]
- 41. Zhang L , Rubins NE , Ahima RS , Greenbaum LE , Kaestner KH. 2005. Foxa2 integrates the transcriptional response of the hepatocyte to fasting. Cell Metab 2:141–148 [DOI] [PubMed] [Google Scholar]
- 42. Guo S , Cichy SB , He X , Yang Q , Ragland M , Ghosh AK , Johnson PF , Unterman TG. 2001. Insulin suppresses transactivation by CAAT/enhancer-binding proteins β (C/EBPβ). Signaling to p300/CREB-binding protein by protein kinase B disrupts interaction with the major activation domain of C/EBPβ. J Biol Chem 276:8516–8523 [DOI] [PubMed] [Google Scholar]
- 43. Qiao L , Shao J. 2006. SIRT1 regulates adiponectin gene expression through Foxo1-C/enhancer-binding protein alpha transcriptional complex. J Biol Chem 281:39915–39924 [DOI] [PubMed] [Google Scholar]
- 44. Puigserver P , Rhee J , Donovan J , Walkey CJ , Yoon JC , Oriente F , Kitamura Y , Altomonte J , Dong H , Accili D , Spiegelman BM. 2003. Insulin-regulated hepatic gluconeogenesis through FOXO1-PGC-1α interaction. Nature 423:550–555 [DOI] [PubMed] [Google Scholar]
- 45. Hirota K , Sakamaki J , Ishida J , Shimamoto Y , Nishihara S , Kodama N , Ohta K , Yamamoto M , Tanimoto K , Fukamizu A. 2008. A combination of HNF-4 and Foxo1 is required for reciprocal transcriptional regulation of glucokinase and glucose-6-phosphatase genes in response to fasting and feeding. J Biol Chem 283:32432–32441 [DOI] [PubMed] [Google Scholar]
- 46. Hall RK , Wang XL , George L , Koch SR , Granner DK. 2007. Insulin represses phosphoenolpyruvate carboxykinase gene transcription by causing the rapid disruption of an active transcription complex: a potential epigenetic effect. Mol Endocrinol 21:550–563 [DOI] [PubMed] [Google Scholar]
- 47. Haeusler RA , Han S , Accili D. 2010. Hepatic FOXO1 ablation exacerbates lipid abnormalities during hyperglycemia. J Biol Chem 285:26861–26868 [DOI] [PMC free article] [PubMed] [Google Scholar]
- 48. Tao R , Wei D , Gao H , Liu Y , DePinho RA , Dong XC. 2011. Hepatic FoxOs regulate lipid metabolism via modulation of expression of the nicotinamide phosphoribosyltransferase gene. J Biol Chem 286:14681–14690 [DOI] [PMC free article] [PubMed] [Google Scholar]
- 49. Xiong S , Salazar G , Patrushev N , Alexander RW. 2011. FoxO1 mediates an autofeedback loop regulating SIRT1 expression. J Biol Chem 286:5289–5299 [DOI] [PMC free article] [PubMed] [Google Scholar]
- 50. Samuel VT , Choi CS , Phillips TG , Romanelli AJ , Geisler JG , Bhanot S , McKay R , Monia B , Shutter JR , Lindberg RA , Shulman GI , Veniant MM. 2006. Targeting foxo1 in mice using antisense oligonucleotide improves hepatic and peripheral insulin action. Diabetes 55:2042–2050 [DOI] [PubMed] [Google Scholar]
- 51. Liu HY , Han J , Cao SY , Hong T , Zhuo D , Shi J , Liu Z , Cao W. 2009. Hepatic autophagy is suppressed in the presence of insulin resistance and hyperinsulinemia: inhibition of FoxO1-dependent expression of key autophagy genes by insulin. J Biol Chem 284:31484–31492 [DOI] [PMC free article] [PubMed] [Google Scholar]
- 52. Singh R , Kaushik S , Wang Y , Xiang Y , Novak I , Komatsu M , Tanaka K , Cuervo AM , Czaja MJ. 2009. Autophagy regulates lipid metabolism. Nature 458:1131–1135 [DOI] [PMC free article] [PubMed] [Google Scholar]
- 53. Kubota N , Kubota T , Itoh S , Kumagai H , Kozono H , Takamoto I , Mineyama T , Ogata H , Tokuyama K , Ohsugi M , Sasako T , Moroi M , Sugi K , Kakuta S , Iwakura Y , Noda T , Ohnishi S , Nagai R , Tobe K , Terauchi Y , Ueki K , Kadowaki T. 2008. Dynamic functional relay between insulin receptor substrate 1 and 2 in hepatic insulin signaling during fasting and feeding. Cell Metab 8:49–64 [DOI] [PubMed] [Google Scholar]
- 54. Brown MS , Goldstein JL. 2008. Selective versus total insulin resistance: a pathogenic paradox. Cell Metab 7:95–96 [DOI] [PubMed] [Google Scholar]
- 55. Griffin ME , Marcucci MJ , Cline GW , Bell K , Barucci N , Lee D , Goodyear LJ , Kraegen EW , White MF , Shulman GI. 1999. Free fatty acid-induced insulin resistance is associated with activation of protein kinase Cθ and alterations in the insulin signaling cascade. Diabetes 48:1270–1274 [DOI] [PubMed] [Google Scholar]
- 56. Samuel VT , Petersen KF , Shulman GI. 2010. Lipid-induced insulin resistance: unravelling the mechanism. Lancet 375:2267–2277 [DOI] [PMC free article] [PubMed] [Google Scholar]
- 57. Lewis GF , Steiner G. 1996. Acute effects of insulin in the control of VLDL production in humans. Implications for the insulin-resistant state. Diabetes Care 19:390–393 [DOI] [PubMed] [Google Scholar]