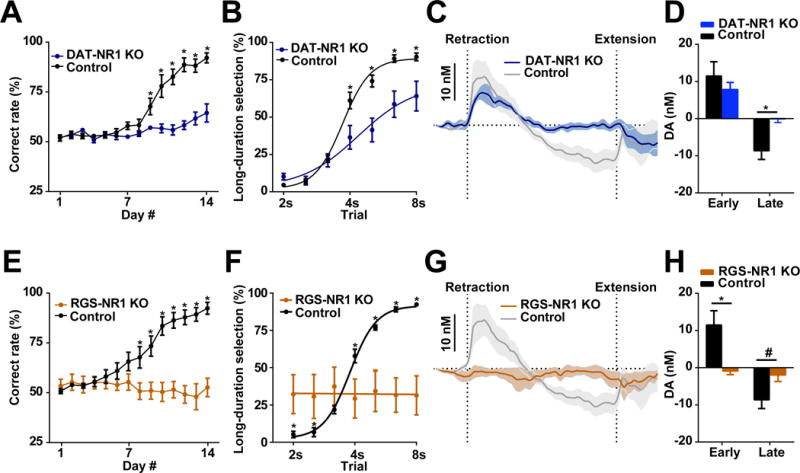
Figure 5. Selectively deleting NMDA receptors in either dopamine or striatal projection neurons disrupts dopamine signaling and alters action selection.

(A) Performance of DAT-NR1 KO mice during 14 days training. n = 7 DAT-NR1 KO, n = 6 control. P < 0.0001; two-way repeated measures ANOVA, significant effect of group; *significant Fisher’s LSD post hoc tests. (B) Psychometric curve of DAT-NR1 KO and control mice. n = 7 DAT-NR1 KO, n = 6 control. P < 0.05; two-way repeated measures ANOVA, significant effect of group; *significant Fisher’s LSD post hoc tests. (C) Dopamine recorded in DAT-NR1 KO mice. n = 4 DAT-NR1 KO, n = 11 control. (D) Dopamine magnitude during early and late phase. n = 4 DAT-NR1 KO, n = 11 control. P > 0.05 for early, P < 0.05 for late; unpaired t-test. (E) Performance of RGS-NR1 KO mice during 14 days training. n = 6 RGS-NR1 KO, n = 9 control. P < 0.01; two-way repeated measures ANOVA, significant effect of group, *significant Fisher’s LSD post hoc tests. (F) Psychometric curve of RGS-NR1 KO mice. n = 6 RGS-NR1 KO, n = 9 control. P < 0.0001; two-way repeated measures ANOVA, significant group × time interaction, *significant Fisher’s LSD post hoc tests. (G) Dopamine recorded in RGS-NR1 KO mice. n = 4 RGS-NR1 KO, n = 11 control. (H) Dopamine magnitude during early and late phase. n = 4 RGS-NR1 KO, n = 11 control. P < 0.05 for early; P = 0.065 for late; unpaired t-test. Dopamine traces are shown as mean ± SEM. * P < 0.05, # P < 0.1.
