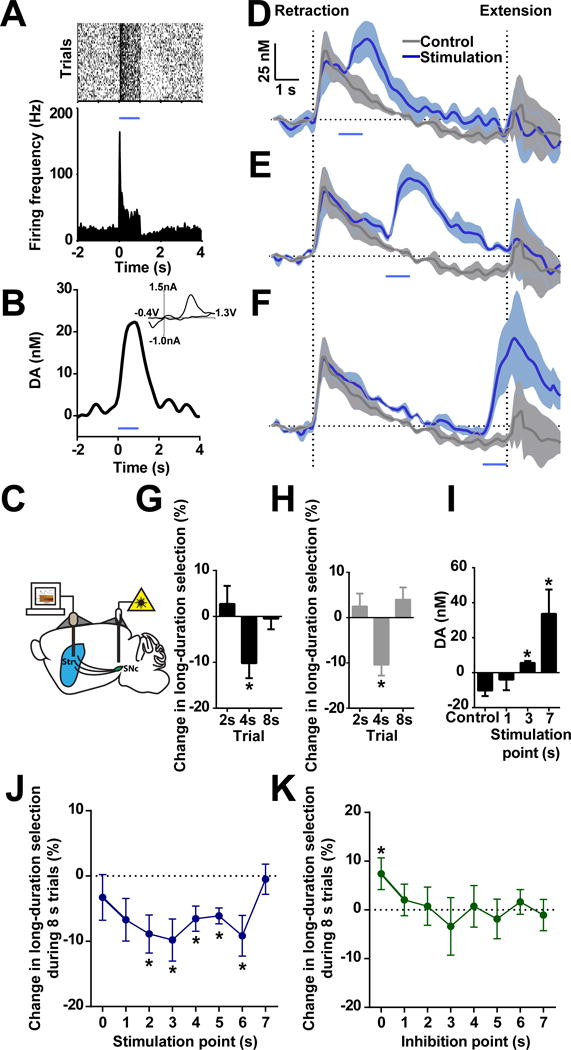
Figure 6. Optogenetic manipulations of dopamine signaling bias action selection.

(A) Optogenetic stimulation of nigral dopamine neuron for 1 s drives firing activity in vivo. Stimulation is shown as blue line for current and following panels. (B) 1 s optogenetic stimulation evokes robust dopamine release. INSET shows current versus voltage identifying the recorded analyte as dopamine. (C) Fiber microelectrode placement in dorsal striatum (Str) and bilateral fiber optic placement in substantia nigra pars compacta (SNc). (D–F) Simultaneous optogenetic stimulation and FSCV recording during optical stimulation at 1 (D), 3 (E), and 7 s (F) in 8 s trials. (G) Immediate behavioral effects under dopamine neuron stimulation. n = 11. P < 0.01 in 4 s trials; P > 0.05 in 2 or 8 s trials; one sample t-test. (H) Immediate behavioral effects while stimulating dopamine terminals in striatum. n = 3. P < 0.05 in 4 s trials; P > 0.05 in 2 or 8 s trials; one sample t-test. (I) Dopamine recorded with optogenetic stimulation at 1, 3 or 7 s. n = 3. P > 0.05 for 1 s; P < 0.05 for 3 and 7 s; paired t-test. (J) Change in long-duration selection in 8 s trials during optogenetic stimulation of dopamine at various time points. n = 11. one sample t-test, *P < 0.05. (K) Change in long-duration selection in the 8 s trials during optogenetic inhibition of dopamine at various time points. n = 7. one sample t-test, *P < 0.05. Dopamine traces are shown as mean ± SEM.
