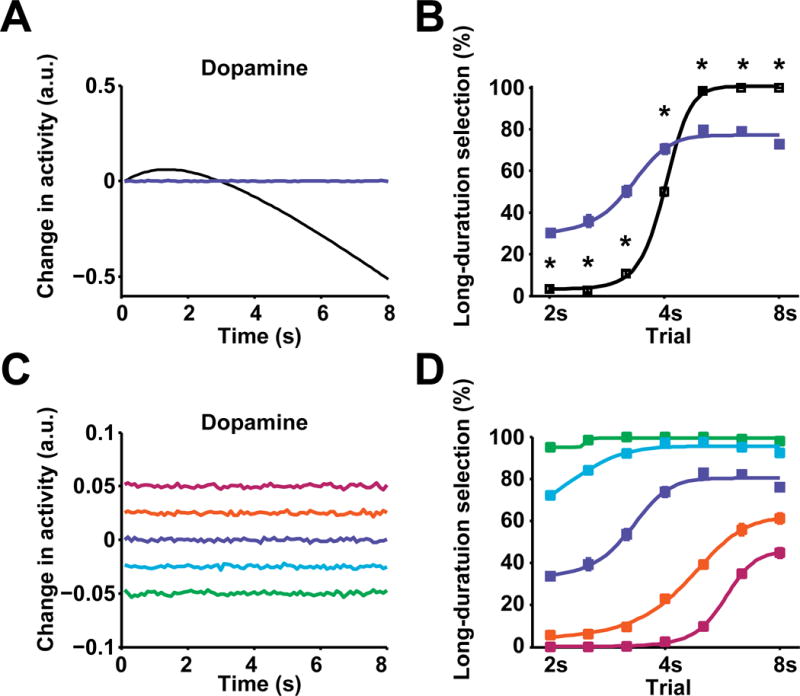
Figure 8. Dynamic dopamine is crucial for optimizing action selection.

(A) Modeled dynamic (black) and constant (blue) dopamine in 8 s trials. (B) Model output of psychometric curve for behavioral choice under dynamic (black, n = 10) and constant dopamine (blue, n = 10; P < 0.0001; two-way repeated measures ANOVA, significant effect of group, *significant Fisher’s LSD post hoc tests,). (C) Modeled dopamine at five different constant levels (−0.05, −0.025, 0, 0.025, 0.05) in 8 s trials. (D) Model output of psychometric curves for behavioral choice under constant dopamine of corresponding levels. Psychometric curves for different dopamine levels are color coded the same as (C). n = 10 modeled subjects.
