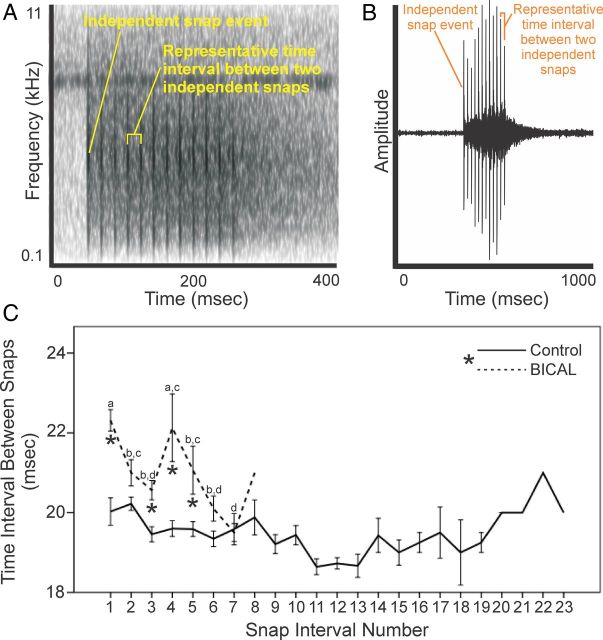
Figure 4.
Effects of peripheral AR on the fine motor pattern of the male's roll-snap signal. A, Spectrogram of a control bird's roll snap. Each black broadband line represents an independent snap event within the series of snaps, which ultimately makes up the roll-snap sonation. The space between independent snap events represents the duration between snaps within a roll snap. B, Waveform diagram of the same roll snap on which between-snap interval measurements were confirmed. Each spike represents a single snap event, within the entire roll-snap signal. The space between spikes represents the time interval between snap events. C, Average time intervals between snap events within a roll-snap for BICAL and control birds. Asterisk in the legend denotes a significant effect of treatment (P < .05). Asterisks below the lower error bars of the BICAL bird data points represent significant differences in the time interval at the specific snap interval compared to controls (post hoc contrasts, P < .05). Differences in letters above error bars represent significant differences between snap interval durations within BICAL birds (post hoc ANOVA with between group comparisons, P < .05). All data represent means ± 1 SEM. Solid line represents controls, whereas dashed line represents BICAL treated birds.

