

Abstract
A major barrier in reversing diabetic complications is that molecular and pathologic effects of elevated glucose persist despite normalization of glucose, a phenomenon referred to as metabolic memory. In the present studies we have investigated the effects of elevated glucose on Schwann cells, which are implicated in diabetic neuropathy. Using quantitative PCR arrays for glucose and fatty acid metabolism, we have found that chronic (>8 wk) 25 mM high glucose induces a persistent increase in genes that promote glycolysis, while inhibiting those that oppose glycolysis and alternate metabolic pathways such as fatty acid metabolism, the pentose phosphate pathway, and trichloroacetic acid cycle. These sustained effects were associated with decreased peroxisome proliferator-activated receptor (PPAR)γ binding and persistently increased reactive oxygen species, cellular NADH, and altered DNA methylation. Agonists of PPARγ and PPARα prevented select effects of glucose-induced gene expression. These observations suggest that Schwann cells exhibit features of metabolic memory that may be regulated at the transcriptional level. Furthermore, targeting PPAR may prevent metabolic memory and the development of diabetic complications.
Diabetic neuropathy is a major complication of diabetes, estimated to develop in approximately 50% of diabetic patients, and is the main cause of nontraumatic amputations in the United States (1). Diabetic neuropathy entails decreased nerve conduction velocity, which indicates a prominent role for Schwann cells because they ensheath peripheral nerves and provide support for nerve conduction and axon regeneration (2). Moreover, high glucose induces oxidative damage in Schwann cells (3, 4), considered a major factor in diabetic complications (5).
A major challenge in treating diabetic complications is that molecular and pathologic features of high glucose are maintained despite excellent control of blood glucose (6, 7), a phenomenon referred to as metabolic memory (8). For example, elevated glucose increases fibronectin and inflammatory mediators, such as IL-1β, nuclear factor-κB, vascular endothelial growth factor, TNFα, TGFβ, and intercellular adhesion molecule 1, and these effects are sustained following normalization of glucose levels in the window of days to weeks (9–11). These changes are associated with altered histone methylation (12, 13) and have been examined in diabetic models related to vascular (11–13) and retinal (10) complications. Although in vivo diabetic neuropathy appears to entail metabolic memory (14), molecular mechanisms mediating this phenomenon in cells relevant to diabetic neuropathy have not been examined.
Previous studies in mice (15) and humans (16) suggest that diabetic neuropathy involves dysregulation of the transcription factor peroxisome proliferator-activated receptor (PPAR)γ. Although drugs that activate PPARγ improve glycemic control in type 2 diabetes (17), the role of PPARγ in metabolic memory has not been examined. Because high glucose produces changes in gene expression that persist after cell division (11, 13), a plausible mechanism for these stable changes is DNA methylation. Genome- and epigenome-wide studies from type 1 diabetic patients indicate methylation changes that may involve changes that occur before and at disease diagnosis (18, 19).
We have employed a spontaneously immortalized IMS32 mouse Schwann cell line (20) to analyze whether metabolic pathways are persistently dysregulated by chronic high glucose and to assess the underlying mechanisms. These cells have been used previously to model diabetes (21, 22) and are normally cultured at 5.6 mM glucose, which corresponds to normal physiologic glucose levels in humans (23). Using these Schwann cells we demonstrate that chronic (>8 wk) but not acute (<2 wk) high glucose induces a persistent increase in glycolysis and decrease in alternate metabolic pathways, including fatty acid metabolism, pentose phosphate pathway, and the trichloroacetic acid (TCA) cycle. Parameters such as oxidative stress and reduced nicotinamide adenine dinucleotide (NADH) availability increase, while ATP levels remain stable. In addition, chronic high glucose is associated with reduced PPARγ binding and persistent changes in DNA methylation. A better understanding of metabolic pathways in these glial cells may provide insight regarding their role in diabetic neuropathy and the molecular changes that drive metabolic memory.
Materials and Methods
Cell culture
IMS32 mouse Schwann cell line (20) was cultured in DMEM containing 5.6 or 25 mM glucose, supplemented with 10% fetal bovine serum and 100 IU/mL penicillin/100 μg/mL streptomycin, and maintained at 5% CO2 on poly-L-lysine coated plates. For pharmacologic prevention of glucose-induced gene memory, cells at 5.6 mM glucose were switched to high glucose with/without 10 μM fenofibrate or pioglitazone (Sigma Chemical Co, St Louis, Missouri).
Quantitative RT-PCR
qRT-PCR was performed as previously described (24). Briefly, RNA was harvested using Trizol Reagent (Invitrogen, Carlsbad, California) using manufacturer's protocol. cDNA was synthesized using RT2 First Strand Kit (SABiosciences, Valencia, California) from 1–3 μg RNA. Glucose metabolism and fatty acid metabolism PCR arrays from SABiosciences were used following the user manual or using primers designed for metabolic genes on Primer3. All data were normalized to housekeeping genes not regulated by glucose conditions (see Supplemental Table 1 for primer details, published on The Endocrine Society's Journals Online web site at http://endo.endojournals.org).
Chromatin immunoprecipitation (ChIP)
Cells (3 × 10⁶ cells/mL) were seeded and cross-linked with 1% formaldehyde. DNA was sheared to 1.0–1.5 kb and verified using 1% agarose gel. Eighty microliters of preimmunoprecipitated lysate (1600 μL total) were saved as “input” for later normalization. Samples were incubated with magnetic Dynabeads (Invitrogen) coated with 7.5 μg PPARγ H-100 (sc-7196 X; Santa Cruz Biotechnology, Inc, Santa Cruz, California) overnight and washed. Chromatin was reverse cross-linked overnight, and DNA was isolated using QIAquick PCR Purification Kit (QIAGEN, Chatsworth, California). Primers targeting PPAR-response elements were designed using MacVector or purchased from SABiosciences (Supplemental Table 2). quantitative PCR (qPCR) was performed using the ABI PRISM 7900HT Sequence Detection System. Each ChIP DNA fractions' Ct value was normalized to the input DNA fraction Ct value for the same qPCR assay to account for sample preparation differences. ΔCt [normalized ChIP] = Ct [ChIP] − (Ct [Input] − Log2[Input Dilution Factor]), where Input Dilution Factor = (fraction of the input chromatin saved)−1, which was 0.05−1. % Input for each ChIP fraction was calculated as: 2−(ΔCt [normalized ChIP]).
Western blot
Cells (3 × 10⁶) were harvested for protein quantification using the NE-PER Nuclear and Cytoplasmic Extraction Kit (ThermoScientific, Pittsburgh, Pennsylvania). Protein concentration was determined by Bradford Protein Assay, and 17 μg protein was loaded into 4%-12% Bis-Tris Gels (Invitrogen) for electrophoresis. Proteins were transferred to polyvinylidene difluoride membrane, blocked with 5% BSA in Tris-buffered saline/Tween 20, and incubated for 48 hours with primary antibodies PPARγ (1:2000) (81B8; Cell Signaling Technology, Danvers, Massachusetts) and actin (1:1000) (A5060; Sigma). The membrane was washed and incubated with peroxidase-conjugated secondary antibody (1:10 000) (111–035-144; Jackson ImmunoResearch Laboratories, West Grove, Pennsylvania) and detected with SuperSignal West Pico Chemiluminescent Substrate (ThermoScientific). The blots were developed and densitometry was quantified using ImageJ. PPARγ levels were normalized to corresponding actin levels.
Oxidative stress
Cells were cultured in DMEM containing 5.6 or 25 mM glucose, and glucose concentration was changed for 4 hours. Reactive oxygen species (ROS) formation was measured using dihydroethidium (Invitrogen), a superoxide indicator, according to user protocol.
ATP and NADH
Cells maintained at 5.6 or 25 mM (>8 wk) glucose were seeded onto collagen-coated 96-well plates. The following day cells were changed to DMEM without phenol red containing metabolites pyruvate, lactate, or β-hydroxybutyrate ketone body (30 mM) for 48 hours. Cells were lysed and ATP was measured using an ATP Determination Kit (Invitrogen) according to the manufacturer's protocol and normalized to protein concentration. For NADH measurements, 10 μl of a 12 mM MTT stock (Invitrogen) was added to each well, after 1 hour 85 μL media was removed and 50 μL dimethylsulfoxide was added. After incubation for 10 minutes, absorbance was measured at 570 nm.
DNA methylation
DNA was isolated using DNeasy Kit (Qiagen) followed by bisulfite conversion with the EZ DNA Methylation-Gold Kit (Zymo Research Corp., Orange, California). PCR was performed with HotStarTaq (Qiagen) with primers designed using EpiDesigner (http://www.epidesigner.com/). Amplified DNA was processed at Albert Einstein Genomics Core using Sequenom MassARRAY (Bronx, New York). MALDI-TOF mass spectrometry data were analyzed using EpiTYPER software. Visualization of data was made using UCSC Genome Browser (NCBI37/mm9 assembly) (25).
Seahorse extracellular flux analysis
Cells were seeded at 20 000 cells per well into an XF96 microplate (Seahorse Biosciences, Billerica, Massachusetts) and changed to 5.6 or 25 mM glucose DMEM 24 hours before measurement. Glycolytic flux was measured using the Seahorse XF96 Analyzer (Seahorse Bioscience) at Albert Einstein Core Facilities (Bronx, New York).
Statistical analysis
Statistical analysis was performed on Prism 5 (GraphPad Software, San Diego, California) using one-way ANOVA followed by Dunnett's Multiple Comparison post hoc test, which compares each condition to the 5.6 mM glucose control group, unless otherwise stated (*, P < .05; **, P < .01; ***, P < .001). All values are expressed as the mean ± SEM (n = 3–8).
Results
Glycolysis
Using qPCR arrays targeting metabolic genes (168 total) (SABiosciences), expression of half of these genes were regulated by chronic (>8 wk) 25 mM high glucose in IMS32 Schwann cells (Supplemental Table 2). This regulation persisted after return to 5.6 mM normal glucose levels for 1 week, thus reflecting a key characteristic of metabolic memory. Enzymes that promote glycolysis were induced by elevated glucose, including hexokinase (Hk2), glucose phosphate isomerase 1 (Gpi1), phosphofructokinase (Pfkl), Aldolase A and C (Aldoc, Aldoa), phosphoglycerate kinase 1 (Pgk1), phosophoglucomutase 1 and 2 (Pgm1,2), and enolase 1 (Eno1) (Figure 1, B–J). Shorter exposure (up to 2 wk) to elevated glucose did not produce these results (Supplemental Figure 1, A–C). In contrast to the persistent induction of glycolytic genes, high glucose persistently inhibited genes that oppose glycolysis, including glucose 6 phosphatase (G6pc3) and fructose bisphosphatase 1 and 2 (Fbp1,2) (Figure 1, K–M). These genes function to antagonize that of Hk2 and Pfkl, which are important rate-limiting steps in glycolysis (Figure 1A). To directly assess changes in glycolytic flux, glycolysis rate was measured using the Seahorse Flux Analysis System. Schwann cells at 25 mM high glucose for 24 hours and 4 weeks exhibited increased glycolysis rate, which persisted after a return to normal glucose for 24 hours (Figure 1N).
Figure 1.

Chronic (>8 wk) 25 mM High Glucose Increases Glycolysis in IMS32 Schwann Cells. A, Schematic diagram of glycolysis. Enzymes that promote glycolysis (italicized right of arrow) and those that oppose glycolysis (italicized left of arrow) are regulated by chronic high glucose in Schwann cells (full gene names listed in Table 1). mRNA levels of proglycolytic (B–J) and antiglycolytic (K–M) enzymes during normal (5.6 mM), chronic (>8 wk) high (25 mM), and chronic high returned to normal glucose conditions. N, Glycolysis rate as measured by extracellular acidification rate of 5.6 mM glucose, 25 mM glucose for 24 hours, 4 weeks, and 4 weeks high glucose returned to normal for 24 hours. Data are represented as mean ± SEM. Asterisks indicate significance by Dunnett's post hoc test compared with the 5.6 mM glucose control group. *, P < .05; **, P < .01; ***, P < .001. mRNA levels are expressed relative to normal glucose following normalization with HK genes Gusb, Hprt1, and Hsp90ab1.
In contrast, expression of genes that promote other metabolic pathways, including fatty acid metabolism, the pentose phosphate pathway (PPP), and the TCA cycle were decreased by chronic (>8 wk) 25 mM high glucose in IMS32 Schwann cells, and these effects were maintained despite normalization of glucose for 1 week. These data are shown in Table 1 with glycolysis gene expression from Figure 1 for comparison. These include rate-limiting enzymes carnitine palmitoyltransferase 1b (Cpt1b), glycerol-3-phosphate dehydrogenase 1 (Gpd1), acetyl-coenzyme A (CoA)-transferase 2 (Acaa2), which regulate fatty acid transfer into the mitochondria, maintain mitochondrial redox potential, and catalyze the last step of the fatty acid spiral, respectively. The PPP is an alternative glucose metabolism pathway, important for the production of nucleic acids and a major source of cytoplasmic reduced NAD phosphate (NADPH) critical for antioxidant defenses (26). Three enzymes that regulate this pathway, including hexose-6-phosphate dehydrogenase (H6pd), transketolase (Tkt), and transaldolase 1 (Taldo1), were persistently inhibited by chronic high glucose (Table 1).
Table 1.
Chronic (>8 wk) 25 mM High Glucose Promotes Increased Glycolysis and Decreased Alternative Metabolic Pathways in Schwann Cells
| Fold Change in mRNA (Relative to Control) ± se. |
||||
|---|---|---|---|---|
| 5.6→25 mM (7 d) | 25 mM (>8 wk) | 25→5.6 (7 d) | ||
| Glucose Metabolism | ||||
| Pro-glycolytic | ||||
| Aldoa | Aldolase A, fructose-bisphosphate | 0.805 ± 0.09a | 1.487 ± 0.13a | 1.368 ± 0.10a |
| Aldoc | Aldolase C, fructose-bisphosphate | 0.993 ± 0.14 | 3.204 ± 0.44a | 2.431 ± 0.20a |
| Eno1 | Enolase 1, α non-neuron | 0.823 ± 0.08 | 1.884 ± 0.17a | 1.595 ± 0.08a |
| Gpi1 | Glucose-6-phosphate isomerase | 0.945 ± 0.09 | 1.719 ± 0.16a | 1.312 ± 0.12a |
| Hk2 | Hexokinase 2 | 0.291 ± 0.28a | 1.803 ± 0.06a | 1.943 ± 0.05a |
| Pfkl | Phosphofructokinase l-type | 0.841 ± 0.13 | 2.026 ± 0.25a | 1.809 ± 0.09a |
| Pgk1 | Phosphoglycerate kinase 1 | 0.674 ± 0.06a | 1.705 ± 0.20a | 1.428 ± 0.11a |
| Pgm1 | Phosphoglucomutase 1 | 1.149 ± 0.13 | 1.509 ± 0.08a | 1.548 ± 0.13a |
| Pgm2 | Phosphoglucomutase 2 | 0.872 ± 0.09 | 1.656 ± 0.19a | 1.463 ± 0.10a |
| Antiglycolytic | ||||
| Fbp1 | Fructose-1,6-bisphosphatase 1 | 1.382 ± 0.11a | 0.049 ± 0.09a | 0.037 ± 0.12a |
| Fbp2 | Fructose-1,6-bisphosphatase 2 | 1.774 ± 0.11a | 0.106 ± 0.11a | 0.063 ± 0.36a |
| G6pc3 | Glucose 6 phosphatase, catalytic, 3 | 0.702 ± 0.09a | 0.601 ± 0.12a | 0.494 ± 0.13a |
| Fatty Acid Metabolism | ||||
| Acaa1a | Acetyl-CoA acyltransferase 1A | 0.933 ± 0.03 | 0.666 ± 0.02a | 0.659 ± 0.02a |
| Acaa2 | Acetyl-CoA acyltransferase 2 | 0.958 ± 0.08 | 0.123 ± 0.04a | 0.11 ± 0.05a |
| Cpt1b | Carnitine palmitoyltransferase 1B | 0.800 ± 0.13 | 0.523 ± 0.05a | 0.401 ± 0.06a |
| Gpd1 | Glycerol-3-phosphate dehydrogenase 1 (soluble) | 0.859 ± 0.19 | 0.329 ± 0.11a | 0.346 ± 0.04a |
| Pentose Phosphate Pathway | ||||
| H6pd | Hexose-6-phosphate dehydrogenase | 0.568 ± 0.13a | 0.387 ± 0.09a | 0.293 ± 0.17a |
| Taldo1 | Transaldolase 1 | 0.822 ± 0.09 | 0.616 ± 0.09a | 0.612 ± 0.09 * |
| Tkt | Transketolase | 1.115 ± 0.05 | 0.765 ± 0.05a | 0.782 ± 0.06a |
| TCA Cycle | ||||
| Aco2 | Aconitase 2, mitochondrial | 0.757 ± 0.06a | 0.453 ± 0.14a | 0.53 ± 0.05a |
| Pdk3 | Pyruvate dehydrogenase kinase, isoenzyme 3 | 1.274 ± 0.05a | 2.277 ± 0.04a | 2.144 ± 0.03a |
| Sucla2 | Succinate-CoA ligase, ADP-forming, β-subunit | 0.367 ± 1.23a | 0.72 ± 0.04a | 0.736 ± 0.05a |
| Sdhb | Succinate dehydrogenase complex, subunit B | 0.985 ± 0.09 | 0.576 ± 0.08a | 0.613 ± 0.07a |
Values greater than 1 indicate increased in mRNA expression, whereas values less than 1 indicate decreased in mRNA expression.
P < .05. mRNA levels are expressed relative to normal 5.6 mM glucose conditions following normalization with HK genes Gusb, Hprt1, and Hsp90ab1
Several genes that regulate the TCA cycle, including aconitase 2 (Aco2), succinyl CoA synthetase (Sucla2), and succinate dehydrogenase b (Sdhb), were persistently inhibited following chronic high glucose in Schwann cells (Table 1). Interestingly, pyruvate dehydrogenase kinase 3 (Pdk3), which inhibits the PDH complex, was persistently induced following exposure to chronic high glucose (Table 1). These findings suggest decreased TCA cycle usage during periods of chronic high glucose. This gene expression profile persisted up to 2 and 4 wk following normalization of glucose levels, as reflected by three highly regulated metabolic genes: Fbp1, Fbp2, and Gpd1 (Figure 2). Thus, the effects of chronic high glucose on metabolic gene expression in Schwann cells were stable and long lasting.
Figure 2.
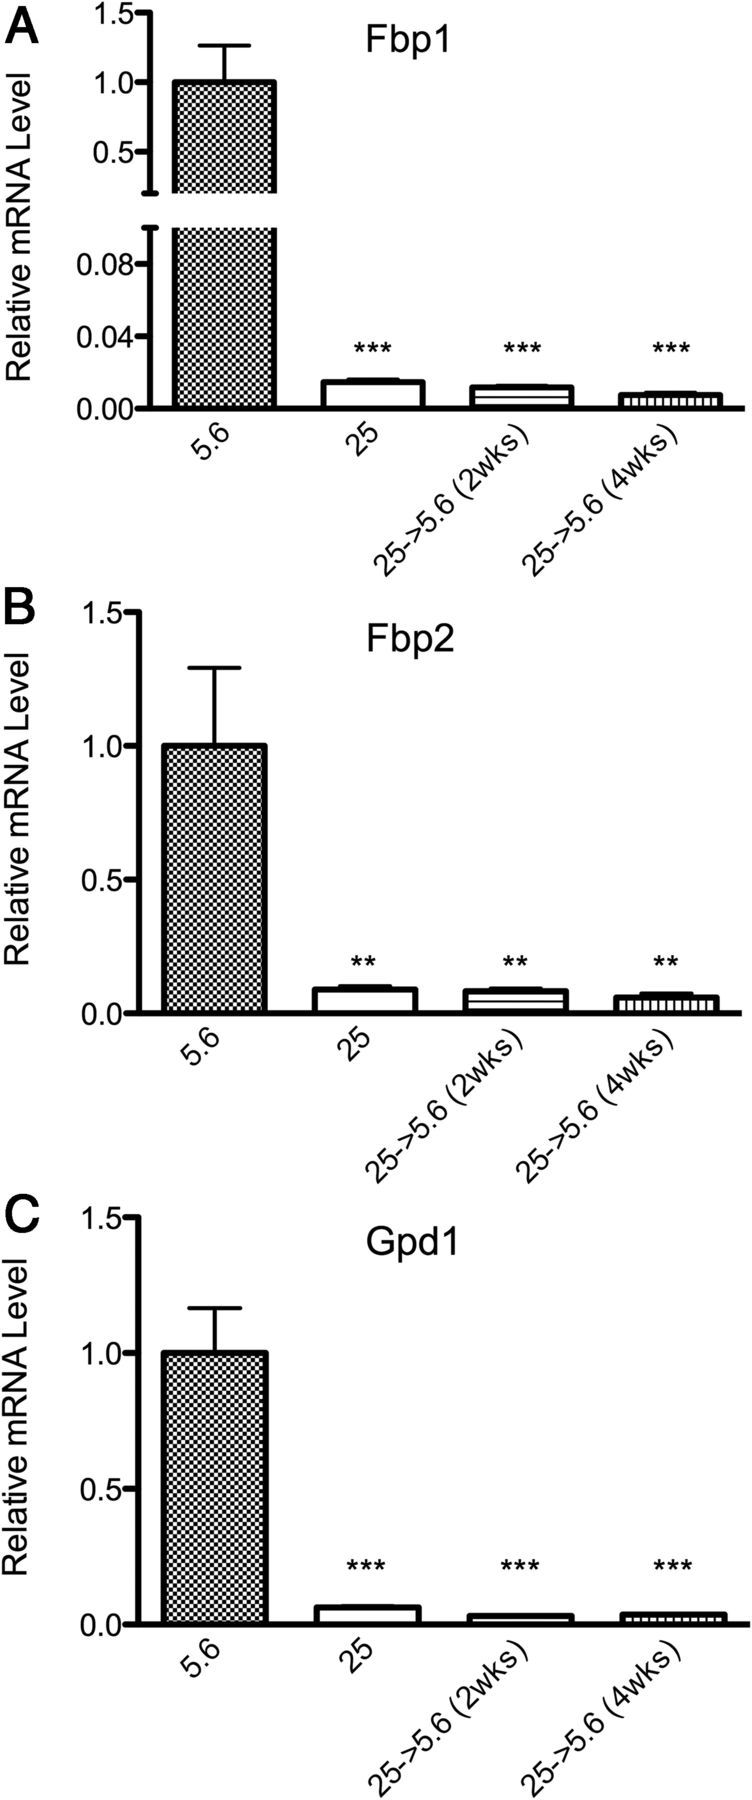
Persistence of Glucose-Induced Gene Memory. A–C, Expression of Fbp1, Fbp2, and Gpd1 at 5.6 mM normal glucose, chronic (>8 wk) 25 mM high glucose, and upon return to 5.6 mM normal glucose for 2 and 4 weeks. Data are represented as mean ± SEM. Asterisks indicate significance by Dunnett's post hoc test compared with the 5.6 mM glucose control group. *, P < .05; **, P < .01; ***, P < .001. mRNA levels are expressed relative to normal glucose after normalization with HK genes Ppib and Hprt1.
To validate the relevance of these in vitro results, we examined metabolic gene expression in sciatic nerve of type 1 diabetic mice (4 wk after induction by streptozotocin [STZ]) and primary human Schwann cells (Supplemental Figure 1). We corroborated that hyperglycemia induces genes that promote glycolysis in sciatic nerve (Supplemental Figure 1, F and G) following exposure to high glucose levels (4 wk). (Primary human Schwann cells were maintained at high glucose for 2 weeks, due to the limited number of cell divisions for primary culture and decreased proliferation during extended culture). Upon exposure of human Schwann cells to 25 mM high glucose for 2 weeks, these cells exhibited a similar profile in key metabolic genes: Pfkl and Fbp2 (Supplemental Figure 1, D and E). Further studies are required to determine the exact period of time required for these metabolic gene expression in an in vivo system; however these findings suggest that our observations in vitro may reflect those that occur in vivo.
Oxidative stress response
Elevated glucose produces oxidative stress in both patients and in vitro and in vivo models of diabetes (3, 4, 27–29). Evidence suggests oxidative stress may constitute a final common pathway to produce diabetic complications (30). To assess whether high-glucose conditions are associated with oxidative stress, levels of ROS were measured using a dihydroethidium assay. Exposure to chronic (>8 wk) 25 mM high glucose increased ROS levels, which persisted after a 4-hour return to normal glucose (Figure 3A). During preliminary studies, we also found short-term exposure (16 hr and 2 wk) to high glucose decreased viability of Schwann cells in response to oxidative stressor rotenone, which was not observed in Schwann cells at normal glucose (Supplemental Figure 2). Thus, increased glucose produces oxidative stress in Schwann cells but not enough to reduce viability unless further oxidative stress is produced, eg, by rotenone.
Figure 3.

The Effect of High Glucose on Oxidative Stress Response, NADH Availability, and ATP Levels. A, Schwann cells maintained at 5.6 mM normal or 25 mM high glucose for more than 8 weeks were measured for ROS formation, and after change of glucose media for 4 hours. B and D, NADH availability and ATP levels at normal and high glucose, and after change to 15 mM glucose for 48 hours. C and E, Effect of the metabolites pyruvate, lactate, and β-hydroxybutyrate ketone body (30 mM) on NADH and ATP for 48 hours. Data are represented as mean ± SEM. Means with different letters are significantly different using Bonferroni post hoc test following one-way ANOVA, P < .05.
Role of NADH
Increased glycolysis is thought to increase cytoplasmic NADH to NAD+ ratios and is observed in several models of diabetic complications (31, 32). Increased NADH may produce oxidative stress by several mechanisms, including oxidation by cytoplasmic NADH oxidase to form superoxide (33). To elucidate whether persistently increased glycolysis corresponds to persistently increased cytoplasmic NADH, available NADH was measured using an MTT assay, in which formation of a purple formazan dye reflects NADH-dependent dehydrogenase activity. Consistent with effects on glycolysis, chronic high glucose corresponded to elevated NADH availability (Figure 3B) and maintained this elevated state when cultured at 15 mM glucose for 48 hours (Figure 3B).
Both the cytoplasm and mitochondria are sources of cellular NADH; therefore, to determine which cellular compartment contributes to NADH during chronic high glucose, we compared NADH availability when Schwann cells were switched to the metabolites pyruvate, lactate, and ketone body, which are metabolized in the mitochondria. Prior exposure to chronic (>8 wk) 25 mM high glucose did not enhance NADH availability using pyruvate, lactate, or β-hydroxybutyrate (Figure 3C). These data are consistent with molecular evidence that chronically increased glucose produces persistently increased glycolytic capacity, but not oxidative phosphorylation in the mitochondria. These data suggest that the cytoplasm is an important source of NADH after chronic exposure to high glucose.
ATP levels
ATP levels vary in diabetic models depending on cell type and glucose conditions (34–36). To determine whether chronic high glucose impinges on the capacity of Schwann cells to produce ATP, we measured ATP produced by metabolites pyruvate, lactate, or β-hydroxybutyrate (30 mM each) for 48 hours. Chronic high glucose had no effect on ATP levels (Figure 3D), but, interestingly, potentiated production of ATP by pyruvate (Figure 3E), opposite the pattern observed for NADH (Figure 3C). Lactate produced much less ATP than pyruvate. One possible explanation is that Schwann cells contain low levels of lactate dehydrogenase and supports evidence that glial cells export lactate to support neuronal energy requirements (37). Similarly the ketone β-hydroxybutyrate did not efficiently produce ATP.
Transcriptional regulation of metabolic pathways
Previous studies suggest impaired PPARγ activity may contribute to diabetic complications in rodent models (15) and humans (16). PPARγ is a nuclear receptor that binds to a conserved PPAR-response element at the promoter of metabolism genes, particularly those involved in fatty acid metabolism. PPARγ agonists, the glitazones, have been used to improve glucose control in type 2 diabetes, whereas PPARα agonists, the fibrates, are used to treat dyslipidemia (38, 39). To assess whether altered PPARγ function contributes to the observed effects of chronic high glucose on gene expression, we carried out a chromatin immunoprecipitation assay using an antibody directed toward PPARγ. As shown in Figure 4A, chronic high glucose decreased PPARγ binding to several target genes including Cpt1b, Acaa2, and Gpd1, consistent with reduced expression of these genes (Table 1). Similarly, chronic high glucose reduced binding of PPARγ to the promoter of (antiglycolytic) Fbp2 promoter (Figure 4A), suggesting reduced PPARγ function during chronic high glucose that is consistent with gene expression changes.
Figure 4.
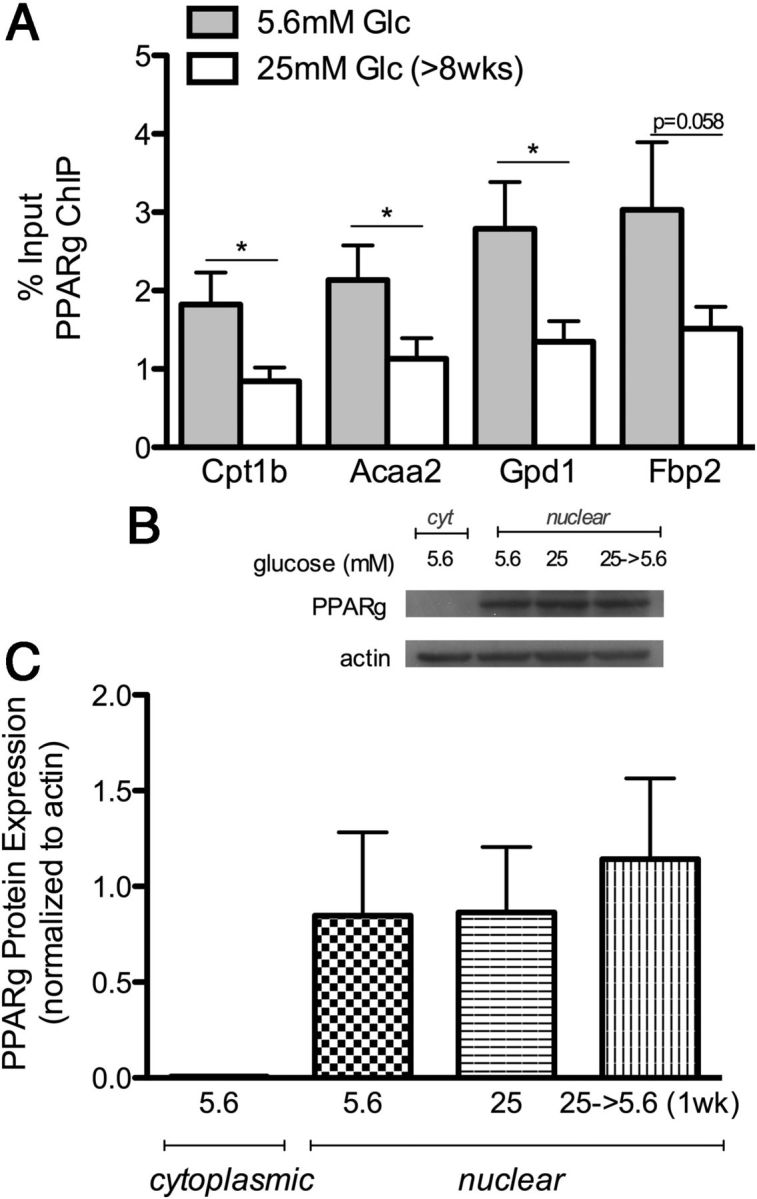
PPARγ ChIP and Protein Expression. A, Schwann cells maintained at 25 mM high glucose (>8 wk) exhibit decreased PPARγ binding to the promoter of Cpt1b, Acaa2, Gpd1, and Fbp2 using chromatin immunoprecipitation. Data are shown as percent input, which represents the DNA sequence enriched by immunoprecipitation with PPARγ antibody normalized to input DNA (n = 8). Student's t test compares 5.6 vs 25 mM glucose (*, P < .05). B, Representative Western blot of PPARγ in the cytoplasmic and nuclear fraction at 5.6 mM glucose, chronic (>8 wk) 25 mM glucose, and after return to 5.6 mM glucose for 1 week. C, Quantification of PPARγ protein levels normalized to actin levels. Data represented as mean ± SEM (n = 3).
To assess whether altered protein levels contributed to decreased PPARγ binding, a Western blot of both nuclear and cytoplasmic fractions was performed. As expected, PPARγ protein was not detected in the cytoplasmic fraction, due to PPAR localization on the nuclear membrane (Figure 4B). Quantification of protein expression showed no difference in PPARγ nuclear protein levels in 5.6 mM normal vs chronic (>8 wk) 25 mM high glucose, nor upon return to normal glucose levels for 1 week (Figure 4C). These data suggest that chronic high glucose conditions retain normal PPARγ levels, but cause inhibited function. One possibility for this discrepancy is regulation of PPARγ at the allosteric level, which may involve stabilization by heteromerization with the retinoid X receptor in the nucleus (40).
To determine whether PPARγ agonism could reverse metabolic memory, Schwann cells at chronic (>8 wk) 25 mM high glucose, or returned to 5.6 mM normal glucose for 1 week, were treated with pioglitazone (10 μM). The expression of genes previously found to be persistently regulated by > 8 weeks high glucose were not altered by administration of pioglitazone (Figure 5, A–C). Perilipin 2 (Plin2) was included in this study due to its role in fatty acid metabolism and its regulation by PPARγ (41). Consistent with other fatty acid metabolism genes, decreased expression of Plin2 after more than 8 weeks high glucose persisted despite 1 week return to normal glucose levels and did not respond to pioglitazone (Figure 5D).
Figure 5.
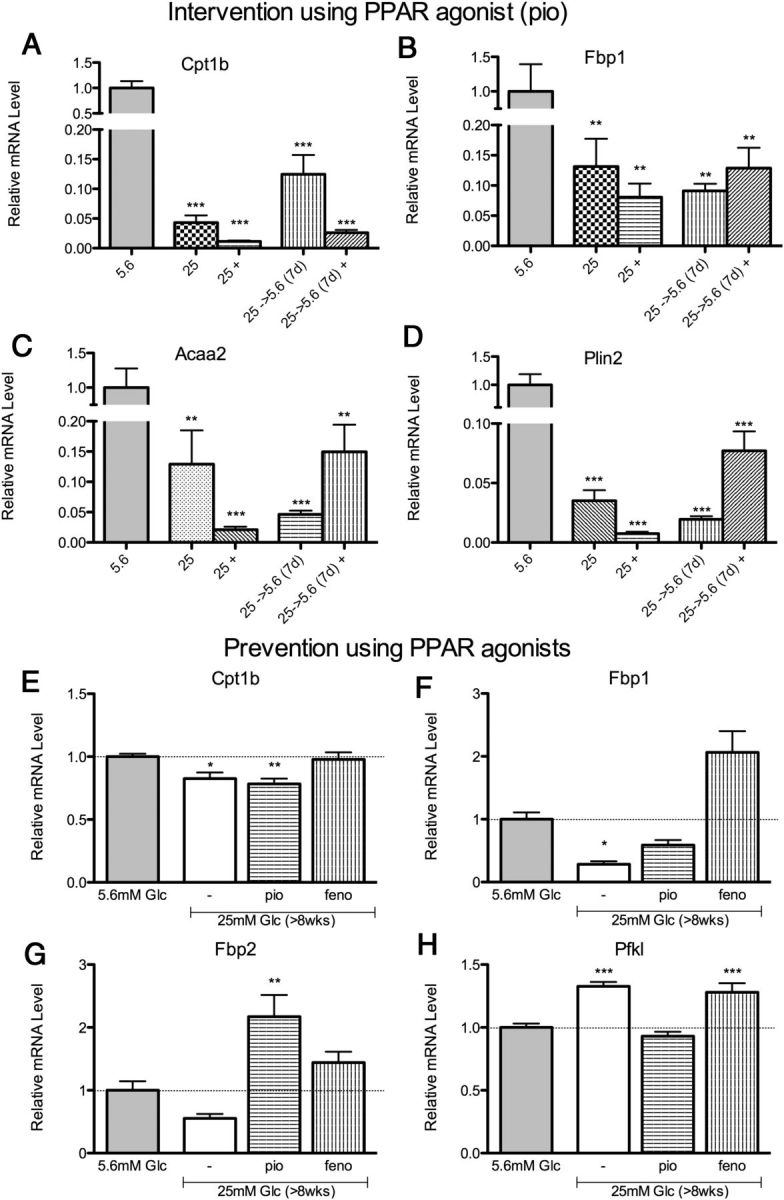
PPAR Agonism to Reverse or Prevent Glucose-Induced Gene Memory. A–D, Intervention of metabolic memory: Following 25 mM high glucose (>8 wk), PPARγ agonist pioglitazone (10 μM) was applied for 1 week, indicated by +. Glucose-induced changes in several metabolic genes (Cpt1b, Fbp2, Acaa2, Plin2) were not reversed using this intervention. E–H, Prevention of metabolic memory: PPARγ agonist (pio) and PPARα agonist (feno) (10 μM each) were applied during exposure to 25 mM high glucose (>8 wk). Glucose-induced changes were selectively prevented in rate-limiting metabolic genes (Cpt1b, Fbp1, Fbp2, Pfkl). Data are represented as mean ± SEM. Asterisks indicate significance by Dunnett's post hoc test compared with the 5.6 mM glucose control group. *, P < .05; **, P < .01; ***, P < .001. mRNA levels are expressed relative to normal glucose after normalization with HK genes Ppib and/or Hprt1.
To address whether PPAR agonism could prevent these glucose-induced changes at an earlier time point, we used both PPARγ and PPARα agonists (10 μM) pioglitazone and fenofibrate, respectively, during exposure to high glucose for 8 weeks (Figure 5, E–H). Both pioglitazone and fenofibrate prevented effects of high glucose on expression of several, but not all, metabolic genes, including Cpt1b, Fbp1, Fbp2, and Pfkl (Figure 5, E–H). It is possible that PPAR agonists may prevent some aspects of metabolic memory before the onset of persistent modifications.
DNA methylation
Based on previous metabolic memory studies, the persistent effects of high glucose suggest a possibility for epigenetic alterations. Both Fbp1 and Fbp2 expression, which were the most inhibited genes in the present study, are regulated by DNA methylation (42). Using the Sequenom EpiTYPER Assay, which uses bisulfite treatment followed by PCR and mass spectrometry, we assessed DNA methylation of Fbp1 and Fbp2 after chronic high glucose and after return to normal glucose levels for 1 week. Primers were designed to target CpG dense regions upstream and within the 5′-untranslated region and first exon of Fbp1 and Fbp2 (Figure 6B and Figure 7B). Chronic (>8 wk) 25 mM high glucose affected DNA methylation at approximately one third of all CpG sites tested (57 total) (colored bars in Figures 6C and 7C). Interestingly, of these sites, 16/18 maintained this DNA methylation profile after return to 5.6 mM normal glucose levels (Figure 6, F–H and J–N and Figure 7, E–G and I–J), thus exhibiting persistent effects on methylation in Schwann cells. Increased methylation was observed at 3 CpG sites during chronic high glucose—1 within the CpG island of Fbp1 and 2 within the promoter region of Fbp2 (green bars; Figures 6C and 7C). Therefore, some CpG sites exhibited methylation that corresponded inversely to the observed gene expression, as would be expected. Interestingly, many CpG sites exhibited decreased methylation as well, both within the CpG island of Fbp1 and closer to the transcription start site of Fbp2 (red bars; Figures 6C and 7C). Thus, depending on the individual CpG site DNA methylation corresponded either positively or negatively with gene expression. These patterns may be dependent on the specific loci of regulation and transcription factor binding and are the subject of further examination. Importantly, almost all of the changes in DNA methylation were not reversed by a return to normal glucose levels.
Figure 6.

DNA Methylation of Fbp1 after Exposure to 25 mM High Glucose (>8 wk) and after Normalization (5.6 mM) for 1 Week. Location of (A) Fbp1 relative to (B) amplicon regions assayed, (C) CpG sites, and (D) CpG island of Fbp1 using UCSC Genome Browser (http:/genome.ucsc.edu/). Black bars indicate individual CpG sites, red bars indicate decreased methylation following high glucose, and green bars indicate increased methylation. F–N, Percent methylation was obtained for each CpG assayed, location corresponding to CpG ID (E), (n = 8), mean ± SEM. one-way ANOVA followed by Dunnett's Multiple Comparison Test compared with 5.6 mM control; *, P < .05; **, P < .01; ***, P < .001. Data for CpG sites within the same fragment after cleavage reactions are shown together (yellow bracket in C) because data for these sites fails to be uniquely informative.
Figure 7.

DNA Methylation of Fbp2 after Exposure to 25 mM High Glucose (>8 wk) and after Normalization (5.6 mM) for 1 Week. Location of (A) Fbp2 relative to (B) amplicon regions assayed and (C) CpG sites using UCSC Genome Browser (http:/genome.ucsc.edu/). Black bars indicate individual CpG sites, red bars indicate decreased methylation following high glucose, and green bars indicate increased methylation. E–J, Percent methylation was obtained for each CpG assayed, location corresponding to CpG ID (D), (n = 8), mean ± SEM. one-way ANOVA followed by Dunnett's Multiple Comparison Test compared with 5.6 mM control; *, P < .05; **, P < .01; ***, P < .001.
Discussion
Previous genome-wide studies have found changes in metabolic gene expression in both humans and mouse models with diabetic neuropathy (15, 16). Recent work has emphasized the role of epigenetic mechanisms in metabolic memory, in which complications persist despite normalization of glucose levels (11–13). These studies have largely examined the effects of high glucose on inflammatory pathways such as NFκB or extracellular matrix-related protein fibronectin (9, 11). However, to date, no study has investigated the persistent effect of high glucose on genes that regulate metabolism. We have found that chronic high glucose (>8 wk) induces a gradual shift in metabolic pathways that occur in diabetic complications and then remain despite treatment or return to normal glucose levels (Figure 1 and Table 1). Specifically, we have found increased expression of genes for glycolytic enzymes accompanied by decreased expression of genes that inhibit glycolysis and those that promote alternative metabolic pathways (Supplemental Table 2). Taken together, these results are consistent with those of in vivo diabetic neuropathy (15), in which sciatic nerve from db/db diabetic mice show elevated glycolytic gene expression, and pathway analysis indicated altered metabolism and PPAR signaling. Metabolic activity, as measured by glycolytic flux, was consistent with a previous study using primary Schwann cells from rats, which found elevated glycolysis rate and decreased efficiency of oxidative phosphorylation after hyperglycemia for 3 days (35).
Although elevated glucose induces oxidative stress in neurons and Schwann cells (43–45), the source of this oxidative stress is unclear. The present studies have found increased ROS levels (Figure 3A and Supplemental Figure 2) that suggest chronic high glucose increases cytoplasmic but not mitochondrial NADH (Figure 3, B and C). Thus we hypothesize that ROS is generated, in part, by increased glycolysis that drives cytoplasmic NADH production and NADH oxidases in the cytoplasm to produce superoxide. Decreased mitochondrial metabolism is in line with in both our gene expression findings and previous studies (35).
Another possible source of oxidative stress is decreased antioxidant capacity during chronic high-glucose conditions. We have found decreased expression of genes that promote the pentose-phosphate pathway (Table 1), an important source of NADPH for glutathione (GSH)-mediated antioxidant regeneration (46). GSH is reduced in diabetic patients (47), associated with increased oxidative stress (48, 49), and administration of antioxidant GSH counteracts some effects of hyperglycemia (50). Thus, decreased PPP production of NADPH and antioxidant defense during chronic hyperglycemia may contribute to lower viability in response to oxidative stress using rotenone (Supplemental Figure 2). This lowered antioxidative capacity combined with increased ROS formation could potentially elevate overall oxidative stress.
To better understand how these persistent gene expression changes are mediated at the transcriptional level, we have investigated the role of transcription factor PPAR and DNA methylation. We demonstrate that chronically elevated glucose reduces PPARγ binding to target genes (Figure 4A). However, the PPARγ agonist pioglitazone was unable to reverse the glucose-induced metabolic memory profile (Figure 5, A–D). It is plausible that chronic high glucose-induced changes in chromatin may prevent access to PPAR-response element on the DNA. Although both PPARγ and PPARα agonists are used to treat metabolic syndrome, PPARγ agonists are approved to control glucose levels in diabetes and PPARα agonists are used to treat hyperlipidemia. PPAR isotypes all bind to a conserved PPAR-response element, and have different levels of expression and association with transcriptional complexes (51). Therefore we employed both PPARγ and PPARα agonists during the development of metabolic memory (>8 wk high glucose), and found a distinct profile by which PPARγ agonist specifically prevented changes in Pfkl (Figure 5H), PPARα agonist prevented changes in Cpt1b (Figure 5E), and both prevented changes in Fbp1 and Fbp2 expression associated with chronic high glucose (Figure 5, F and G). The mechanism by which they differentially or combinatorially regulate target genes is not clear; therefore the effects of dual PPARγ and -α agonists on diabetic complications would be of interest for future studies.
DNA methylation can inhibit Fbp1 expression (52). We have demonstrated that chronic high glucose produced changes in DNA methylation of Fbp1 and Fbp2 in both the promoter and gene body, which persisted despite return to normal glucose (Figures 6 and 7). It is increasingly clear that CpG methylation is a highly dynamic process (53). Although DNA methylation was formerly thought to inhibit gene expression in the context of differentiation, this is now known to be an oversimplification. Many features of DNA methylation are unclear, such as the role of methylation within genes and in non-CpG island regions. In the case in Fbp1, we have observed CpG dinucleotides with either decreased or increased methylation after chronic high glucose (Figures 6 and 7). Moreover, we have found non-CpG islands with both decreased and increased methylation both in the promoter and gene body (Figures 6C and 7C). The persistence of these epigenetic marks despite return to normal glucose levels was associated with persistent changes in gene expression. We therefore hypothesize that DNA methylation may play a key role in the maintenance of metabolic memory. Further examination of the binding of other transcription factors may elucidate the role of methylation to regulate Fbp1 and Fbp2 gene expression during chronic hyperglycemia.
Changes that occur in Schwann cells after chronic hyperglycemia are important because they ensheath the peripheral nerves and are important for nerve conduction, regeneration, and repair, all of which are impaired during diabetes (54). Our studies are the first to reveal persistent changes in Schwann cell metabolism after chronic hyperglycemia. Interestingly, the changes in metabolic pathways, NADH availability, and oxidative stress did not alter ATP levels in chronic (>8 wk) 25 mM high glucose cells (Figure 3, D and E), indicating a homeostatic balance of energy production. Future studies may examine the relationship between Schwann cells and neurons in the peripheral nervous system that induce vulnerability compared with other tissues. There is now evidence that glial cells, such as Schwann cells (55, 56), play a role in maintaining metabolic function in neurons in the central nervous system (CNS). This role includes providing an intermediary source of energy in the form of lactate between blood glucose and neurons (55). We hypothesize that chronically elevated glycolysis in Schwann cells may drive excess lactate supply to the associated axon, which would produce cytoplasmic NADH and oxidative stress and would drive neuropathy. Furthermore, the role of transcriptional and epigenetic mechanisms involved during the development of metabolic memory warrant further investigation. It is possible that prevention of the changes in chromatin state may contribute to better therapy programs and treatment of diabetic complications such as neuropathy.
Acknowledgments
We would like to thank Kazuhiko Watabe for generously providing us with the IMS32 Schwann cell line, Jimmy Huynh (Icahn School of Medicine at Mount Sinai) for his expertise in performing the DNA methylation studies, and Gustavo Palacios (Albert Einstein School of Medicine) for his assistance with glycolytic flux analysis.
These studies were supported by the Juvenile Diabetes Research Foundation.
Disclosure Summary: The authors have nothing to disclose.
Footnotes
- ChIP
- chromatin immunoprecipitation
- CoA
- coenzyme A
- GSH
- glutathione
- NADH
- reduced nicotinamide adenine dinucleotide
- NADPH
- reduced NAD phosphate PPAR, peroxisome proliferator-activated receptor
- PPP
- pentose phosphate pathway
- qPCR
- quantitative PCR
- ROS
- reactive oxygen species
- TCA
- trichloroacetic acid.
References
- 1. Vinik AI , Park TS , Stansberry KB , Pittenger GL. Diabetic neuropathies. Diabetologia. 2000;43(8):957–973. [DOI] [PubMed] [Google Scholar]
- 2. Lehmann HC , Höke A. Schwann cells as a therapeutic target for peripheral neuropathies. CNS Neurol Disord Drug Targets. 2010;9(6):801–806. [DOI] [PMC free article] [PubMed] [Google Scholar]
- 3. Vareniuk I , Pavlov IA , Obrosova IG. Inducible nitric oxide synthase gene deficiency counteracts multiple manifestations of peripheral neuropathy in a streptozotocin-induced mouse model of diabetes. Diabetologia. 2008;51(11):2126–2133. [DOI] [PMC free article] [PubMed] [Google Scholar]
- 4. Russell JW , Sullivan KA , Windebank AJ , Herrmann DN , Feldman EL. Neurons undergo apoptosis in animal and cell culture models of diabetes. Neurobiol Dis. 1999;6(5):347–363. [DOI] [PubMed] [Google Scholar]
- 5. Pop-Busui R , Sima A , Stevens M. Diabetic neuropathy and oxidative stress. Diabetes/Metab Res Rev. 2006;22(4):257–273. [DOI] [PubMed] [Google Scholar]
- 6. The Diabetes Control and Complications Trial ResearchGroup. med[b] The effect of intensive diabetes therapy on the development and progression of neuropathy. The Diabetes Control and Complications Trial Research Group. Ann Intern Med. 1995;122(8):561–568. [DOI] [PubMed] [Google Scholar]
- 7. Writing Team for the Diabetes Control and Complications Trial/Epidemiology of Diabetes Interventions and Complications Research Group. Sustained effect of intensive treatment of type 1 diabetes mellitus on development and progression of diabetic nephropathy: the Epidemiology of Diabetes Interventions and Complications (EDIC) study. JAMA. 2003;290(16):2159–2167. [DOI] [PMC free article] [PubMed] [Google Scholar]
- 8. Ihnat MA , Thorpe JE , Ceriello A. Hypothesis: the 'metabolic memory', the new challenge of diabetes. Diabet Med. 2007;24(6):582–586. [DOI] [PubMed] [Google Scholar]
- 9. Roy S , Sala R , Cagliero E , Lorenzi M. Overexpression of fibronectin induced by diabetes or high glucose: phenomenon with a memory. Proc Natl Acad Sci USA. 1990;87(1):404–408. [DOI] [PMC free article] [PubMed] [Google Scholar]
- 10. Kowluru RA , Zhong Q , Kanwar M. Metabolic memory and diabetic retinopathy: role of inflammatory mediators in retinal pericytes. Exp Eye Res. 2010;90(5):617–623. [DOI] [PMC free article] [PubMed] [Google Scholar]
- 11. El-Osta A , Brasacchio D , Yao D , et al. . Transient high glucose causes persistent epigenetic changes and altered gene expression during subsequent normoglycemia. J Exp Med. 2008;205(10):2409–2417. [DOI] [PMC free article] [PubMed] [Google Scholar]
- 12. Brasacchio D , Okabe J , Tikellis C , et al. . Hyperglycemia induces a dynamic cooperativity of histone methylase and demethylase enzymes associated with gene-activating epigenetic marks that coexist on the lysine tail. Diabetes. 2009;58(5):1229–1236. [DOI] [PMC free article] [PubMed] [Google Scholar]
- 13. Villeneuve LM , Reddy MA , Lanting LL , Wang M , Meng L , Natarajan R. Epigenetic histone H3 lysine 9 methylation in metabolic memory and inflammatory phenotype of vascular smooth muscle cells in diabetes. Proc Natl Acad Sci USA. 2008;105(26):9047–9052. [DOI] [PMC free article] [PubMed] [Google Scholar]
- 14. Chaturvedi N. Metabolic memory in the autonomic neuropathy of diabetes: implications for pathogenesis and patient care. Circulation. 2009;119(22):2865–2867. [DOI] [PubMed] [Google Scholar]
- 15. Pande M , Hur J , Hong Y , et al. . Transcriptional profiling of diabetic neuropathy in the BKS db/db mouse: a model of type 2 diabetes. Diabetes. 2011;60(7):1981–1989. [DOI] [PMC free article] [PubMed] [Google Scholar]
- 16. Hur J , Sullivan KA , Pande M , et al. . The identification of gene expression profiles associated with progression of human diabetic neuropathy. Brain. 2011;134(Pt 11):3222–3235. [DOI] [PMC free article] [PubMed] [Google Scholar]
- 17. Saltiel AR , Olefsky JM. Thiazolidinediones in the treatment of insulin resistance and type II diabetes. Diabetes. 1996;45(12):1661–1669. [DOI] [PubMed] [Google Scholar]
- 18. Bell CG , Teschendorff AE , Rakyan VK , Maxwell AP , Beck S , Savage DA. Genome-wide DNA methylation analysis for diabetic nephropathy in type 1 diabetes mellitus. BMC Med Genomics. 2010;3:33. [DOI] [PMC free article] [PubMed] [Google Scholar]
- 19. Rakyan VK , Beyan H , Down TA , et al. . Identification of type 1 diabetes-associated DNA methylation variable positions that precede disease diagnosis. PLoS Genet. 2011;7(9):e1002300. [DOI] [PMC free article] [PubMed] [Google Scholar]
- 20. Watabe K , Fukuda T , Tanaka J , Honda H , Toyohara K , Sakai O. Spontaneously immortalized adult mouse Schwann cells secrete autocrine and paracrine growth-promoting activities. J Neurosci Res. 1995;41(2):279–290. [DOI] [PubMed] [Google Scholar]
- 21. Sango K , Suzuki T , Yanagisawa H , et al. . High glucose-induced activation of the polyol pathway and changes of gene expression profiles in immortalized adult mouse Schwann cells IMS32. J Neurochem. 2006;98(2):446–458. [DOI] [PubMed] [Google Scholar]
- 22. Sango K , Yanagisawa H , Takaku S , Kawakami E , Watabe K. Immortalized adult rodent Schwann cells as in vitro models to study diabetic neuropathy. Exp Diabetes Res. 2011;2011:374943. [DOI] [PMC free article] [PubMed] [Google Scholar]
- 23. Phillips LS , Olson DE. Diabetes: normal glucose levels should be the goal. Nat Rev Endocrinol. 2012;8(9):510–512. [DOI] [PubMed] [Google Scholar]
- 24. Poplawski MM , Mastaitis JW , Yang XJ , Mobbs CV. Hypothalamic responses to fasting indicate metabolic reprogramming away from glycolysis toward lipid oxidation. Endocrinology. 2010;151(11):5206–5217. [DOI] [PMC free article] [PubMed] [Google Scholar]
- 25. Dreszer TR , Karolchik D , Zweig AS , et al. . The UCSC Genome Browser database: extensions and updates 2011. Nucleic Acids Res. 2012;40(Database issue):D918–D923. [DOI] [PMC free article] [PubMed] [Google Scholar]
- 26. Filosa S , Fico A , Paglialunga F , et al. . Failure to increase glucose consumption through the pentose-phosphate pathway results in the death of glucose-6-phosphate dehydrogenase gene-deleted mouse embryonic stem cells subjected to oxidative stress. Biochem J. 2003;370(Pt 3):935–943. [DOI] [PMC free article] [PubMed] [Google Scholar]
- 27. El Boghdady NA , Badr GA. Evaluation of oxidative stress markers and vascular risk factors in patients with diabetic peripheral neuropathy. Cell Biochem Funct. 2012;30(4):328–334. [DOI] [PubMed] [Google Scholar]
- 28. Russell JW , Berent-Spillson A , Vincent AM , Freimann CL , Sullivan KA , Feldman EL. Oxidative injury and neuropathy in diabetes and impaired glucose tolerance. Neurobiol Dis. 2008;30(3):420–429. [DOI] [PMC free article] [PubMed] [Google Scholar]
- 29. Rösen P , Nawroth PP , King G , Möller W , Tritschler HJ , Packer L. The role of oxidative stress in the onset and progression of diabetes and its complications: a summary of a Congress Series sponsored by UNESCO-MCBN, the American Diabetes Association and the German Diabetes Society. Diabetes-Metab Res Rev. 2001;17(3):189–212. [DOI] [PubMed] [Google Scholar]
- 30. Brownlee M. The pathobiology of diabetic complications: a unifying mechanism. Diabetes. 2005;54(6):1615–1625. [DOI] [PubMed] [Google Scholar]
- 31. Ido Y. Pyridine nucleotide redox abnormalities in diabetes. Antioxid Redox Signal. 2007;9(7):931–942. [DOI] [PubMed] [Google Scholar]
- 32. Williamson JR , Chang K , Frangos M , et al. . Hyperglycemic pseudohypoxia and diabetic complications. Diabetes. 1993;42(6):801–813. [DOI] [PubMed] [Google Scholar]
- 33. Mohazzab KM , Kaminski PM , Wolin MS. NADH oxidoreductase is a major source of superoxide anion in bovine coronary artery endothelium. Am J Physiol. 1994;266(6 Pt 2):H2568–H2572. [DOI] [PubMed] [Google Scholar]
- 34. Matschinsky FM , Pagliara AS , Stillings SN , Hover BA. Glucose and ATP levels in pancreatic islet tissue of normal and diabetic rats. J Clin Invest. 1976;58(5):1193–1200. [DOI] [PMC free article] [PubMed] [Google Scholar]
- 35. Zhang L , Yu C , Vasquez FE , et al. . Hyperglycemia alters the schwann cell mitochondrial proteome and decreases coupled respiration in the absence of superoxide production. J Proteome Res. 2010;9(1):458–471. [DOI] [PMC free article] [PubMed] [Google Scholar]
- 36. Chowdhury SK , Smith DR , Fernyhough P. The role of aberrant mitochondrial bioenergetics in diabetic neuropathy. Neurobiol Dis. 2013;51:56–65. [DOI] [PubMed] [Google Scholar]
- 37. Pellerin L , Pellegri G , Bittar PG , et al. . Evidence supporting the existence of an activity-dependent astrocyte-neuron lactate shuttle. Dev Neurosci. 1998;20(4–5):291–299. [DOI] [PubMed] [Google Scholar]
- 38. Lehmann JM , Moore LB , Smith-Oliver TA , Wilkison WO , Willson TM , Kliewer SA. An antidiabetic thiazolidinedione is a high affinity ligand for peroxisome proliferator-activated receptor γ(PPAR-γ). J Biol Chem. 1995;270(22):12953–12956. [DOI] [PubMed] [Google Scholar]
- 39. Effect of fenofibrate on progression of coronary-artery disease in type 2 diabetes: the Diabetes Atherosclerosis Intervention Study, a randomised study [published correction appears in Lancet. 2001;357(9271):1890]rsqb]. Lancet. 2001;357(9260):905–910. [PubMed] [Google Scholar]
- 40. Venäläinen T , Molnár F , Oostenbrink C , Carlberg C , Peräkylä M. Molecular mechanism of allosteric communication in the human PPARα-RXRα heterodimer. Proteins. 2010;78(4):873–887. [DOI] [PubMed] [Google Scholar]
- 41. Yamazaki T , Shiraishi S , Kishimoto K , Miura S , Ezaki O. An increase in liver PPARγ2 is an initial event to induce fatty liver in response to a diet high in butter: PPARγ2 knockdown improves fatty liver induced by high-saturated fat. J Nutr Biochem. 2011;22(6):543–553. [DOI] [PubMed] [Google Scholar]
- 42. Thompson RF , Atzmon G , Gheorghe C , et al. . Tissue-specific dysregulation of DNA methylation in aging. Aging Cell. 2010;9(4):506–518. [DOI] [PMC free article] [PubMed] [Google Scholar]
- 43. Askwith T , Zeng W , Eggo MC , Stevens MJ. Oxidative stress and dysregulation of the taurine transporter in high-glucose-exposed human Schwann cells: implications for pathogenesis of diabetic neuropathy. Am J Physiol Endocrinol Metab. 2009;297(3):E620–E628. [DOI] [PMC free article] [PubMed] [Google Scholar]
- 44. Obrosova IG , Drel VR , Pacher P , et al. . Oxidative-nitrosative stress and poly(ADP-ribose) polymerase (PARP) activation in experimental diabetic neuropathy: the relation is revisited. Diabetes. 2005;54(12):3435–3441. [DOI] [PMC free article] [PubMed] [Google Scholar]
- 45. Schmeichel AM , Schmelzer JD , Low PA. Oxidative injury and apoptosis of dorsal root ganglion neurons in chronic experimental diabetic neuropathy. Diabetes. 2003;52(1):165–171. [DOI] [PubMed] [Google Scholar]
- 46. Salvemini F , Franzé A , Iervolino A , Filosa S , Salzano S , Ursini MV. Enhanced glutathione levels and oxidoresistance mediated by increased glucose-6-phosphate dehydrogenase expression. J Biol Chem. 1999;274(5):2750–2757. [DOI] [PubMed] [Google Scholar]
- 47. D'Souza B , D'Souza V , Sowmya S , et al. . A comparative study on oxidative stress and antioxidant status in ischemic stroke patients with and without diabetes. Indian J Clin Biochem: IJCB. 2008;23(3):218–222. [DOI] [PMC free article] [PubMed] [Google Scholar]
- 48. Rizzardini M , Lupi M , Bernasconi S , Mangolini A , Cantoni L. Mitochondrial dysfunction and death in motor neurons exposed to the glutathione-depleting agent ethacrynic acid. J Neurol Sci. 2003;207(1–2):51–58. [DOI] [PubMed] [Google Scholar]
- 49. Akhileshwar V , Patel SP , Katyare SS. Diabetic cardiomyopathy and reactive oxygen species (ROS) related parameters in male and female rats: A comparative study. Indian J Clin Biochem: IJCB. 2007;22(1):84–90. [DOI] [PMC free article] [PubMed] [Google Scholar]
- 50. Ceriello A , Giacomello R , Stel G , et al. . Hyperglycemia-induced thrombin formation in diabetes. The possible role of oxidative stress. Diabetes. 1995;44(8):924–928. [DOI] [PubMed] [Google Scholar]
- 51. Schoonjans K , Peinado-Onsurbe J , Lefebvre AM , et al. . PPARα and PPARγ activators direct a distinct tissue-specific transcriptional response via a PPRE in the lipoprotein lipase gene. EMBO J. 1996;15(19):5336–5348. [PMC free article] [PubMed] [Google Scholar]
- 52. Liu X , Wang X , Zhang J , et al. . Warburg effect revisited: an epigenetic link between glycolysis and gastric carcinogenesis. Oncogene. 2010;29(3):442–450. [DOI] [PubMed] [Google Scholar]
- 53. Jones PA. Functions of DNA methylation: islands, start sites, gene bodies and beyond. Nat Rev Genet. 2012;13(7):484–492. [DOI] [PubMed] [Google Scholar]
- 54. Eckersley L. Role of the Schwann cell in diabetic neuropathy. Int Rev Neurobiol. 2002;50:293–321. [DOI] [PubMed] [Google Scholar]
- 55. Viader A , Golden JP , Baloh RH , Schmidt RE , Hunter DA , Milbrandt J. Schwann cell mitochondrial metabolism supports long-term axonal survival and peripheral nerve function. J Neurosci. 2011;31(28):10128–10140. [DOI] [PMC free article] [PubMed] [Google Scholar]
- 56. Verheijen MH , Chrast R , Burrola P , Lemke G. Local regulation of fat metabolism in peripheral nerves. Genes Dev. 2003;17(19):2450–2464. [DOI] [PMC free article] [PubMed] [Google Scholar]