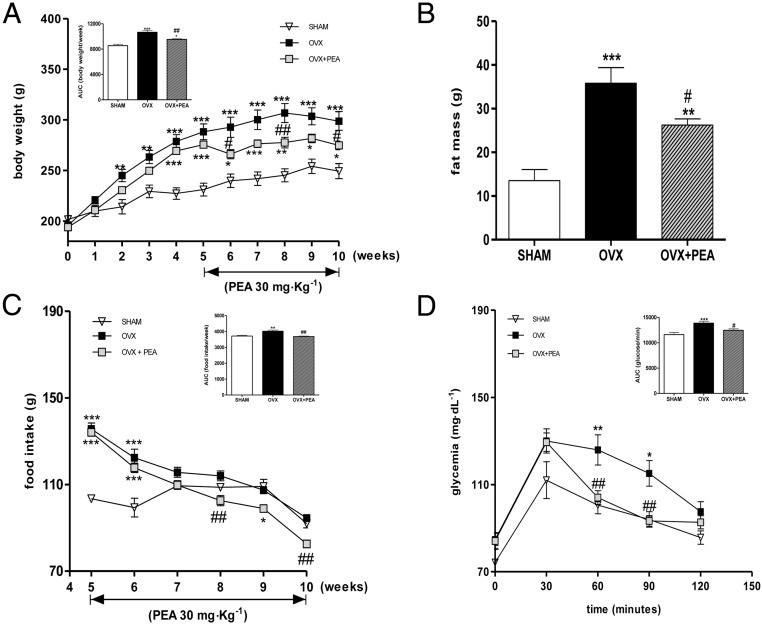
Figure 1.
Body weight and related AUC (A) and fat mass (B) of SHAM and OVX treated or not with PEA are shown. Food intake, monitored once a week in all experimental groups and AUC of food consumption during the treatment period (from 5th to 10th wk) are also reported (C). Glucose tolerance test in all groups was performed and AUC evaluated (D). Data are expressed as mean ± SEM (n = 12 for each group). *, P < .05; **, P < .01; and ***, P < .001 vs SHAM; #, P < .05; ##, P < .01 vs OVX.

