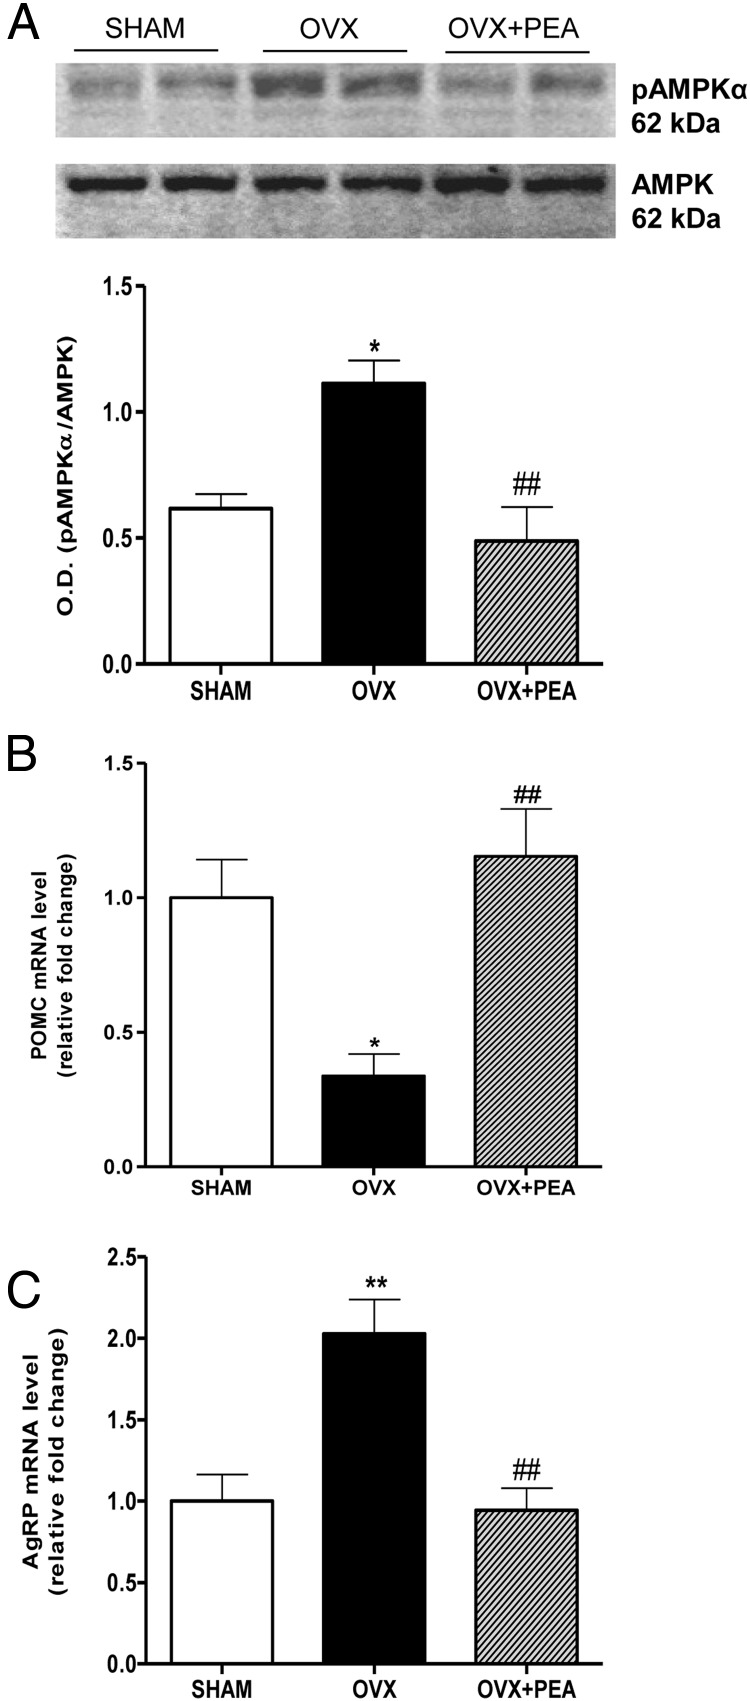
Figure 4.
Levels of hypothalamic pAMPKα and neuropeptide transcription. A representative blot of pAMPKα and AMPK was shown. The ratio from densitometric analysis of bands from all samples are also shown (A). Hypothalamic POMC (B) and AgRP (C) mRNA (relative expression to SHAM) in the hypothalamus are reported. Data are the mean ± SEM of 6 rats per group. *, P < .05 and **, P < .01 vs SHAM; ##, P < .01 vs OVX.

